Universit`a degli Studi di Catania
in convenzione con
Universit`a degli Studi di Palermo
Dottorato di Ricerca Scienza dei Materiali e Nanotecnologie
XXX ciclo
Riccardo Giovanni Urso
EXPERIMENTAL STUDIES OF THE EFFECT OF ENERGETIC PROCESSING ON ASTROPHYSICAL RELEVANT MATERIALS
Tesi di Dottorato
Coordinatore: Prof.ssa Maria Grazia Grimaldi Tutor: Prof. Giuseppe Compagnini
Cotutor: Dott.ssa Maria Elisabetta Palumbo
Contents
I
Material science for Astrophysics
5
1 Introduction 7
1.1 From cold clouds to comets . . . 9
1.2 Gas and Dust . . . 14
1.2.1 The chemistry in star-forming regions . . . 17
1.2.2 Energetic processing . . . 23
1.3 This work . . . 29
II
In the solid phase: on the icy grain mantles 37
2 Combined infrared and Raman study of solid CO 39 2.1 Searching for CO phase changes . . . 402.2 Experimental methods . . . 45 2.2.1 Thickness measurement . . . 48 2.3 Results . . . 54 2.3.1 Temperature experiments . . . 54 2.3.2 Irradiation experiments . . . 57 2.3.3 Increasing Thickness . . . 60 2.4 Discussion . . . 63 3 On the detection of solid deuterated water in
experi-ments 67
3.1 Deuterated water in astrophysically relevant ices . . . 68
3.2 Experimental methods . . . 72
3.3 Results . . . 77
3.3.1 Thermal processing of H2O:HDO=1000:1 mixture 77 3.3.2 Thermal processing of D2O:HDO=3:1 and H2O:HDO=2:1 mixtures . . . 79
3.3.3 Energetic processing . . . 81
3.3.4 Other vibrational features in the 4.1 µm spectral range . . . 87
3.4 Discussion . . . 91
III
Synthesis and desorption: the role of
ener-getic processing
96
4 Synthesis of formamide and isocyanic acid after ion ir-radiation of frozen gas mixtures 98 4.1 The role of energetic processing in the synthesis of pre-biotic molecules . . . 99 4.2 Energetic processing . . . 101 4.2.1 Previous experiments . . . 101 4.2.2 Experimental apparatus . . . 103 4.2.3 Results . . . 106 4.3 Discussion . . . 1144.3.1 Pre- and proto-stellar regions . . . 114
4.3.2 Comets . . . 118
4.3.3 Astrobiological relevance of formamide . . . 123 5 Infrared study on the thermal evolution of solid state
5.1 From the solid-phase synthesis to the gas-phase detection 127 5.2 Experimental methods . . . 132 5.3 Results . . . 136 5.3.1 Pure formamide . . . 136 5.3.2 Formamide in water . . . 140 5.3.3 Formamide in a CO matrix . . . 142
5.3.4 Irradiation of a N2:CH4:H2O=1:1:1 mixture . . . 145
5.4 Discussion . . . 149
IV
From the solid-phase synthesis to the
gas-phase detections
155
6 C2O and C3O in star-forming regions 157 6.1 Carbon chain oxides . . . 1586.2 Observations . . . 161 6.2.1 Source sample . . . 161 6.2.2 New observations . . . 163 6.2.3 C2O and C3O abundances . . . 170 6.3 Modelling . . . 173 6.3.1 Model description . . . 173 6.3.2 Chemical network . . . 176
6.3.3 Results of the modeling . . . 178
6.4 Experimental results . . . 185
6.5 Discussion . . . 191
7 Conclusions 197 7.1 Acknowledgements . . . 214
Part I
Material science for
Astrophysics
Chapter 1
Introduction
The knowledge on the physical and chemical properties of astro-physical bodies, such as planets, comets, asteroids and meteorites, to-gether with primordial matter in star-forming regions, derives from the comparison between astronomical observations and laboratory experi-ments and models that try to simulate their formation and the harsh conditions they experience in space. Modern technology allowed to build sensitive instruments that enabled scientist to acquire interesting data to spread light on the origins of planet Earth and to reconstruct the history of the entire Solar System. As an example, thanks to ra-diotelescopes and ground- and space-based radio infrared observatories, astronomers have found several young Sun-like stars in the Galaxy that allowed a better comprehension of the Solar System formation. More-over, unique in-situ data about the matter on the surface of planets and other minor bodies are furnished by space probes. These data, together with typical laboratory analysis carried out on samples col-lected on Earth, during space missions or on analogues synthesised by simulating space conditions, are fundamental to understand how mat-ter evolved from a crowded environment of simple gas and dust to the present Solar System. Finally, how life emerged on Earth and whether
life exists beyond Earth is a perpetual human query. Material Science, Astrochemistry and Astrobiology are scientific branches that make use of chemistry, physics, astronomy, biology and many other research fields with the aim to spread light on our origins.
1.1
From cold clouds to comets
Star formation takes place in the interstellar medium (ISM), i.e., the space between stars in galaxies. The ISM is characterized by the pres-ence of rarefied material. About 99% in mass is gas, mainly hydrogen. The remaining 1% is due to the presence of silicate and carbonaceous sub-micron dust grains. The ISM composition, temperature and den-sity are highly variable. In particular, two main cold regions can be distinguished, according to temperature and density conditions: diffuse cold clouds and dense molecular clouds.
Diffuse cold clouds are formed by tenuous material ejected by stars at the end of their life, as examples, during Super-Novae explosions or fast winds of Asymptotic Giant Branch (AGB) stars. Typical temper-atures are in the range 10-80 K and density 1 between 0.1-1 cm−3. If
there is enough material, the cooling of diffuse cold clouds determines the formation of dense molecular clouds. Here the temperature drops down to 10-50 K, while density increases up to 104-106 cm−3. It is in these regions that new stars form (e.g., Palla & Stahler 2002; Stahler & Palla 2005). According to their mass, young stellar objects (YSO) are classified in low-mass (M<2 M⊙), intermediate- (2≤M≤6 M⊙) and
high-mass (M>6-8 M⊙)2 YSO (Strom et al. 1975; McKee & Ostriker
2007). Also, it is here that chemical and physical processes determine the formation of both astronomical simple and complex molecules.
1in number of hydrogen atoms cm−3
2M
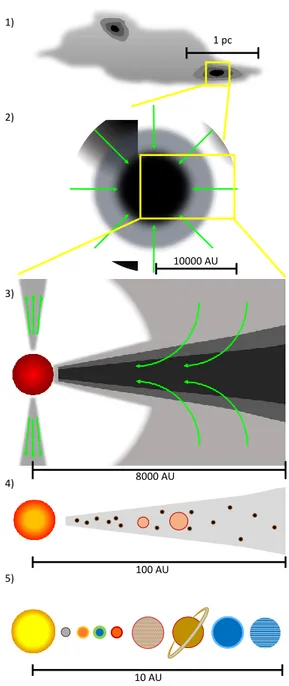
Sun-like star formation can be divided in five formation steps, as shown in Fig.1.1 (Caselli & Ceccarelli 2012):
1. Pre-stellar core 2. Protostellar envelope 3. Protoplanetary disk 4. Planetesimals 5. Planets
In the pre-stellar core formation phase, gravitational energy deter-mines the collapse of a cold cloud of gas and dust. Matter accumulates toward the centre, and the low temperature causes gas-phase atoms and molecules to freeze-out on the dust grain surfaces, forming the so-called icy grain mantles. Despite the low temperature, hydrogen atoms posses mobility enough to scan the icy mantles and hydrogenate atoms and CO molecules, the most abundant species in cold molecular gas after H2, forming H-rich species such as water, formaldehyde and methanol
(see § 1.2.1).
During the protostellar envelope formation, gravitational energy is converted into radiation, so that the envelope around the central object, i.e. the future star, warms up. The higher temperature and the expo-sure to highly energetic charged particles and UV photons determine the formation of new molecular species within the icy grain mantles and eventually their partial sublimation, sputtering and photodesorp-tion. Thus, new molecules might be injected in the gas phase where they can further react increasing the chemical complexity. During the collapse, a fraction of matter is ejected outside the central region as highly supersonic collimated jets and molecular outflows that interact with the surrounding matter and contribute to the sputtering of icy
1 pc 10000 AU 100 AU 10 AU 8000 AU 1) 2) 3) 4) 5)
Figure 1.1: Star-formation steps: 1) pre-stellar core in a cold cloud; 2) zoom on a protostellar envelope undergoing gravitational collapse; 3) within the envelope, a protoplanetary disk forms; 4) planetesimals formation takes place within the circumstellar disk; 5) formation of planets and other minor objects due to planetesimals accretion. Dimen-sion scales are given in parsec, 1 pc=3.086×10¹³ km and astronomical
mantles. These processes inject molecules in the gas phase, allowing their detection by means of radiotelescopes.
In the protoplanetary disk formation, the envelope dissipates and a circumstellar disk appears. About 106 years are necessary up to this
stage. Within the disk a temperature gradient is present. The hotter regions are those closer to the central objects, where further chemi-cal reactions occur. The external regions are colder; temperature is low enough to allow gas-phase molecules to freeze-out again on dust grains, where molecules accreted during the prestellar phase may still be present. Then, planetesimal formation takes place within the circum-stellar disk. Planetesimals are the building blocks of comets, asteroids and planets. They forms when dust grains encounter each other and stick together to form larger agglomerates.
Finally, the further accretion of planetesimals determines the forma-tion of planets (e.g., Pollack et al. 1996). In the crowded environment around them, the left over material forms minor bodies that bombard these objects. Falling on planet surfaces, comets and asteroids release their constituents, as it happened in the primitive Earth between 4.1 and 3.8 billion years ago.
It is generally accepted that during the planetesimal formation a fraction of the icy grain mantles remains trapped in these bodies. Thus, a link between the composition of interstellar matter and comets has been suggested (e.g., Greenberg 1982; Fresneau et al. 2017). An in-triguing issue concerns the extent to which comets preserved the chem-ical composition of pre-solar matter versus the role of further chemchem-ical processes experienced in the latter stages (e.g., Bockel`ee-Morvan et al. 2000).
Thanks to observational facilities, such as radio telescopes and both ground- or space-based infrared telescopes, astronomers have been able to detect volatiles in cometary comae (e.g., Combes et al. 1988; Irvine
et al. 1996; Dutrey et al. 1996; Mumma et al. 1996; Lis et al. 1997; Woodney et al. 1997; Crovisier 1997; Bockel`ee-Morvan et al. 2000). By comparing the species detected with those observed toward star-forming regions in space, it has been possible not only to obtain precious insights into the origins of cometary materials, but also on the evolution of matter from the presolar cloud to the Solar System planet formation.
Interesting information has been obtained by the direct analysis of meteorites. As an example, Moynier et al. (2007) have been able to es-timate the age of the Solar System (found to be 4.568 billion years old) by analysing the chromium isotopic composition in carbonaceous chon-drites, i.e., meteorites composed by primitive cosmic sediments named chondrules (silicate droplets) and Ca-Al and Fe-Ni-metal inclusions em-bedded in a fine grained matrix rich in organic material (Lauretta et al. 2006; Pizzarello et al. 2006; Lantz et al. 2017).
1.2
Gas and Dust
As said in the previous section, the ISM is mainly composed by gas, about 75% in mass being hydrogen. Helium is the second most abundant element, being about 20% in mass. Other heavier elements contribute to the remaining 5%. Generally, neutral atomic and ionized hydrogen are found in diffuse cold clouds, while molecular hydrogen is found in dense molecular clouds.
Despite the harsh conditions, since the first detections reported in the late ‘30s and ‘40s (e.g., Swings and Rosenfeld 1937; McKellar 1940; Douglas and Herzberg 1941), to date about 200 molecules3 have been
detected in the gas phase of the ISM. Their detection has been allowed by radiotelescopes, i.e., parabolic antennas that allow astronomers to acquire spectra in the frequency range of the electromagnetic spectrum where molecular rotational transitions fall, so that it is possible to ob-tain qualitative and quantitative information about molecules present in the observed sources.
Despite the lower abundance w.r.t.4 gas-phase matter, dust is im-portant in the evolution of the ISM and star formation. In fact, the condensation of metals to form planetesimal is considered the starting point of planet formation (e.g., Lindblad 1935). Also, the accretion of the most abundant elements and molecules onto the grain surfaces has been used by van de Hulst (1946) to explain the formation of water, methane and ammonia as interstellar icy grain mantles. Interstellar dust is composed by nonvolatile silicate (e.g., Mg2xFe2−2xSiO4, olivines
3https://www.astro.uni-koeln.de/cdms/molecules
Silicate or carbonaceous
grain
Figure 1.2: Dust grain covered by the icy mantle, a layer of condensed volatile species. H atoms may reach the surface, stick on it and react with frozen molecules (see § 1.2.1). Also, the grains are exposed to UV photons and low-energy cosmic rays that modify the physical structure and chemical composition of icy mantles (see § 1.2.2).
and MgxFe1−xSiO3, pyroxenes) or carbonaceous compounds including
polycyclic aromatic hydrocarbons (PAHs). Each grain is covered by a layer of condensed molecules, mainly water and carbon monoxide and other species in lower abundance that form the icy mantles.
Although interstellar ice models propose that their compounds are mixed together, recent observations suggest that interstellar ices are best represented by a layered ice model (e.g., Fraser et al. 2004; Palumbo 2006) (see Table 1.1 for a list of solid-phase molecules detected toward star forming regions, Boogert et al. 2015; Yamamoto 2014).
Water is the most abundant observed solid-phase molecule in star-forming regions. Its presence has ben reported for the first time toward the Orion Nebula by Gillett and Forrest (1973). Using the University of Minnesota-UCDS 60-inch infrared telescope at Mount Lemmon Ob-servatory (Arizona, USA), they have been able to detect the 3.1µm OH stretching mode band of water. To date, several other solid-phase species have been detected and many other are thought to be present
Table 1.1: The abundance of solid-phase molecules detected toward low- and high-mass young stellar objects and in background stars with respect to water (Boogert et al. 2015).
Species Abundance w.r.t. H2O H2O 100 CO <3-85 CO2 11-50 CH3OH <1-31 NH3 3-10 CH4 1-11 H2CO 2-7 XCN <0.1-1.1 OCS 0.03-1.6 SO2 0.3-0.8
in lower abundance within the icy mantles, but due to detection limits of currently available infrared telescopes they cannot be detected.
In Table 1.1 the abundances of the main molecules trapped in icy grain mantles observed toward young stellar objects w.r.t. water col-umn density are reported.
1.2.1
The chemistry in star-forming regions
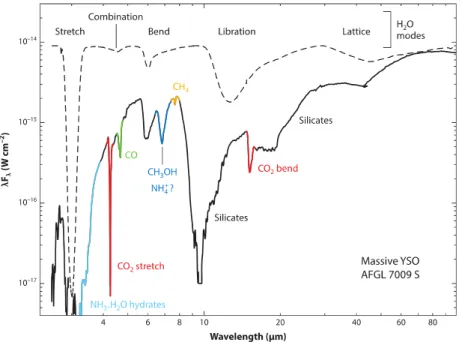
Star-forming regions host hundreds gas-phase molecular species, and as already said, radiotelescopes allow their detection. On the other hand, to obtain information on solid-phase molecules it is needed to ob-serve their vibrational transitions, thus infrared telescopes are needed. In Fig. 1.3 an example of a typical infrared spectrum acquired toward a high-mass YSO is shown (from Boogert et al. 2015). Labels indi-cate the known vibrational features. The attributions mainly derive from the comparison between laboratory experiments in which icy grain mantles analogues are synthesised and analysed by means of infrared spectroscopy (see the dashed line in the figure).
One of the main open issues in astrochemistry is to understand what are the chemical and physical processes that contribute to the formation of both gas-phase and solid-phase molecules observed in star-forming regions. Both gas-phase reactions and solid-phase processes that occur on the surface of dust grains have to be taken into account.
Figure 1.3: Infrared spectrum acquired toward the massive Young Stel-lar Object AFGL 7009S (solid line) and infrared spectrum of water ice spheres at 10 K (dashed line) from Boogert et al. (2015).
Gas-phase chemistry
To study the formation of gas-phase molecules, astrochemists de-veloped several models with the aim to simulate the typical physical and chemical parameters found in these regions, trying to predict the molecular abundance variations as a function of time. In general, to run simulations a list of initial elemental abundances is needed, to-gether with a network of gas-phase reactions and their rate coefficients, given by the Arrhenius formula: k = A(T )exp(−Ea/kBT ), where A(T)
is a pre-exponential factor, a weak function of the temperature that depends on the shape of the reaction potential surface, Ea is the
acti-vation energy, kB is the Boltzmann constant and T is the gas kinetic
temperature. The main reactions taking place in the gas phase of star forming regions can be divided into six classes, and they are reported in Table 1.2. See Chapter 3 in Yamamoto (2014) for more details about gas-phase reactions.
In simulations, the main uncertainties are due to poorly known phys-ical parameters in the region to be modelled (e.g. the cloud density, the temperature and the cosmic-ray ionization rate) and in the rate coeffi-cients of many reactions. To date, several astrochemical models exist, and thanks to the constrains given by observational, theoretical and experimental data (e.g., Loison et al. 2014, 2016) their performances in reproducing the observed abundances of many species are improving. In Chapter 6 other details about astrochemical models and gas-phase reactions are given.
T a b le 1 .2: Cl a sses of ga s-p h ase re ac ti o n s in sta r fo rm in g reg io n s a n d th ei r ty p ica l ra te co effi ci en ts k a s rep o rt ed b y Ca sel li (2 00 5 ). R eac ti o n Pr o cess R at e co effi ci en t Io n -m o lecu le A + + B → C + + D ∼ 1 0 − 9 cm 3 s − 1 D isso ci a ti v e re com b in a ti on AB + + e − → A+ B ∼ 1 0 − 6 cm 3 s − 1 R ad ia ti v e ass o ci at io n A+ B → AB+ h ν ∼ 1 0 − 16 -1 0 − 9 cm 3 s − 1 Neu tr al -n eu tr al A+B → C+ D ∼ 1 0 − 12 -1 0 − 10 cm 3 s − 1 Ph o to d iss o ci a ti o n AB+ h ν → A+ B ∼ 1 0 − 9 s − 1 Ch a rge-tra n sfe r A + + B → A+ B + ∼ 1 0 − 9 cm 3 s − 1
Solid-phase chemistry
Together with gas-phase reactions, dust grain cold surfaces play a fundamental role in the formation of molecules. As an example, the most abundant molecule in these regions, i.e. H2, is formed on the cold
grain surfaces (e.g., Gould & Salpeter 1963; Hollenbach & Salpeter 1971; Pirronello et al. 1999; Mennella et al. 2012). Furthermore, atoms and molecules accrete on dust grain surfaces, allowing chemical reactions that increase the icy mantles chemical complexity.
Due to the low temperature, gas-phase species that collide with dust grains are adsorbed on their cold surfaces, in the so-called sticking process. There are two mechanisms of interaction between the grain surface and the guest species: physisorption, via weak van der Waals forces or chemisorption, via valence forces. However, chemisorption has a potential barrier, and it is generally assumed that in cold sources the sticking occurs via physisorption onto the surface potential min-ima, known as binding sites. Once on the surface, the guest species may desorb by overcoming an energy barrier (Ed in Fig.1.4), either
by sublimation (only for very light species) or by nonthermal mecha-nisms, such as cosmic-ray bombardment by heavy nuclei (e.g., L´eger et al. 1985; Ivlev et al. 2015), energy released by chemical surface reac-tions (e.g., Willacy & Millar 1998). Also, photodesorption is relevant if the amount of UV photons that reach the grains is enough, such as in the so-called photodissociation regions (PDR) or diffuse clouds (e.g., Paardekooper et al. 2016).
As the guest species are adsorbed on the grain surfaces, icy mantles are formed and a complex surface chemistry begins. Surface reactions can be divided into three classes: Langmuir-Hinshelwood, Eley-Rideal and the hot atom. All processes are schematically shown in Fig. 1.4. In
Langmuir-Hinshelwood
tunneling T. hopping
Eley-Rideal Hot atom
sticking
Ed
Eb
Figure 1.4: Mechanism of accretion, desorption or diffusion and reaction of guest atoms or molecules on the cold dust grain surfaces; adapted from Fig. 9 by Herbst & van Dishoeck (2009).
the Langmuir-Hinshelwood mechanism, diffusion takes place by tunnel-ing or thermal hopptunnel-ing between two adjacent bindtunnel-ing sites, if the guest posses the energy Eb. When two guests encounter each other in the
same binding site they can react, releasing the exceeding energy to the grain. In the Eley-Rideal mechanism, reactions occur between a guest that has been previously adsorbed in a binding site and a gas-phase species that lands on it. Finally, in the hot atom mechanism, a gas-phase species lands on a random point of the grain surface and scans it before thermalisation, with the probability to find an adsorbate in a binding site and react with it (Herbst & van Dishoeck 2009).
Being hydrogen the lighter and most abundant element in space, its reaction with species that are already on the icy grain mantles is common, and it is called hydrogenation. Once H atoms accrete on the surface, they quickly diffuse and react (e.g., Accolla et al. 2011). It has been proposed that water ice is produced directly on the grains surface by atomic oxygen hydrogenation via the reaction O→OH→H2O (e.g.,
O2+O→O3
O3+H→O2+OH
OH+H2→H2O+H
(Tielens & Hagen 1982).
Also, another pathway has been proposed and experimentally con-firmed by Miyauchi et al. (2008):
O2+H→O2H
O2H+H→H2O2
H2O2+H→H2O+OH
OH+H→H2O
Also carbon monoxide, that is formed by gas-phase reactions, ac-cretes onto the grain surfaces and reacts with H atoms up to the for-mation of methanol, as suggested in experimental works by Watanabe & Kouchi (2002) and Fuchs et al. (2009):
CO→HCO→H2CO→H2COH→CH3OH
1.2.2
Energetic processing
In both diffuse cold clouds and dense molecular clouds, icy grain mantles are bombarded by UV photons and low-energy cosmic rays, i.e. energetic charged particles, in a phenomenon known as energetic pro-cessing. In dense molecular clouds, UV photons typically have energies less than 13.6 eV and flux in the range 2×10³-3×10⁴ photons cm−2 s−1
they only penetrate the outer icy grain mantle monolayers. Galactic cosmic rays consist of about 98% H+and 2% He2+. At energy around 1
MeV, the flux is in the range 1-10 ions cm−2 s−1 (Strazzulla & Johnson 1991; Mennella et al. 2003; Indriolo & McCall 2012; Islam et al. 2014), and they can penetrate the entire grain. Several processes may be in-duced, such as desorption and sputtering, structural and phase changes, fragmentation (radiolysis) followed by chemical reactions to form new molecules and radicals (e.g., Palumbo et al. 2016; Rothard et al. 2017). These effects are due to the transfer of energy and momentum between the impinging particle and the condensed matter. The collision be-tween the particle and the target atoms can be elastic or inelastic. In elastic collisions, the particle transfers a fraction of its momentum to the target nuclei. This process, also called nuclear stopping, may lead to a cascade of recoiling target atoms and sputtering from the surface. During inelastic collisions, the target electrons can be scattered by the projectile’s Coulomb potential and the atom can be excited or ionised. This process (i.e., electronic stopping) may lead to the ejection of sec-ondary electrons and photons. Electrons from primary ionisation travel through the medium and may suffer elastic or inelastic scattering by target atoms and electrons, respectively. The latter inelastic process may lead to further ionisation and creation of secondary electrons. The ion trajectory in the medium result in a zone of high ionisation density. The overall process require about 10−14 s. More details on the physical process have been given by Rothard et al. (2017).
A pathway to the formation of complex species
Most of the knowledge about the effects of energetic processing on interstellar ices is based on laboratory experiments in which energetic ions or electrons (keV-MeV) or UV photons impact frozen mixtures that are thought to be representative of icy grain mantles or cometary
surfaces, in order to simulate the effects induced by low-energy cos-mic rays, UV-photons and solar/stellar wind. The chemistry induced in the processed material is due to the fact that both ions and UV photons cause the breaking of molecular bonds and the production of radicals and molecular fragments that recombine, forming species that were not present in the deposited sample that increase its chemical complexity. Both volatile and less volatile species are produced. Also, if carbon-bearing species are deposited in the original mixture, a refrac-tory residue is formed (e.g., Strazzulla et al. 1983; Moore et al. 1983; Gerakines et al. 1996; Palumbo et al. 2016). Laboratory experiments have shown that the energetic processing of icy grain mantles has a role not only in the formation of simple species, but also in the formation of so-called Astrophysical or Interstellar Complex Organic Molecules (ACOMs or ICOMs, e.g., Caselli & Ceccarelli 2012), i.e., molecules that contain more than 5 atoms.
Also prebiotic species are synthesised, i.e., molecules that could have been involved in the early processes that led to the origin of life on Earth (e.g., Saladino et al. 2005; Bennett & Kaiser 2007; Fedoseev et al. 2015). To explain the emergence of life, two main theories have been proposed: the endogenous synthesis, supported by the famous Miller-Urey experiment (Miller 1953), according to which organic molecules have been synthesised on Earth from simple inorganic precursors (wa-ter, methane, ammonia and hydrogen) and the exogenous delivery due to comets and meteorites impacts on the primitive Earth during the Late Heavy Bombardment, between 4.1 and 3.8 billion years ago (e.g., Chyba and Sagan 1992). In fact, both objects contain extraterrestrial molecules that may have been synthesised after the energetic processing of pristine pre-solar simple matter.
Generally, laboratory experiments with astrophysical applications require complex experimental set ups that include one (or more)
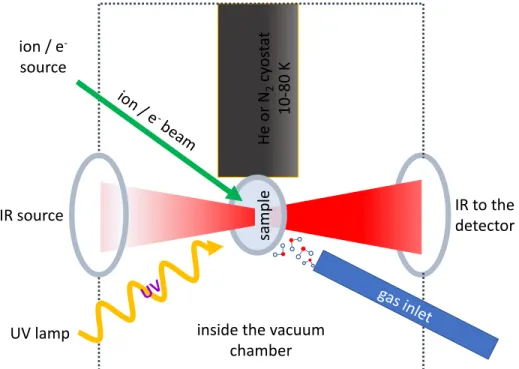
radia-tion sources, such as UV lamps (e.g., Grim et al. 1989; Bernstein et al. 2002; Henderson & Gudipati 2015; Leto & Baratta 2003), electron guns or ion accelerators (e.g., Strazzulla et al. 2001; Hudson et al. 2001; Fam´a et al. 2009; Bennett et al. 2007; Abdulgalil et al. 2013) that are able to cover a wide range of energies up to a few hundreds keV. Recently, also synchrotron radiation has been used to investigate the effect induced by vacuum ultraviolet (VUV) photoabsorption (e.g., Mason et al. 2006; Sivaraman et al. 2014). The irradiation source is connected to high vacuum (P≤10−7 mbar) or ultra high vacuum chamber (P≤10−9 mbar) that is equipped with nitrogen or helium cryostat, devices that allow to go down in temperature to about 80 K and 10 K, respectively. The cryostat is in thermal contact with a substrate where the sample is de-posited. In the most common approach, the deposition is carried out by introducing a pure gas species or a mixture that condenses on the cold substrate, forming a frozen layer on top of it. Usually, by means of a resistor, it is also possible to increase the cryostat temperature in order to investigate the thermal evolution and the desorption of the sample (see Chapter 5). Once the deposition is completed, the radia-tion source is turned on and the sample irradiaradia-tion begins. The effects induced on the sample are investigated by analytical techniques, such as infrared spectroscopy or mass spectrometry of the ejected particles. Other complementary and emerging techniques are also used (e.g., Al-lodi et al. 2013). A schematic drawing of an experimental set up to deposit, irradiate and analyse frozen samples is shown in Fig. 1.5.
Due to the fact that infrared telescopes allow the detection of solid-phase molecules in star-forming regions, infrared spectroscopy is the most diffuse analytical technique to study icy grain mantles analogues synthesised in laboratory. In fact, infrared spectroscopy is a powerful tool that allows in-situ analysis of the samples to obtain information not only on molecular groups and specific molecules, but also on their
inside the vacuum chamber He or N2 cy os ta t 10 -80 K sa mple IR source IR to the detector ion / e -source UV lamp
Figure 1.5: An experimental laboratory set up to deposit, irradiate and analyse frozen samples by means of IR spectroscopy.
physical structure. Thus, together with the chemical composition of the irradiated sample, it is possible to study whether the energetic pro-cessing induces structural changes, such as compaction (e.g., Palumbo 2006; Dartois et al. 2013; Raut et al. 2007a), or phase changes, such as amorphization of crystalline samples (e.g., Baratta et al. 1991; Dartois et al. 2015). Comparing these data with spectra collected by infrared telescopes helps to reveal the physical-chemical structure of icy grain mantles.
1.3
This work
In the last decades, the role of many laboratories for experimental astrophysics has been fundamental to interpret astronomical data and, as an example, to spread light on the molecular synthesis reproduc-ing the conditions under which astrochemistry occurs in space or on planetary surfaces. The results presented in this work have been ob-tained during laboratory experiments that have been performed at the Laboratorio di Astrofisica Sperimentale (LASp) at INAF-Osservatorio Astrofisico di Catania. The laboratory has been active in Catania since the ‘80s, and it is equipped with high vacuum chambers, facilities for the deposition of films at low temperature (down to 10 K), many spectrome-ters in the range from 190 nm up to 200 µm, and Raman spectrographs. Also, Lyman-alpha and ion irradiation experiments are performed, in order to simulate the effect of UV photons and cosmic rays on icy grain mantles and cometary surfaces.
This thesis reports laboratory experiments that have been performed in order to interpret astronomical observation acquired toward star-forming regions where icy grain mantles are found. Also, constrains and suggestions for future observations are given. After the introduc-tion, this work is divided into four parts: Part II - In the solid phase: on the icy grain mantles; Part III - Synthesis and desorption: the role of energetic processing; Part IV - From the solid-phase synthesis to the gas-phase detections. For each chapter, an introduction explains the aims of the work, and the experimental methods and set up are given in details.
have been performed in order to investigate structural and phase changes induced by thermal and energetic processing on the astrophysical rele-vant species carbon monoxide (Chapter 2) and deuterated water (Chap-ter 3).
In part III we report about isocyanic acid and formamide synthesis (Chapter 4), thermal evolution and desorption (Chapter 5) after ion irradiation of icy grain mantles and cometary surface analogues. For-mamide has been detected toward star-forming regions and it is con-sidered a prebiotic molecule. Experiments have shown that formamide could have been a potential source of amino and nucleic acids in the primordial Earth conditions.
Finally, in Part IV we report our contribute in the debate about the growth of simple molecules to explain the formation of more complex species observed in the ISM. The results have been obtained in collab-oration with astronomers from the Observatoire de Grenoble (France). C2O and C3O are two simple species that have been detected in the
gas phase toward several star-forming regions. Laboratory experiments have shown that they are formed after the energetic processing of icy grain mantles analogues (e.g., Palumbo et al. 2008). To better un-derstand the presence of both molecules toward these sources, we per-formed a work in which observational data, laboratory experiments and gas-phase modeling are combined.
Chapter 2: Combined infrared and Raman spectroscopy of solid CO
Based on Urso, R. G., Scir`e, C., Baratta, G. A., Compagnini, G. & Palumbo, M. E. 2016, Astronomy & Astrophysics, 594, A80
Knowledge about the composition and structure of interstellar ices is mainly based on the comparison between astronomical and labora-tory spectra of astrophysical ice analogues. Carbon monoxide is one of the main components of the icy mantles of dust grains in the interstel-lar medium. Because of its relevance, several authors have studied the spectral properties of solid CO both pure and in mixtures. In this chap-ter we report about a study on the profile (shape, width, peak position) of the solid CO band centered at about 2140 cm−1 at low temperature, during warm up, and after ion irradiation to search for a structural variation of the ice sample. We also report on the appearance of the longitudinal optical-transverse optical (LO-TO) splitting in the infrared spectra of CO films to understand if this phenomenon can be related to a phase change. We studied the profile of the 2140 cm−1 band of solid CO by means of infrared and Raman spectroscopy. We used a free web interface that we developed that allows us to calculate the refractive index of the sample to measure the thickness of the film. The profile of the fundamental band of solid CO obtained with infrared and Raman spectroscopy does not show any relevant modification after warm up or ion bombardment in the dose range investigated. We explain that the LO-TO splitting is not connected to a structural variation of the film. Ion irradiation causes the formation of new molecular species. Raman spectroscopy allowed us to detect, among other bands, a band centered at 1817 cm−1 that has been attributed to the infrared inactive species
C2 and a band centered at 1767 cm−1 that remains unidentified.
Chapter 3: On the detection of deuterated water in icy grain mantles: constrains from laboratory experiments
Based on Urso, R. G., Palumbo, M. E. et al. in prep.
The comparison between astronomical spectra and laboratory ex-periments is fundamental to spread light on the structure and compo-sition of ices in interstellar dense molecular clouds and on Solar System bodies. Infrared spectra acquired toward several star-forming regions revealed the presence of water as the most abundant observed con-stituent of icy grain mantles. Several attempts have been made to investigate the presence of solid-phase water isotopologues in space. In particular, the detection of the O-D stretching mode band at 4.1 µm due to the presence of D2O and HDO within icy grain mantles is still under
debate. In fact, available spectra acquired by means of infrared space telescopes are not detailed enough to confirm the presence and abun-dance of both species. According to current models, the HDO/H2O
ratio in icy grain mantles depends on the grain temperature at the time of H2O formation. In this chapter, we report about experiments we
per-formed to study the O-D stretching mode band in solid mixtures that simulate astrophisical relevant ices containing water and deuterated wa-ter in various ratios deposited at 17 K. During the experiments, samples have been either heated or irradiated with energetic ions (200 keV H+)
in order to study the effects induced by both thermal and energetic processing. Our results provide some constrains on the detection of the 4.1 µm band in astronomical environments.
Chapter 4: Synthesis of formamide and isocyanic acid after ion irradiation of frozen gas mixtures
Formamide (NH2CHO) and isocyanic acid (HNCO) have been
ob-served as gaseous species in several astronomical environments such as cometary comae and pre- and protostellar objects. A debate is open on the formation route of those molecules, in particular if they are formed by chemical reactions in the gas phase and/or on grains. In this latter case it is relevant to understand if the formation occurs through surface reactions or is induced by energetic processing. We present arguments that support the formation of formamide in the solid phase by cosmic-ion-induced energetic processing of ices present as mantles of interstellar grains and on comets. Formamide, along with other molecules, are ex-pelled in the gas phase when the physical parameters are appropriate to induce the desorption of ices. We have performed several laboratory experiments in which ice mixtures (H2O:CH4:N2, H2O:CH4:NH3, and
CH3OH:N2) were bombarded with energetic (30-200 keV) ions (H+ or
He+). FTIR spectroscopy was performed before, during, and after ion
bombardment. In particular, the formation of HNCO and NH2CHO
was measured quantitatively. Energetic processing of ice can quantita-tively reproduce the amount of NH2HCO observed in cometary comae
and in many circumstellar regions. HNCO is also formed, but addi-tional formation mechanisms are requested to quantitatively account for the astronomical observations. We suggest that energetic process-ing of ices in the pre- and proto-stellar regions and in comets is the main mechanism to produce formamide, which, once it is released in the gas phase because of desorption of ices, is observed in the gas phase in these astrophysical environments.
Chapter 5: Infrared study on the thermal evolution of solid state formamide
Based on Urso, R. G., Scir`e, C., Baratta, G. A., Brucato, J. R., Compagnini, G., Kaˇnuchov´a, Z., Palumbo, M. E. & Strazzulla, G. 2017, Physical Chemistry Chemical Physics, 19, 21759
Laboratory experiments have shown that the energetic processing, i.e. ion bombardment and UV photolysis, of interstellar grain man-tles and cometary surfaces is efficient in the production of formamide. To explain its presence in the gas phase in these astrophysical envi-ronments, a desorption mechanism has to be taken into account. In this chapter we show experimental results on the thermal evolution of formamide when deposited at 17 K as pure and in mixture with water or carbon monoxide. In these samples, we observed formamide desorption at 220 K. Moreover, we discuss its synthesis in a mixture containing molecular nitrogen, methane and water (N2:CH4:H2O)
de-posited at 17 K and bombarded with 200 keV H+. Heating the sample,
we observed that the newly formed formamide remains trapped in the refractory residue produced after the ion bombardment up to 296 K. To analyse the samples we used Fourier transform-infrared spectroscopy (FT-IR) that allowed us to study the infrared spectra between the de-position and the complete desorption of formamide. Here we discuss the experimental results in view of their astrophysical relevance.
Chapter 6: C2O and C3O in star-forming regions
Based on Urso, R. G., Palumbo, M. E., Ceccarelli, C. et al. in prep.
C2O and C3O, namely dicarbon monoxide and tricarbon
monox-ide, belong to the carbon chain oxides family. Both molecules have been detected in the gas phase toward several star-forming regions. Among them, in TMC-1 C2O and C3O fractional abundances with
respect to H2 have been estimated to be about 6×10⁻¹¹ (Ohishi et
al. 1991) and 1.4×10⁻¹⁰ Brown et al. (1985). To explain these abun-dances, ion-molecule gas-phase reactions have been invoked. On the other hand, laboratory experiments have shown that carbon chain ox-ides are formed after ion bombardment and UV photolysis of CO-rich solid mixtures. Therefore, it has been proposed that they are formed in the solid phase in dense molecular clouds after cosmic ion irradiation of CO-rich icy grain mantles and released in the gas phase after their desorption. Our aim is to contribute to the understanding of the role of both gas-phase reactions and energetic processing in the formation of carbon chain oxides. In this chapter, we present observations obtained with the 30 m IRAM and 32 m IRA-Noto telescopes, the results of a gas-phase model that simulate C2O and C3O formation and destruction
and laboratory experiments in which both molecules are produced after energetic processing of icy grain mantles analogues. The results show that the observed fractional abundances are due to the energetic pro-cessing of CO-rich icy grain mantles and their subsequent desorption because of non thermal processes.
Part II
In the solid phase: on the icy
grain mantles
Chapter 2
Combined infrared and
Raman study of solid CO
Based on Urso, R. G., Scir`e, C., Baratta, G. A., Compagnini, G. & Palumbo, M. E. 2016, Astronomy & Astrophysics, 594, A80
2.1
Searching for CO phase changes
After molecular hydrogen, carbon monoxide is the most abundant molecule in space. The first detection of this molecule in the gas phase of the interstellar medium (ISM) was reported by Wilson et al. (1970). Infrared observations have shown the presence of solid CO in quiescent molecular clouds and in both low-mass and high-mass star-forming re-gions because this molecule, together with water, is one of the main components of the icy mantles of dust grains (e.g., Boogert et al. 2015). Because of the relevance of CO in astrophysics, several laboratories have been involved in the study of this molecule and its spectral properties in astrophysical ices analogues (e.g., Sandford et al. 1988; Tielens et al. 1991; Palumbo & Strazzulla 1993; Quirico & Schmitt 1997; Dartois et al. 2006; Palumbo et al. 2006; Cuppen et al. 2011).
As discussed in detail by Quirico & Schmitt (1997), two main ex-perimental approaches are used: direct deposition on a single window (thin-film technique) and crystal films growth from the liquid phase in a closed cell. The thin-film technique has the advantage that films with good optical quality and well-known thickness can be obtained. On the other hand, only a limited range of temperature can be investi-gated owing to sample sublimation since it is in direct contact with the chamber vacuum; also a limited range of thicknesses can be investigated (less than few micrometers) making it difficult to study weak absorp-tion features. The closed cell technique allows crystals to be grown from the liquid in a closed cryogenic cell under thermodynamical equi-librium. This allows cm-thick samples to grow with good optical and crystal qualities and it is not possible to form phases outside the ther-modynamical equilibrium (e.g., to obtain amorphous solids). Closed cell technique studies have shown that CO has four different phases
(namely α-, β-, γ-, and ϵ− CO), a phase transition occurs at 61.6 K between the α- phase (the coldest one) to the β- phase, and that CO melting point is at 68.14 K (e.g., L¨owen et al. 1990; Quirico & Schmitt 1997). When deposited following the thin-film technique, CO sublimate at about 30 K (e.g., Collings et al. 2004), which is well below the α-β- phase transition temperature.
The profile of the CO stretching mode in pure ice samples shows two features at about 2138 and 2142 cm−1 known as the transverse op-tical (TO) and the longitudinal opop-tical (LO) modes (e.g., Chang et al. 1988; Palumbo et al. 2006). Both these features can be observed when IR spectra are taken in reflection-absorption IR spectroscopy (RAIRS) and oblique transmittance, while only the TO mode is observed in trans-mittance spectra taken at normal incidence. As discussed by Palumbo et al. (2006) the presence of the LO-TO splitting is not attributable to the presence of crystalline CO.
Recently, an interesting phenomenon has been investigated, which is the appearance of a spontaneous electric field due to dipole orienta-tion within thin films of dipolar molecules. Materials that exhibit this behavior are called spontelectric (from spontaneously electrical). Using RAIRS, Lasne et al. (2015) studied the Stark shift created by the spon-telectric field in vibrational frequencies of solid CO. They measured the LO-TO splitting to determine the values of the spontelectric field as a function of film deposition temperature.
In recent decades, several experimental investigations have focused on astrophysical relevant molecules, such as H2O, CO2, CH3OH, CH3CN,
and CH3OCHO. Many of these experiments were meant to study the
profile (i.e., shape, width, and peak position) of IR bands at different temperatures in pure ices and in mixtures. Laboratory spectra show that during warm up the profile of IR bands change. These changes can be attributed to a transition between a disordered phase to a much
or-dered one, i.e., an amorphous to crystalline transition. Some examples are reported by Hudgins et al. (1993), Palumbo et al. (1999), Moore et al. (2010), Abdulgalil et al. (2013), and Modica & Palumbo (2010). Bossa et al. (2012) reported about the thermal processing of porous amorphous solid water. They observed that between 20 and 120 K the ice undergoes a thickness decrease that they attribute to a phase transition to a nonporous and more compact structure of the ice.
Other studies have focused on the effects of energetic processing (i.e., ion bombardment and UV photolysis) on the structure and mor-phology of ices. As an example, on the basis of laboratory experiments, it has been shown that polycrystalline water ice is converted to amor-phous ice after energetic processing (e.g., Baratta et al. 1991; Moore & Hudson 1992; Leto & Baratta 2003; Dartois et al. 2015). Furthermore, energetic processing also causes the conversion of porous amorphous water to compact amorphous water (e.g., Palumbo 2006; Raut et al. 2007a; Palumbo et al. 2010; Dartois et al. 2013) at 10-20 K.
Also some attempts have been made to look for a phase change of solid CO, both pure and in solid matrices, by studying its infrared spec-trum (Maki 1961; Nealander 1985; Sandford et al. 1988; Loewenschuss et al. 1997). Katz et al. (1984) reported about a Raman scattering experiment of solid CO placed in a diamond cell and subjected to vari-ation in temperature and pressure. Looking at the feature of the CO stretching mode, they identified four structures named α-, β-, γ-, and ϵ- CO, each showing a different profile of the stretching-mode feature.
Fuchs et al. (2006) reported on the change in the heights, widths, and position of the13CO stretching vibrational band by means of RAIRS
spectroscopy during a temperature programmed desorption (TPD) ex-periment. At low temperatures (18.5 K) these authors observed a single peak at 2096 cm−1 due to amorphous13CO. Raising the temperature to 27.5 K, a peak centered at 2095.1 cm−1appears and they attributed it to
the α-crystalline LO component. They concluded that these variations are due to a phase change from amorphous to crystalline ice at close to the desorption temperature. Studying the effect of photodesorption in CO ices, ¨Oberg et al. (2009) reported that the CO photodesorption yield decreases, thereby raising the ice temperature from 15 K to 27 K. They carried out a RAIRS experiment that shows a change in the CO band profile between 15 K and 27 K. They concluded that because the annealing determines the formation of a more compact ice, its structure, rather than the temperature, affects the photodesorption yield.
Recently, Mun˜oz Caro et al. (2016) reported on some experiments they carried out to evaluate if there is a connection between the struc-ture and photodesorption rate of solid CO by means of IR spectroscopy, vacuum-UV (VUV) spectroscopy, and TPD. They observed that the photodesorption yield linearly decreases with the deposition tempera-ture of CO from 7 to 20 K, but they do not attribute this decrease to a variation in its morphology toward a crystalline solid.
To extend previous work, in this article we present new labora-tory experiments on solid CO. Both infrared and Raman spectroscopy are used to analyze the samples. These are two powerful and comple-mentary tools to study the physical and chemical properties of frozen samples. By means of infrared spectroscopy it is possible to identify molecular groups and specific molecules. Raman spectroscopy gives further information on the structural properties of the samples and it is often used to study the effects of ion induced lattice damage in car-bonaceous solids (e.g., Elman et al. 1981; Strazzulla & Baratta 1992; Baratta et al. 1996; Kalish et al. 1999; Strazzulla et al. 2001; Costantini et al. 2002). The main purpose of this work is to verify whether it is possible to observe a structural variation in solid CO during warm up and after ion bombardment. The article is organized as follows: the experimental methods are described in §2.2, the results are presented
2.2
Experimental methods
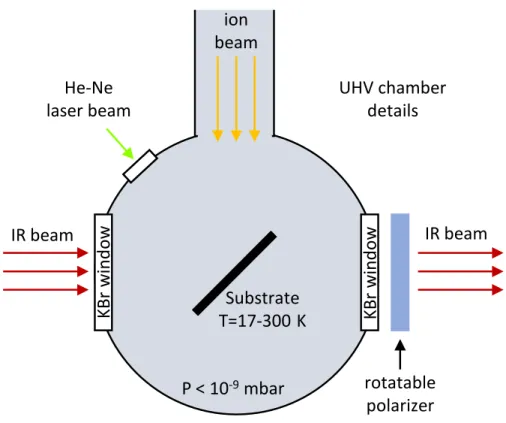
Experiments were performed in the Laboratory for Experimental Astrophysics (LASp) at INAF-Osservatorio Astrofisico di Catania (Italy). The solid CO samples were prepared in a stainless steel high vacuum chamber (pressure <10−7mbar) in which a crystalline silicon substrate is placed in thermal contact with a cold finger whose temperature can vary between 17 K and 300 K.
The samples were analyzed using infrared and Raman spectroscopies. Infrared transmission spectra were taken at oblique incidence (45◦) by a Fourier transform infrared (FTIR) spectrometer (Bruker Equinox 55 or Vertex 70). Transmission spectra are obtained through the KBr win-dows in the chamber and a hole made in the cold finger, which allows the infrared beam to be transmitted through the substrate and the sample. The alignment of the IR beam of the spectrometer through the hole of the cold finger and KBr windows of the chamber is obtained using a moveable optical bench, on which an IR spectrometer is placed that permits fine vertical and horizontal adjustments. A rotatable po-larizer placed along the path of the IR beam allows us to take spectra both with the electric vector parallel (p-polarized) and perpendicular (s-polarized) to the plane of incidence. Infrared spectra are taken with a resolution of 1 cm−1.
In situ Raman spectra were acquired using two different setups with visible and near-infrared laser excitation, respectively (Fig.2.1). In the first setup, a Triplemate spectrometer by SPEX equipped with a Peltier cooled CCD detector is used. A continuous Ar-ion laser beam (λ=514.5 nm) enters a confocal illuminator by DILOR, perpendicularly to its optical axis, into which it is deflected by a microprism. The
con-focal optical system is arranged in such a way that any parallel beam incident along the optical axis in the opposite direction of the laser is focused onto the entrance slit of the spectrometer. By means of two flat mirrors, the laser beam is reflected toward the vacuum chamber and focused by an objective lens into a 40 µm spot on the sample. The back-scattered Raman light is collimated by the same objective into a parallel beam that, according to the setup geometry, goes back along the same path of the laser beam and reaches the confocal illuminator where it is focused onto the entrance slit of the spectrometer. Since the incoming laser and the Raman collected light are collimated into paral-lel beams, this configuration allows us to acquire Raman spectra up to several meters away from the spectrometer with negligible performance loss. The spectral resolution is about 5 cm−1.
The second setup, with near-infrared laser excitation, uses an optical fiber-based compact monocromator HE785 by HORIBA. The spectrom-eter has a fixed objective grating and is equipped with a Peltier cooled CCD detector. The probe head has a confocal optical configuration and is oriented directly toward the objective lens of the chamber. The optical path of the incoming laser beam that emerges from the head, and the collected Raman beam is analogous to that already described for the visible setup. A solid state continuous wave (CW) 785 nm laser diode is used as exciting source. The near-infrared excitation permits a significant decrease in the strong fluorescence continuum usually ob-served in carbon containing molecular samples irradiated at low doses, when using visible laser excitation (e.g., Ferini et al. 2004). Although the Raman features are relatively (785 nm/514.5 nm)4=5.4 times less
intense with respect to the 514.5 nm excitation, this setup is partic-ularly useful when searching for weak features of species formed by ion bombardment. A strong fluorescence continuum can indeed totally mask weak features. The spectral resolution is 10 cm−1.
In the experiments we present here, a needle valve is used to admit gaseous CO (Aldrich, 99.0%) into the vacuum chamber where it freezes on the substrate. The gas inlet is not directed toward the substrate, thus a “background deposition” is obtained. This method ensures a uniform thickness of the film, but has the disadvantage that the gas phase molecules can freeze out onto all of the cold surfaces inside the chamber. To avoid any deposition on the backside of the substrate, this is protected by a 2 cm long copper tube aligned with the IR beam with a central hole of 4.5 mm.
The vacuum chamber is connected to a 200 kV ion implanter by Danfysik. The irradiation experiments were carried out using 200 keV H+. The ion beam is electrostatically swept to ensure a uniform
cov-erage on the target and produces a 2×2 cm2 spot on it. To avoid a
macroscopic heating of the irradiated sample, we used an ion current density between 100 nA cm−2and a few µA cm−2. The ion fluence (ions cm−2) was measured by integrating the ion current monitored during irradiation.
The energy deposited by incoming ions to the sample (dose) was ob-tained by multiplying the fluence and stopping power (i.e., the amount of energy deposited per unit path length; eV cm2/molecule) given by SRIM code (Ziegler et al. 2008). In this work the dose is given in eV/16u, which is a convenient way to characterize chemical changes and to enable a comparison with other experiments with different sam-ples (Strazzulla et al. 1991).
2.2.1
Thickness measurement
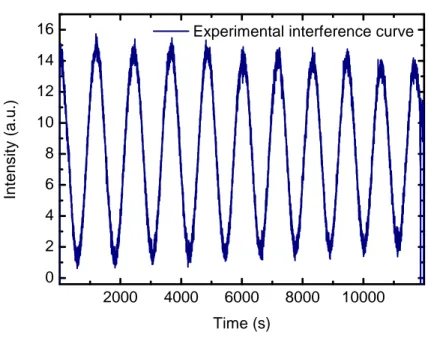
We followed the procedure described in Fulvio et al. (2009) and Modica & Palumbo (2010) to measure the thickness of the CO solid film. In the experiments we present here, a He-Ne laser beam (λ= 543.5 nm) is directed toward the sample and reflected at 45◦ both by the vacuum-ice and vacuum-ice-substrate interfaces. The reflected laser beam is detected by an external silicon-diode detector. There is a difference in the optical path between the reflected components of the laser beam that varies with the thickness of the film, so that interference is produced. Hence it is possible to follow the accretion of the frozen film by looking at the interference curve (intensity versus time) of the reflected laser beam (see Fig. 2.2 A).
0000000000000000000 0000000000000000000 0000000000000000000 0000000000000000000 0000000000000000000 0000000000000000000 0000000000000000000 0000000000000000000 0000000000000000000 0000000000000000000 0000000000000000000 0000000000000000000 0000000000000000000 0000000000000000000 0000000000000000000 0000000000000000000 0000000000000000000 0000000000000000000 0000000000000000000 0000000000000000000 0000000000000000000 0000000000000000000 0000000000000000000 0000000000000000000 0000000000000000000 0000000000000000000 0000000000000000000 0000000000000000000 0000000000000000000 0000000000000000000 0000000000000000000 0000000000000000000 0000000000000000000 0000000000000000000 0000000000000000000 0000000000000000000 0000000000000000000 00000000000000000001111111111111111111111111111111111111111111111111111111111111111111111111111111111111111111111111111111111111111111111111111111111111111111111111111111111111111111111111111111111111111111111111111111111111111111111111111111111111111111111111111111111111111111111111111111111111111111111111111111111111111111111111111111111111111111111111111111111111111111111111111111111111111111111111111111111111111111111111111111111111111111111111111111111111111111111111111111111111111111111111111111111111111111111111111111111111111111111111111111111111111111111111111111111111111111111111111111111111111111111111111111111111111111111111111111111111111111111111111111111111111111111111111111111111111111111111111111 111111111111111111100000000001111111111111111111100000000000000000000111111111111111111110000000000000000000011111111111111111111000000000011111111110000000000111111111100000000000000000000111111111100000000001111111111111111111100000000000000000000111111111100000000001111111111111111111100000000000000000000111111111111111111110000000000111111111100000000000000000000111111111100000000001111111111
Stainless steel high
vacuum chamber detail
substrate (17–300 K)
Magnet
(ion selector)
Triple SPEC monochromator
and CCD–detector 0000 0000 0000 0000 00001111111111111111 1111
Collected Raman beam
KBr
windows
KBr window
Ion beam / He–Ne laser
2.5 m
Multiline Ar ion laser
Ion beam / He–Ne laser
Ion source
and accelerator
Ion Implanter (200 kV)
He–Ne laser
Confocal illuminator
Ingoing laser beam
F ig u re 2 .1: S ch em a ti c v iew o f th e R a m an set u p . Th e Ar lase r b ea m is fo cu sed o n th e sam p le m ou n ted in si d e th e HV ch am b er , wh ic h is co n n ect ed to th e Ion im p la n ter .
The spikes in the interference curve indicate the time when the infrared spectra are taken. The damping seen in the interference curve is due to scattering loss, either by the bulk or surface of the film, and a loss of coherence of the reflected light at the two, vacuum-film and film-substrate, interfaces. It should be considered that the damping is not usually due to absorption since most of the molecular ices are transparent at visible wavelengths. In general, the reflectance of a thin film deposited over a substrate can be schematically represented by Eq.2.1
R = F (nf, ns, d, θi, λ), (2.1)
where nf and ns are the complex refractive indexes of the film and
substrate respectively, d is the film thickness, θi is the incidence angle
and λ is the wavelength. If the incidence angle is not equal to 0, this function also depends on the polarization of the incident electromag-netic field. At fixed wavelength, the reflectance R versus the thickness is, for nonabsorbing materials, a periodic function whose period (dis-tance between two maxima or minima) is given by Eq.2.2
∆d = λ0 2nf √ 1 − sin2θ i/nf2 , (2.2)
where λ0 is the laser wavelength. From Eq.2.2, it is evident that
the refractive index of the sample must be known in order to measure the thickness. Nevertheless, the amplitude of the interference curve itself depends on the refractive index, so by measuring this quantity (intensity ratio between maxima and minima) it is possible to derive the refractive index of the sample and then the thickness. In particular in Eq.2.1, λ0, θi, and ns are known quantities, hence for a given refractive
index of the film (nf), an interference curve (R versus the thickness d)
is automatically varied, using a FORTRAN code, until the theoretical amplitude of the interference curve becomes equal to the experimental amplitude. We found nf = 1.30 for frozen CO. As an example, looking
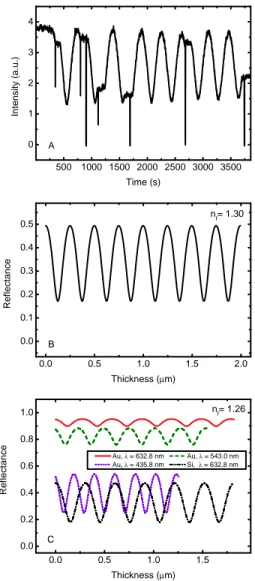
at Fig. 2.2 it is possible to compare the experimental interference curve obtained during the deposition of CO on a silicon cold substrate (A) with the computed theoretical curve (B).
A free web interface to the FORTRAN code used in this work is available at http://www.oact.inaf.it/spess/. This interface calculates the refractive index of the ice sample and gives the theoretical interfer-ence curve from the amplitude of the experimental interferinterfer-ence curve. The sample thickness can be obtained by comparing the theoretical interference curve with the experimental one. Since the experimental reflectance is usually given in arbitrary units and exhibit a damping due to scattering losses, a direct comparison between the theoretical and experimental curves is not possible. In this work both the experi-mental and theoretical curves are normalized by placing all the minima at 0 and the maxima at 1 before the comparison. The normalization procedure is straightforward for the theoretical curve since the minima and maxima have the same intensity. In the case of the experimental curve two spline continuum, passing through the minima and maxima, respectively, can be used for normalization. For each chosen point, we read the intensity in the normalized experimental interference curve. Then we identified the point at which the normalized intensity corre-sponds at the given fringe number in the normalized theoretical curve; the abscissa of the point is the value of the thickness.
This method ensures a measure of the film thickness with an ab-solute accuracy of about 5%. The main limits are the uncertainties in knowledge of the refractive index of the substrate at low tempera-ture and the error in measuring the incidence angle of the laser. In the present version of the web interface, only some of the more
com-5 0 0 1 0 0 0 1 5 0 0 2 0 0 0 2 5 0 0 3 0 0 0 3 5 0 0 0 1 2 3 4 0 . 0 0 . 5 1 . 0 1 . 5 2 . 0 0 . 0 0 . 1 0 . 2 0 . 3 0 . 4 0 . 5 0 . 0 0 . 5 1 . 0 1 . 5 0 . 0 0 . 2 0 . 4 0 . 6 0 . 8 1 . 0 In te n s it y ( a .u .) T i m e ( s ) C B R e fl e c ta n c e T h i c k n e s s (µm ) nf= 1 . 3 0 A R e fl e c ta n c e T h i c k n e s s (µm ) A u , λ = 6 3 2 . 8 n m A u , λ = 5 4 3 . 0 n m A u , λ = 4 3 5 . 8 n m S i , λ = 6 3 2 . 8 n m nf= 1 . 2 6
Figure 2.2: Panel A): experimental interference curve obtained during the deposition of gaseous CO on a Si cold substrate using an He-Ne laser. Panel B): theoretical interference curve for solid CO film on a Si cold substrate. The comparison between the theoretical and exper-imental curves allows us to measure the sample thickness using the interference fringe method. Panel C): theoretical interference curves calculated assuming an ice with refractive index equal to 1.26 that is deposited on cold Au substrate for different laser wavelengths. For com-parison, the interference curve computed for the same ice deposited on silicon is shown.
mon opaque substrates (silicon, aluminum, gold) are considered. We would like to note that a smaller amplitude of the interference curve increases the uncertainty in the derived refractive index and thickness of the film owing to the experimental noise of the interference curve. In particular in the case of a gold substrate, the use of a laser at vi-olet or UV wavelength is suggested. In fact, as shown in Fig. 2.2 C, the amplitude of the interference curve is small when laser wavelengths greater than about 500 nm are used. The theoretical optical model for the reflectance does not take into account the reflection at the second substrate interface (the one in contact with the cold finger). Indeed it is not straightforward to consider, in a reliable way, the contribu-tion of the electromagnetic radiacontribu-tion that is transmitted through the substrate and reflected at the second substrate interface. Also, it is not straightforward to take into account the reflected component by mirror-like polished cold finger surface. Hence the procedure can only be used reliably in the case of substrates that are opaque at the laser wavelength.
2.3
Results
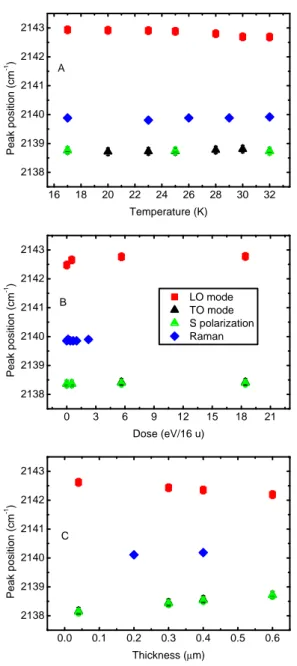
We carried out several experiments to study the profile of the 2140 cm−1 fundamental band of solid CO by infrared transmission spec-troscopy and Raman specspec-troscopy as a function of temperature, irradi-ation dose and thickness of the CO sample. Throughout the chapter IR spectra are plotted in a decreasing wavenumber scale (i.e., increasing wavelength) as this is the common style in the astronomical literature, while Raman spectra are plotted in increasing wavenumber scale. We present our results in the following sections. In Fig. 2.3 we show the peak position of the CO band at different temperatures (A), irradiation doses (B ), and film thicknesses (C ). To obtain these values, we fitted each CO band with a polynomial curve and then we reported the po-sition of the maximum of each fit. As said in § 2, the Raman spectral resolution is 5 cm−1, so it is not possible to resolve the LO and TO mode of solid CO.
2.3.1
Temperature experiments
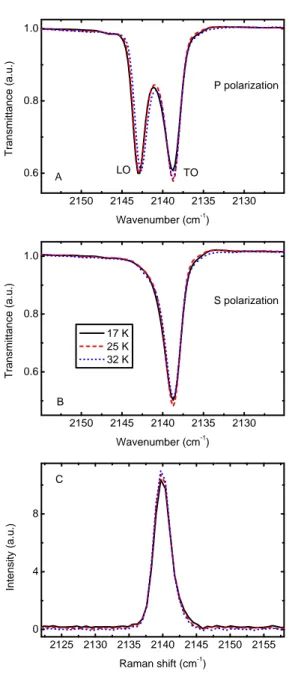
In this paragraph we show the data collected for a 0.1 µm-thick CO sample increasing its temperature from 17 K to 32 K, the highest temperature at which spectra can be acquired in our experimental con-dition before which CO starts to sublimate. In Fig. 2.4 A we report the IR spectra in P polarization showing the LO-TO splitting, while in Fig. 2.4 B we show the spectra of the same sample in S polarization. No significant variation of the band profile occurred during the warm up. As is discussed in §3.3, the relative intensities of TO and LO bands depend on the thickness of the sample. It is possible to notice just a
1 6 1 8 2 0 2 2 2 4 2 6 2 8 3 0 3 2 2 1 3 8 2 1 3 9 2 1 4 0 2 1 4 1 2 1 4 2 2 1 4 3 0 3 6 9 1 2 1 5 1 8 2 1 2 1 3 8 2 1 3 9 2 1 4 0 2 1 4 1 2 1 4 2 2 1 4 3 0 . 0 0 . 1 0 . 2 0 . 3 0 . 4 0 . 5 0 . 6 2 1 3 8 2 1 3 9 2 1 4 0 2 1 4 1 2 1 4 2 2 1 4 3 A P e a k p o s it io n ( c m -1 ) T e m p e r a t u r e ( K ) B L O m o d e T O m o d e S p o l a r i z a t i o n R a m a n P e a k p o s it io n ( c m -1 ) D o s e ( e V / 1 6 u ) C P e a k p o s it io n ( c m -1 ) T h i c k n e s s (µm )
Figure 2.3: Experimental CO peak positions measured in IR and Ra-man spectra varying the sample temperature (panel A), irradiation dose (panel B), and film thickness (panel C). Red squares: LO band in P po-larization; black triangles: TO band in P popo-larization; green triangles: CO band in S polarization; and blue rhombus: Raman stretching mode band.
2 1 5 0 2 1 4 5 2 1 4 0 2 1 3 5 2 1 3 0 0 . 6 0 . 8 1 . 0 2 1 5 0 2 1 4 5 2 1 4 0 2 1 3 5 2 1 3 0 0 . 6 0 . 8 1 . 0 2 1 2 5 2 1 3 0 2 1 3 5 2 1 4 0 2 1 4 5 2 1 5 0 2 1 5 5 0 4 8 T ra n s m it ta n c e ( a .u .) W a v e n u m b e r ( c m - 1) A L O T O S p o l a r i z a t i o n P p o l a r i z a t i o n T ra n s m it ta n c e ( a .u .) W a v e n u m b e r ( c m - 1 ) 1 7 K 2 5 K 3 2 K B C In te n s it y ( a .u .) R a m a n s h i f t ( c m - 1)
Figure 2.4: Experiments performed increasing the sample temperature. Panels A), B): infrared spectra of the fundamental vibrational band of solid CO and panel C): Raman spectra of the stretching mode feature. Black solid line: solid CO film at 17 K; red dashed line: 25 K; and blue dotted line: 32 K.
small variation in the intensity of the band. The same experiment has been repeated in the case of Raman analysis and the results are re-ported in Fig. 2.4 C. It is well known that this technique is particularly sensitive to structural variations, but except for a small increase of the peak intensity, as seen for IR spectra, the band profile does not show any significant change.
In Fig. 2.3 A it is clearly visible that from 17 K to 32 K is not possible to observe any variation of the band peak position either in the IR or in the Raman spectra. The measured values, in fact, differ by less than the uncertainties (0.25 cm−1 in the IR spectra and 1 cm−1 in the Raman spectra). The peak position of the band in the IR spectra, remains nearly constant at about 2138.7 cm−1 for the TO band and 2142.8 cm−1 for the LO band. The Raman peak position also remains almost constant at 2140.0 cm−1.
2.3.2
Irradiation experiments
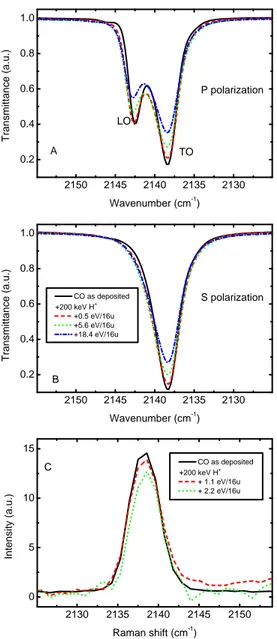
In Fig. 2.5 we show the Raman spectra and IR spectra acquired in P polarization and S polarization of a 0.2 µm-thick solid CO film before and after irradiation with 200 keV H+. In Figs. 2.5 A and B
it is possible to see that the band intensity decreases at increasing ir-radiation doses. The energetic ions (keV-MeV) used to irradiate the sample release their energy to the target along the ion track. As a consequence molecular bonds are broken, and radicals and molecular fragments recombine to form new molecular species not present in the original sample. The irradiation of solid CO causes the synthesis of car-bon dioxide and others carcar-bon and oxygen containing molecules, such as carbon chain oxides. This phenomenon is well known and extensive studies have been reported by Trottier & Brooks (2004), Loeffler et al. (2005), Palumbo et al. (2008), and Seperuelo Duarte et al. (2010). In Fig. 2.5 C we report a portion of the Raman spectra showing the solid
2 1 5 0 2 1 4 5 2 1 4 0 2 1 3 5 2 1 3 0 0 . 2 0 . 4 0 . 6 0 . 8 1 . 0 2 1 5 0 2 1 4 5 2 1 4 0 2 1 3 5 2 1 3 0 0 . 2 0 . 4 0 . 6 0 . 8 1 . 0 2 1 3 0 2 1 3 5 2 1 4 0 2 1 4 5 2 1 5 0 0 5 1 0 1 5 P p o l a r i z a t i o n A C O a s d e p o s i t e d + 2 0 0 k e V H+ + 0 . 5 e V / 1 6 u + 5 . 6 e V / 1 6 u + 1 8 . 4 e V / 1 6 u T ra n s m it ta n c e ( a .u .) W a v e n u m b e r ( c m - 1 ) L O T O S p o l a r i z a t i o n B T ra n s m it ta n c e ( a .u .) W a v e n u m b e r ( c m - 1 ) C + 2 0 0 k e V H C O a s d e p o s i t e d+ + 1 . 1 e V / 1 6 u + 2 . 2 e V / 1 6 u In te n s it y ( a .u .) R a m a n s h i f t ( c m - 1)
Figure 2.5: Energetic processing of solid CO film with 200 keV H+.
Panel A): IR spectra in P polarization. Panel B): IR spectra in S po-larization. CO film as deposited (black solid line); CO film after irra-diation dose of 0.5 eV/16u (red dashed line), 5.6 eV/16u (green dotted line), and 18.4 eV/16u (blue dash-dotted line). Panel C): Raman spec-tra. CO film as deposited (black solid line); CO film after irradiation dose of 1.1 eV/16u (red dashed line), 2.2 eV/16u (green dotted line).