Recovery of molecules with healthy
properties from orange press liquor by
membrane fractionation
PhD Dissertation by
René Ruby-Figueroa
Supervisors
Prof. Bartolo Gabriele
Department of Pharmaceutical Sciences Faculty of Pharmacy, Nutritional and Health Sciences
University of Calabria
Dr. Alfredo Cassano
National Research CouncilInstitute on Membrane Technology (ITM-CNR)
v
vii
SUMMARY
Fruits and vegetables are widely recognized as an important source of beneficial compounds for the human nutrition. Citrus and juices are widely consumed in the world. Their health benefits have been recognized for a long time now since first cultivated in Asia. The market of oranges is growing constantly, because consumers have become more convenience-oriented and health conscious. Consequently, efforts by researchers and industrial organizations have been made to develop processes more efficient, putting emphasis in food quality and safety. In addition, with the increasing emphasis on water pollution control, industries are establishing programs that will permit disposal of their wastewater without damaging the environment. The citrus fruit industry is no exception. Citrus wastes, such as wet peels and whole rejected fruit, which a great amount of organic matter that can be associated with environmental and health problems due to water runoff and uncontrolled fermentation. Therefore, the development of optimized systems for the treatment of citrus wastes is a crucial factor in the rationalization of the traditional industrial cycle.
Membrane operations in the last years have shown their potentialities in the rationalization of production systems. Their intrinsic characteristics of efficiency, operational simplicity and flexibility, relatively high selectivity and permeability for the transport of specific components, low energy requirements, good stability under a wide spectrum of operating conditions, environment compatibility, easy control and scale-up have been confirmed in a large variety of applications and operations in the food industry.
Recent R&D efforts aim to convert the potential of wastes into profitable products creating new segments of production and offsetting the disposal costs. Orange peels and pulp contain several bioactive compounds, such as flavonoids and phenolic acids, recognized for their beneficial implications in human health due to their antioxidant activity and free radical scavenging ability. These semi-solid wastes can be pressed to obtain a liquid rich in soluble sugars, named press liquor, that can be concentrated up to citrus molasses grade or alternatively exploited as a natural source for the extraction of
viii
phenolic compounds which can be used as natural antioxidants mainly in pharmaceutical, cosmetic and foods industry.
This PhD dissertation is based on the opportunity to develop a technical alternative to solve some problems related to the disposal of citrus wastes from an economic and environmental point of view, specifically in terms of recovery of attractive compounds present in orange press liquor. The general aim of the work was devoted to the recovery of phenolic compounds by using an integrated membrane process, in which microfiltration (MF) or ultrafiltration (UF), nanofiltration (NF) and osmotic distillation (OD) processes were involved.
MF or UF processes were used for the clarification of the press liquor in order to separate macromolecules, such as pectins, and to obtain a clarified press liquor as permeate stream. In the second step the clarified press liquor obtained from the MF/UF process was treated by NF in order to obtain a retentate stream enriched in phenolic compounds with a low content of sugars. Finally, OD was used as final step to concentrate the NF retentate stream.
In the first Chapter, a general overview of membrane operations, including methodologies to evaluate their performance, is reported. The industrial transformation of citrus fruits and the associated production of citrus wastes is reported in Chapter 2. In this Chapter the chemico-physical characterization of citrus press liquor used for the experimental activities performed on membrane laboratory plants is also included. Chapter 3 is focused on the experimental activities concerning the clarification of citrus press liquor by using MF or UF processes. In Chapter 4 the fractionation of clarified press liquor by using NF membranes is analysed and discussed. Experimental activities related to the concentration of the NF retentate by using OD are described in Chapter 5
ix
ACKNOWLEDGEMENT
I would like to express my deepest appreciation to my direct supervisor Dr. Alfredo Cassano for the useful comments, remarks and engagement through the learning process of this doctoral thesis. Furthermore, I would also like to thank my supervisor Prof. Bartolo Gabriele for the support on the way to obtaining my goals. Without their guidance and persistent help this dissertation would not have been possible.
I would also like to thank the Ministero dell`Istruzione, dell`Università e della Ricerca (MIUR) for their financial support granted through my doctoral fellowship. I would also like to thank the Institute on Membrane Technology (ITM-CNR) who gave me the space to develop my research.
A special thanks to Dr. Alessia Fazio, Dr. Monica Nardi and Dr. Pierluigi Plastina who helped me in some of the analytical measurements. I appreciated the camaraderie of the members of the ITM-CNR group; Carmela Conidi, Fitim Destani, Sabrina Prete, and Serena Russo and many more, who contributed immensely to my personal and professional growth during my time at University of Calabria.
I would like to thank my family, Monica Figueroa, Natalia Ruby, René Ruby, Ana Alvear, and Nicolas for their endless love and support, despite the long distance. I would also like to thank my partner, Maria Muro, for her love, kindness, and support she has shown during my PhD studies.
Lastly, my time at UNICAL was made enjoyable in large part due to the many friends that became a big part of my life. I would like to thank the friendship and support given to me by Luciano Marquez, Alejandra Noriega and Ana Lucia Acevedo.
René Ruby-Figueroa
University of Calabria
xi
Summary…………...……… vii
Acknowledgement……….. ix
Chapter 1 Fundamentals of membrane separation processes………... 1
1.1 Membranes and Membrane Processes………... 1
1.2 Membrane materials……… 2
1.3 Membrane structure……… 4
1.4 Process design and operation……….. 7
1.4.1 Membrane modules……… 7
1.4.2 Filtration methods……….. 10
1.4.3 Process configuration………. 12
1.5 Membrane performance……….. 13
1.5.1 Membrane rejection and volume reduction factor………. 14
1.5.2 Transport mechanisms………... 14
1.5.3 Concentration Polarization and membrane fouling………... 17
References………... 23
Chapter 2 Citrus fruit processing and orange press liquor characterization… 27 2.1 Citrus fruits: properties and global market ………..……... 27
2.2 Citrus processing…………..……… 29
2.3 Press liquor characterization……….. 33
2.3.1 Analysis of phenolic compounds………... 33
2.3.2 Analysis of Sugars……..………... 34
2.3.3 Determination of total phenols content……….………. 34
2.3.4 Determination of the total antioxidant activity (TAA)………….………. 35
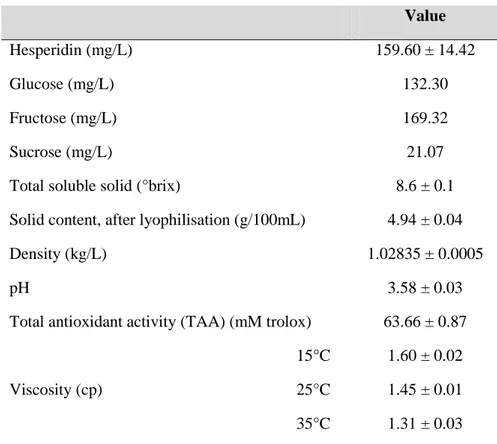
2.3.5 Analytical results……… 35
References……….……….. 38
Chapter 3 Orange press liquor clarification.………. 43
3.1 Clarification of orange press liquor: Evaluation of membrane characteristics... 44 3.2 Clarification of orange press liquor: Evaluation of operating conditions….. 49
3.2.1 Optimization of multiple responses………... 70
3.3 Clarification of orange press liquor: UF with tubular PS membrane……… 71
xii
4.2 Nanofiltration with flat-sheet membranes………. 78
4.3 Nanofiltration with a spiral-wound membrane module………... 86
References………... 90
Chapter 5 Concentration of NF retentate by osmotic distillation………... 93
5.1 Introduction……….. 93
5.2 Experimental results……… 97
References………... 101
Conclusions………... 103
xiii
1.1 Materials used for the manufacture of membranes……… 3
1.2 Characteristics of different membrane modules……… 10
2.1 Physico-chemical characteristics of raw orange press liquor……… 36
3.1 Agents used in the conventional fruit juice clarification………... 44
3.2 Characteristics of selected membranes……….. 46
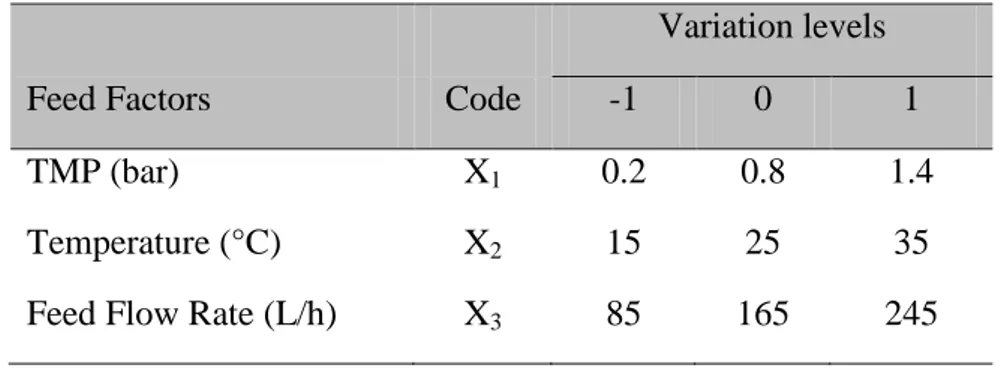
3.3 Experimental range and levels of the independent variables for Box-Behnken design………. 51
3.4 Experimental design and results of Box-Behnken design……….. 52
3.5 Plot of residuals against predicted response of TAA in the permeate stream…… 71
3.6 Results obtained during UF of orange press liquor by using tubular PS membrane………... 74
4.1 Characteristics of flat-sheet NF membranes……….. 80
4.2 Analytical determination of hesperidin and sugars in samples coming from the treatment of clarified orange press liquor with flat-sheet membranes…………... 84
4.3 Properties of 2.5 x 40 in. spiral-wound NF-PES-10 membrane……… 86
4.4 Results of hesperidin and sugars rejection obtained with the NF-PES-10 membrane. Operating conditions: TMP=17 bar, T=20.73±1.40°C………... 89
xiv
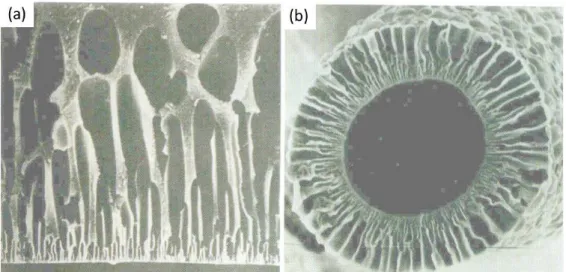
1.1 Cross section of: (a) cellulose acetate asymmetric flat sheet membrane; (b)
polyamide hollow fibre asymmetric membrane……… 5
1.2 Filtration capability of pressure-driven membrane operations………...……….. 6
1.3 Schematic representation of (a) plate and frame, (b) spiral-wound, (c) tubular, (d) hollow fiber membrane module………...……… 8
1.4 Schematic representation of (a) dead-end and (b) cross-flow filtration…...……. 11
1.5 Schematic diagram of (a) total recycle, (b) batch concentration, (c) feed-and-bleed and (d) diafiltration configuration……...……… 12
1.6 Schematic representation of concentration polarization (cw = gel concentration; cb = bulk concentration)……… 18
1.7 Schematic representation of (a) complete blocking, (b) intermediate blocking, (c) cake filtration and (d) standard blocking in pressure-driven membrane processes……… 19
2.1 Flowchart of industrial orange juice processing………... 30
2.2 HPLC chromatogram of orange press liquor. black line at 280 nm (for hydroxybenzoic acids and flavones) and pink line at 360 nm (for hydroxycinnamic acids)……… 36 3.1 Schematic diagram of the experimental set-up: (1) feed tank; (2) feed pump; (3,5) pressure gauges; (4) flat-sheet cell; (6) digital balance; (7) retentate valve; (8) permeate tank; (9) thermometer……….. 45 3.2 Rejection of (a) sugar and (b) hesperidin obtained during MF-UF under TRC and BC configuration using flat-sheet membranes. Operating conditions: TMP= 1 bar, T= 25°C, feed flow rate= 185 L/h………... 47 3.3 Time course of permeate flux for MF and UF processes using flat-sheet membranes at TRC (a) and BCC (b). Operating conditions: TMP= 1 bar, T= 25°C, feed flow rate= 185 L/h………... 48 3.4 Scheme of UF experimental setup……… 50
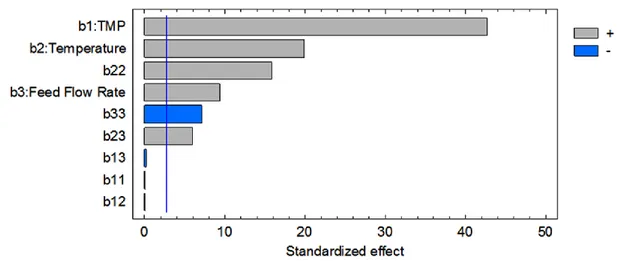
3.5 Standardized pareto chart for the permeate flux………... 53
3.6 3D response surface with contour plot of permeate flux……….. 55
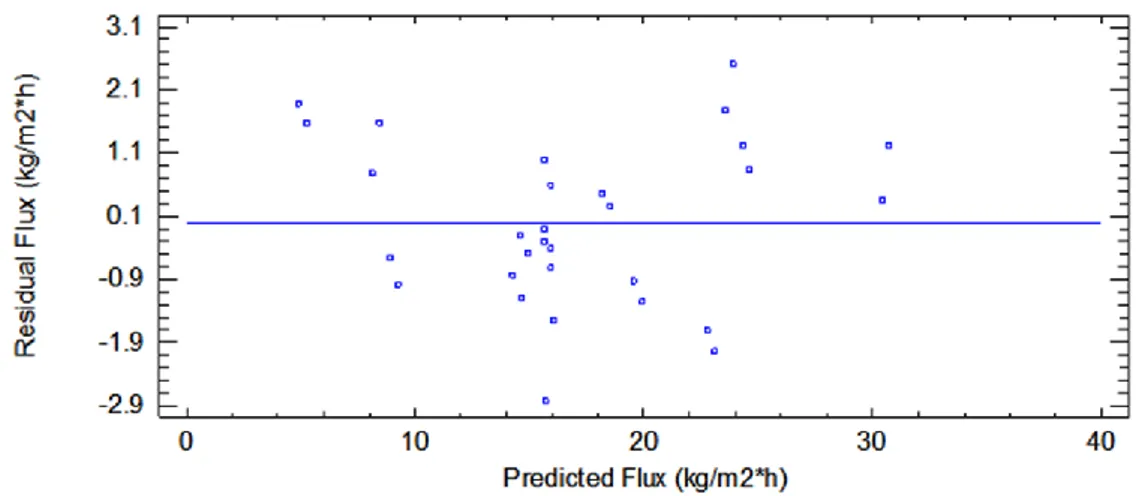
3.7 Plot of residuals against predicted response of permeate flux in the UF process. 56 3.8 Standardized Pareto chart for fouling index……….. 57
3.9 3D response surface with contour plot of fouling index………... 58
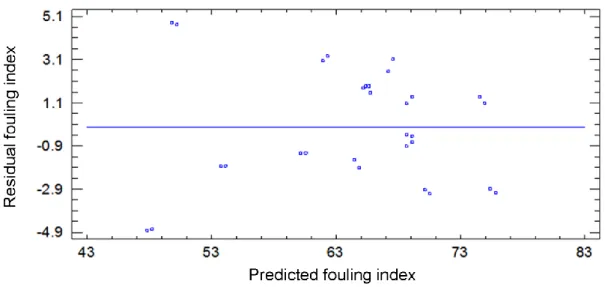
3.10 Plot of residuals against predicted response of fouling index………... 59
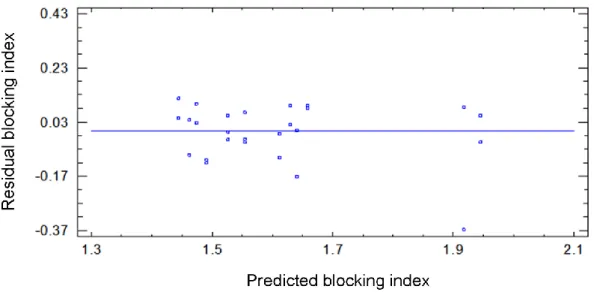
3.11 Plot of residuals against predicted response of blocking index……… 60
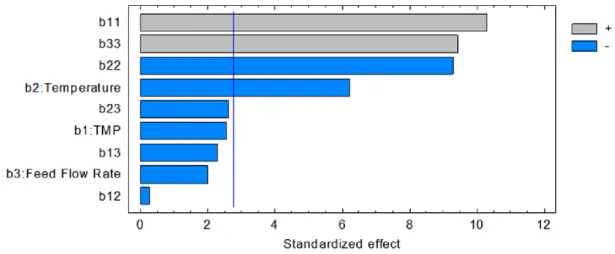
3.12 Standardized Pareto chart for blocking index………... 61
xv
3.15 Standardized Pareto chart for total polyphenols rejection……… 64 3.16 3D response surface with contour plot for total polyphenols rejection………… 65 3.17 Standardized Pareto chart for TAA in the permeate stream………. 67 3.18 3D response surface with contour plot for TAA in the permeate stream……….. 68 3.19 Plot of residuals against predicted response of TAA in the permeate stream…... 70 3.20 Experimental set-up used for the clarification of raw press liquor by UF……… 72 3.21 Time course of permeate flux for press liquor with PS ultrafiltration membrane
of 100kDa, operating conditions: T=21.31±0.23°C; TMP = 1.2 bar)…………... 73 3.22 Samples coming from the UF treatment of orange press liquor………... 73 4.1 Experimental set-up used for the NF with flat-sheet membranes………. 78 4.2 Hydraulic permeability of NF membranes studied. Operating conditions:
Temperature=26.79±1.72°C, Qf=500 L/h………. 81 4.3
NF of clarified orange press liquor with flat-sheet membranes. Time course of permeate flux. Operating conditions: TMP=17 bar; T=31.25±0.56°C; Qf=500 L/h……….
82
4.4 Time course for NF process using flat-sheet membranes. Operating conditions: 35 bar; T=37.56±0.78°C and Qf=500 L/h………. 83 4.5 Experimental set-up used for the NF of clarified orange press liquor with a
spiral-wound membrane module………... 85 4.6 Time course of NF process with NF-PES-10 spiral wound membrane.
Operating conditions: TMP=17 bar, T=20.73±1.40°C………. 87 4.7 Time course of NF process with NF-PES-10 spiral wound membrane.
Operating conditions: TMP=17 bar, T=20.73±1.40°C………. 88 5.1 Schematic representation of water vapour flux through an OD membrane…….. 94 5.2 Schematic diagram of OD experimental set-up……… 95 5.3 Treatment of NF retentate by OD. Time course of (a) evaporation flux and TSS
content; (b) calcium chloride dehydrate concentration………. 98 5.4 Evolution in concentration of hesperidin during OD……… 99 5.5 Samples collected at different times during the concentration of the NF
retentate by OD………. 100 5.6 Conceptual process design for the treatment of citrus press liquor based on an
1
Fundamentals of membrane separation processes
1.1 Membranes and Membrane Processes
The first commercial production of microporous membranes on small scale started in 1930 together with the first practical application of ion-exchange membranes and the development of the theory on ionic transport through charged membranes [1]. However, until the late 1960s membranes were used in a few laboratory and analytical applications, but not for industrial applications because they were too slow, too expensive and too unselective. The seminal discovery that transformed membrane separation from a laboratory to an industrial process was the development of defect-free ultrathin cellulose acetate membranes by Loeb-Sourirajan process in the 1960s [2,3].
Actually the situation is different because membranes are more robust, modules and equipment are better designed and costs have come down significantly, partly because of the maturing technology and partly because of competition from an increasing number of membrane suppliers and original equipment manufacturers [4]. Membrane technology is presently an established part of several industrial processes to produce drinking water from the sea, to clean industrial effluents and recover valuable constituents, to concentrate, purify, or fractionate macromolecular mixtures in the food and drug industries, and to separate gases and vapours [5]. Membrane separation technologies have attracted much attention in the food industries over recent decades as low energy processes providing a gentle treatment of the products at low-moderate temperatures and covering steps such as separation, fractionation, concentration, purification and clarification of various streams.
Membrane processes are guided by four major driving forces such as temperature, activity, electrical potential, and hydrostatic pressure gradients. Major applications of membrane processes in the food industry are related with pressure-driven processes, such as microfiltration (MF), ultrafiltration (UF), nanofiltration (NF) and reverse
2
osmosis (RO). These processes are based on the use of a permselective barrier through which fluids and solutes are selectively transported when a hydrostatic pressure is applied across it. As a result, the feed solution is converted in a permeate containing all the components which have permeated the membrane and a retentate containing all the compounds rejected by the membrane. In addition, a relatively new process, called osmotic distillation (OD), where the driving-force is a vapour pressure gradient between two sides of a hydrophobic membrane, has gained the attention for concentrating liquid foods because it works under normal pressure and temperature conditions, preserving the nutritious characteristics of the food [6].
The first section of this chapter will provide an overview on materials and structures of synthetic membranes. The last section is focused on membrane design and evaluation of membrane performance.
1.2 Membrane materials
A large variety of synthetic membranes has been reported in scientific and patent literature. The differences may be caused by material partitioning during membrane formation or by some selected surface postformation treatments. Membrane chemistry determines important properties as hydrophilicity or hydrophobicity, presence or absence of ionic charges, chemical and thermal resistance, binding affinity for solutes or particles, biocompatibility, etc. [4,5].
Membrane materials must be chemical resistant to both feed and cleaning solutions, mechanically and thermally stable, and characterised by high selectivity and permeability.
The materials used for the preparation of membranes can be synthetic polymers, cellulose derivatives, ceramics, inorganic and metals; they may be neutral or carry electrical charges. Although over 130 materials have been used to manufacture membranes, only a few have achieved commercial status, and fewer still have to obtain regulatory approval for use in food.
3
A summary of typical materials suitable for pressure-driven membrane processes is shown in Table 1.1.
Table 1.1. Materials used for the manufacture of membranes.
Material Processes
Alumina MF
Carbon-carbon composites MF
Cellulose esters (mixed) MF
Cellulose nitrate MF
Polyamide, aliphatic (e.g., nylon) MF
Polycarbonate (track-etch) MF Polyester (track-etch) MF Polypropylene MF Polytetrafluoroethylene (PTFE) MF Polyvinyl chloride (PCV) MF Polyvinylidene fluoride (PVDF) MF
Sintered stainless steel MF
Cellulose (regenerated) MF, UF
Ceramic composites (zirconia on alumina) MF, UF
Polyacrylonitrile (PAN) MF, UF
Polyvinyl alcohol (PVA) MF, UF
Polysulfone (PS) MF, UF
Polyethersulfone (PES) MF, UF, NF
Cellulose acetate (CA) MF, UF, RO
Cellulose triacetate (CTA) MF, UF, RO Polyamide, aromatic (PA) MF, UF, NF, RO
Polyamide (PI) UF, RO
CA/CTA blends RO
Composites
(e.g., polyacrylic acid on zirconia or stainless steel) RO Composites, polymeric thin film
(e.g., PA or polyetherurea on polysulfone) RO
Polybenzimidazole (PBI) RO
4
1.3 Membrane structure
Synthetic membranes can be classified on the basis of their structure as: porous membranes, homogeneous membranes, solid membranes carrying electrical charges and liquid or solid films containing selective carriers [5].
Porous membranes consist of a solid matrix with defined pores with diameters ranging from less than 1 nm to more than 10 µm. Porous membranes can be classified as: macroporous, with average pore diameters larger than 50 nm (i.e. MF and UF membranes); mesoporous, with average pore diameters in the range between 2 and 50 nm (i.e. NF membranes); microporous, if average pore diameters are between 0.1 and 2 nm. Dense membranes, such as those used in RO, have no individual permanent pores but the separation occurs through fluctuating free volumes.
Furthermore, the structure of membranes may be symmetric, if pore diameters do not vary over the membrane cross-section, or asymmetric, with pore diameters increasing from one side of the membrane to the other.
Symmetric porous membranes can be prepared by using different techniques such as sintering, track-etching and leaching [5]. Specific details related to these techniques are extensively reported in literature [7-15].
On the other hand, asymmetric membranes consist of a thin (0.1 to 1 µm) selective skin layer supported by a highly porous (100 to 200 µm) thick substructure. The skin layer represents the active layer of the membrane and the separation characteristics will depend on the nature of the material or the size of pores in the skin-layer. These membranes are generally used for UF, NF and RO applications. Asymmetric membranes can be prepared through two different techniques: (i) the phase inversion process, which leads to an integral structure with the skin and the support structure made from the same material in a single process (integral asymmetric membranes) [16]; (ii) the deposition of an extremely thin polymer film on a preformed porous substructure in a two-step process, leading to a so-called composite membrane [17]. Generally, the barrier and support are made from different materials.
5
Fig. 1.1 shows the cross section of asymmetric membranes in flat sheet and hollow fibre configurations.
Fig. 1.1. Cross section of: (a) cellulose acetate asymmetric flat sheet membrane; (b) polyamide hollow fibre asymmetric membrane.
The filtration capability of pressure-driven membrane processes is shown in Fig. 1.2. MF is used to separate particles with diameters of 0.1-10 m from a solvent or other low molecular weight compounds. These particles are generally larger than those separated by UF and RO. Consequently, the osmotic pressure for MF is negligible and hydrostatic pressure differences used in MF are relatively small (in the range of 0.5-4 bar). UF is based on the use of asymmetric membranes with pore sizes in the skin layer of 2-10 nm. Typically dissolved molecules or small particles not larger than 0.1 m in diameter are retained. An UF membrane is typically characterized by its molecular weight cut-off (MWCO), defined as the equivalent molecular weight of the smallest species that exhibit 90% rejection. The MWCO of UF membranes is between 1 to 100 kDa. Hydrostatic pressures of 2-10 bar are typically used.
6
Fig.1.2. Filtration capability of pressure-driven membrane operations.
In the NF process, components of a fluid are fractionated mainly according to their size and charge. Multivalent ions and uncharged organic molecules with molecular weight between 100 and 1000 Da are typically separated. NF membranes are characterised by a charged surface with pore diameters in the range 1-3 nm. They operate at lower pressures (generally in the range 3-30 bar) than RO membranes.
RO membranes are typically used to separate low molecular weight compounds from a solvent, usually water. The particle size range for applications of RO is 0.1-1 nm and solutes with molecular weight greater than 300 Da are separated. The hydrostatic pressures applied as driving force in RO are of the order of 10-100 bar.
7
1.4 Process design and operation
The selection of the most effective membrane for a specific application plays an important role in determining the desired level of separation to be obtained. However, for an efficient utilization of membranes the process design is equally important.
The process design is defined by different aspects concerning the membrane configuration, filtration methods (dead-end and cross-flow configuration) and the process configuration. It is also of importance for the control of concentration polarization and fouling phenomena determining to a large extent the useful membrane for a specific separation.
1.4.1 Membrane modules
The membrane module concept denotes the device where the membrane must be installed to perform the separation process. On large industrial scale, membrane modules are available in six basic designs: cartridge, hollow fibre, spiral-wound, tubular, plate-and-frame and capillary. They are quite different in their design, mode of operation, production costs and energy requirement for pumping the feed solution through the module.
Pleated cartridge modules are used mainly in dead-end microfiltration; they consist of a pleated membrane cartridge installed in a pressurized housing. These systems are operated at relatively low pressures of 1 to 2 bar. The main applications are related with the sterile filtration of water and beverages such as wine, beer and fruit juices, as well as pharmaceutical solutions. At industrial scale they are used as pre-filters in RO water desalination plants [5].
The plate-and-frame configuration (Fig. 1.3-a) is mainly used for small-scale applications (production of pharmaceuticals, bioproducts or fine chemicals). Membranes, feed flow spacers and porous permeate support plates are layered together between two endplates and placed in a housing. The sheets are either in the form of
8
circular discs, elliptical sheets or rectangular plates. The feed mixture is pressurized in the housing and forced across the membrane surface. A portion passes through the membrane, enters the permeate channel, and makes its way to a central permeate collection manifold.
Plate-and-frame modules are quite expensive and the membrane replacement is labour intensive. They are used in a limited number of UF applications with highly fouling feeds. The feed channels are often less than 1 mm and although more sensitive to fouling are easier to clean as no mesh support is used.
The spiral-wound configuration, widely used in UF, NF and RO, is basically a variation of the plate-and-frame geometry. In this configuration the feed flow channel spacer, the membrane, and the porous membrane support form an envelope that is rolled around a perforated collection tube (Fig. 1.3-b). The module is placed inside a tubular pressure housing made from stainless steel or PVC. The feed solution passes axially through the feed channel across the membrane surface. The permeate stream is moved along the permeate channel and is collected in the collection tube.
Fig. 1.3. Schematic representation of (a) plate and frame, (b) spiral-wound, (c) tubular, (d) hollow fiber membrane module.
9
The spiral wound configuration is compact providing a relatively large area per unit volume; so it is relatively inexpensive but prone to particulate fouling (thus pre-filtration is needed).
Tubular membrane modules (Fig. 1.3-c) consist of membrane tubes placed into porous stainless steel or fiberglass reinforced plastic pipes. The feed solution is pressurized internally along the tubes and the permeate is collected on the outer side of the porous support. Tube diameters are in the range of 1 to 2.5 cm and a number of tubes are placed in one pressure housing in order to increase the module productivity.
The main advantage of the tubular configuration is that concentration polarization effects and membrane fouling phenomena can be easily controlled; however, low surface areas can be installed in a given unit volume resulting in high production costs. Basically, tubular membrane modules are used to treat feed solutions characterised by high viscosity and high content of solids.
Capillary and hollow fibre membrane modules have the same basic spinning process for the preparation. The principal differences are related with the inner diameter and also with the position of the selective layer. Capillary membrane modules are constituted by a large number of capillaries with an inner diameter of 0.5-3 mm arranged in parallel as a bundle in a shell tube. The feed is pumped in the lumen of the membranes while the permeate is collected in the shell side This configuration is characterised by a high membrane area per module volume and low production costs; another advantage is the possibility to control concentration polarization and membrane fouling through a physical process called back flushing in which the permeate flow is reversed allowing to dislodge the fouling material from the membrane surface. The required low operating pressure (4-6 bar as maximum values), due to the limited stability of the membranes, is the main drawback.
Hollow fibre membrane modules consist of a bundle of several membrane fibres with the free ends potted with an epoxy resin into a cylindrical housing. Typically the outer diameter of fibres is between 50 and 200 µm; in this case the selective layer is on the outside of the fibres where the feed fluid is applied, while the permeate is removed down the fibre bore (Fig. 1.3-d).
10
Hollow fibre membrane modules consisting of fibres with diameter between 200 and 500 m are also available. In these systems the solution is fed into the lumen of the fibres and the permeate is removed from the shell side. Hollow fibre membrane modules are characterised by the highest packing density if compared with other configurations and their production is very cost effective. Drawbacks are related to the difficult control of concentration polarization and membrane fouling. Consequently extensive pre-treatments of the solution are needed in order to remove particles, macromolecules or other materials which can precipitate at the membrane surface.
A brief summary of membrane module characteristics is shown in Table 1.2.
Table 1.2. Characteristics of different membrane modules.
Module Type
Area of standard module
(m2)
Characteristics
Hollow fine fiber 300-600
Low cost per m2 of membrane but modules easily fouled
Only suitable for clean fluids
Capillary fiber 50-150
Limited to low pressure applications <200psi; good fouling resitance, can be backflushed
Important in ultrafiltration (UF) and microfiltration (MF) applications
Spiral wound 20-40
The most common RO module
Increasingly used in UF and gas separation applications
Tubular 5-10 High cost limits applications Plate and Frame 5-10 High cost limits applications
1.4.2 Filtration methods
Pressure-driven membrane operations can be operated either in dead-end or in cross-flow configurations. In the dead-end mode (Fig. 1.4-a) the feed cross-flow is perpendicular to the membrane surface. It is forced through the membrane, which causes the retained
11
particles to accumulate and form a type of cake layer at the membrane surface. The thickness of the cake layer increases with the filtration time. Therefore, the permeation rate decreases by increasing the cake layer thickness. Dead-end filtration is often used as a method to estimate the specific cake resistance for cross-flow filtration and usually gives reasonable data for spherical and ellipsoidal-shaped cells [18].
In cross-flow filtration (Fig. 1.4-b), the fluid to be filtered flows according to a parallel direction to the membrane surface and permeates through the membrane due to the imposed transmembrane pressure difference. Unlike dead-end filtration, rejected particles form a cake layer on the membrane surface which does not build up indefinitely so the cake formed is of a limited thickness. Under the action of pressure drop and frictional drag on the cake particles, the compressible cake phenomena can be enumerated as follows: (i) successive particles rearrangement inside the cake under stress; (ii) matrix compression in gel-like cakes; (iii) complex cases where both the aforementioned phenomena interplay, such as in the case of a biofilm [19,20].
Fig. 1.4. Schematic representation of (a) dead-end and (b) cross-flow filtration.
The cake structure will be affected by different phenomena such as the collapse of the pore structure, pore compression and pore distortion. This set of phenomena will affect in different extent the porosity, the pore size and the pore tortuosity of the filtration cake [3].
12
1.4.3 Process configuration
The most common process configurations used in practical applications of pressure-driven membrane processes are illustrated in Fig. 1.5.
In the total recycle configuration (Fig. 1.5-a), permeate and retentate streams are recycled back to the feed reservoir so that a steady state is attained in fixed concentration of the feed. This configuration is mainly used in order to study the effect of different operating parameters (feed concentration, cross flow velocity, transmembrane pressure, temperature) on steady state permeate flux and permeate quality [21].
In the batch concentration configuration, the retentate is returned to the feed reservoir and the permeate is collected separately (Fig. 1.5-b). This approach requires the least membrane area to achieve a given separation/unit time. Batch operations are used when the permeate is the product of interest, such as in fruit juice clarification or treatment of effluents in which the retentate has to be discharged.
Fig. 1.5. Schematic diagram of (a) total recycle, (b) batch concentration, (c) feed-and-bleed and (d) diafiltration configuration.
13
The feed-and-bleed configuration is commonly used for continuous operation when a higher recovery rate must be obtained (for example in the food industries). In this case the permeate is removed from the system together with a small part of the retentate (Fig. 1.5-c). Most of the retentate is recycled and mixed with the feed solution to maintain a high tangential velocity in the membrane module. A feed pump and a recirculation pump are required to provide the transmembrane pressure and the cross-flow, respectively.
Diafiltration (Fig. 1.5-d) involves the addition of water to the retentate in order to overcome low permeate fluxes at high concentrations or to improve the separation of permeable compounds. It can be carried out in sequential form (by replacing the permeate with an equal volume of pure solvent) or continuously (by replacing the permeate with the same flow rate of added water). This configuration is often used when a more complete separation of micro- and macrosolutes is required.
1.5 Membrane performance
The membrane performance in pressure-driven membrane systems is determined by the filtration rate and membrane separation properties generally, evaluated in terms of membrane rejection.
Several mathematical models are available in literature that attempt to describe the mechanism of transport through membranes. Although the operating techniques of MF, UF, NF and RO are similar, some considerations should be taken into account. In MF and UF the convection of a bulk solution is the dominant form of transport, while diffusion is generally insignificant. In NF and RO, matter is transported through the membrane mainly by diffusion of individual molecules through a more or less homogenous membrane matrix, but convection can become significant with high flux membranes [5].
14
In this section a brief description of separation capabilities of membranes, transport mechanisms and concentration polarization and fouling phenomena in pressure-driven membrane systems is reported.
1.5.1 Membrane rejection and volume reduction factor
The separation capability of MF, UF, NF and RO membranes can be expressed in terms of membrane rejection according to the following equation:
( ) (1.1)
where R is the membrane rejection for a given component in defined conditions of hydrostatic pressure and feed solution concentration, while Cp and Cf are the
concentrations of the component in the permeate stream and feed solution, respectively. However, the concentrations in the retentate and permeate streams depend not only on the membrane rejection but also on the recovery rate () which is given by:
(1.2)
where Vp=Vp(t) and V0 are the permeate volume and the initial feed volume,
respectively, and t is the time. The recovery rate ranges between 0 and 1. Sometimes data are also presented as volume reduction factor (VRF):
(1.3)
where Vo is the initial volume (mL) of the feed, Vr(t) the final volume (mL) of the
retentate at particular time (t) and Vp(t) the volume collected on the permeate side at a
particular time [22].
1.5.2 Transport mechanisms
The transport mechanisms in membrane operations are generally described by phenomenological equations such as Darcy´s law, Fick´s law, Hagen-Poisseuille´s law and Ohm´s law [5]. In MF and UF processes components that permeate through the
15
membrane are transported by a convective flow through the membrane pores under a pressure gradient as driving force and the separation occurs through a size exclusion mechanism. Darcy´s law [4,23] describes this type of transport:
(1.4)
where Jw is the volume flux (m/s), Am is the membrane cross sectional area (m2), Vp is
the filtrate volume (m3) collected on the permeate side at a particular time interval
dt (s), ΔP is the applied transmembrane pressure (Pa), μ is the viscosity (Pa·s) of the
permeate sample and RT is the total membrane resistance (m−1). RT is given by:
(1.5)
where RC is the cake layer resistance (m−1) due to the concentration polarization and the
deposition of solids on the membrane surface, RF is the fouling layer resistance (m −1
) due to the internal fouling inside the pores and RM the intrinsic membrane resistance.
Experimentally, the resistances defined in Eq. (1.5) can be determined from the values of the hydraulic permeability measured before and after the cleaning procedures. In particular, RM can be calculated by measuring the hydraulic permeability of the new or
clean membrane as:
(1.6)
where µw is the viscosity of pure water [24,25] and Lp0=Jw/P is the hydraulic
permeability (m/s·Pa) of the new membrane. RT can be calculated as:
(1.7)
in which Lp1 is the hydraulic permeability of the membrane after the treatment with a
specific solution. RC is removed by cleaning the membrane with water. The hydraulic
permeability measured after such cleaning is Lp2, therefore:
(1.8)
Finally, the resistance caused by the cake layer formation can be estimated as:
16
In an ideal situation (pores uniformly distributed, no fouling and negligible concentration polarization) the fluid flow through a porous membrane can be described by the Haugen-Poiseuille law:
(1.10)
where is the surface porosity of the membrane, dp the mean pore diameter, PT the
applied transmembrane pressure, x the length of the channel and the viscosity of the fluid permeating the membrane.
The net driving force ∆P for an ideal membrane process should be (PT-∆ᴨ) where:
(1.11)
(1.12)
in which PF and PP are the pressures on the feed and permeate side of the membrane,
respectively; similarly, F and P are the osmotic pressures on the feed and permeate
side.
The cross flow mode gives rise to a pressure drop from the inlet to the outlet of the membrane module, so that the feed side pressure is expressed as:
(1.13) where Pi is the inlet pressure of the membrane module and Po the outlet pressure.
The Haugen-Poiseuille law assumes that the flow through the pores is laminar and independent of time, the density is constant, the fluid is Newtonian and end-effects are negligible.
According to the Equation (1.10), the flux is directly proportional to the applied pressure and inversely proportional to the viscosity. Basically, viscosity is controlled by solids concentration and temperature; for non-Newtonian liquids, it is also affected by shear rate and velocity.
17
The model is largely true under certain conditions such as low pressure, low feed concentration and high feed velocity; when the process deviates from any of these conditions, flux becomes independent of pressure. In these conditions mass transfer limited models, such as the film theory, can effectively describe the process.
1.5.3 Concentration Polarization and membrane fouling
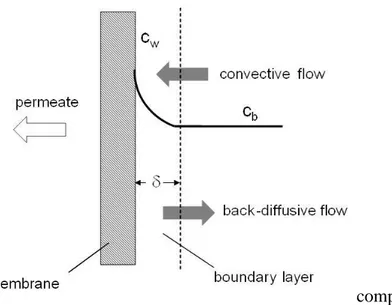
Concentration polarization is a natural consequence of the selectivity of a membrane. When a feed solution containing a solvent and a solute or suspended solids is filtered through a porous membrane, some components permeate the membrane under a given driving force while others are retained. This leads to an accumulation of particles or solutes in a mass transfer boundary layer adjacent to the membrane surface that can affect the flux. A concentration gradient between the solution at the membrane surface and the bulk is established which leads to a back transport of the material accumulated at the membrane surface by diffusion and eventually other means. This phenomenon, schematically represented in Fig. 1.6, is referred to as concentration polarization [26,27]. It is not to be confused with the membrane fouling phenomenon that is essentially due to a deposition of retained particles onto the membrane surface or in the membrane pores.
In NF and RO, mainly low molecular weight materials are separated from a solvent such as water producing an increase in the osmotic pressure which is directly proportional to the solute concentration at the membrane surface and thus a decrease in the membrane flux at constant applied hydrostatic pressures [28]. On the other hand in MF and UF the mechanism is different due to the fact that macromolecules and particles are retained by the membrane, thus osmotic pressure is generally quite low. The retained components often are precipitated and form a solid layer at the membrane surface. This layer, which often exhibits membrane properties itself, can affect the membrane separation characteristics significantly by reducing the membrane flux and by changing the rejection of lower molecular weight compounds [5].
18
components
Fig. 1.6. Schematic representation of concentration polarization (cw = gel concentration; cb = bulk concentration).
The term fouling is referred to a long term flux decline caused by the deposition of retained particles (colloids, suspended particles, macromolecules, etc.) onto the membrane surface and/or within the pores of the membrane. The fouling behavior is strongly affected by the physico-chemical nature of the membrane, the solutes and the fluid dynamic system design.
According to Bacchin et al. [29] the build-up of material may take different forms such as: i) adsorption, when attractive interactions between the membrane and particles exist; ii) pore blockage, with a reduction in flux due to the closure (or partial closure) of pores (this phenomenon is predominant in porous membranes such as MF and UF membranes); iii) a deposit of particles which can grow layer by layer at membrane surface leading to an additional hydraulic resistance; iv) a gel formation due to concentration polarization of macromolecules like pectins.
The type of fouling, described above, can be determined experimentally by using the empirical model developed by Hermia [30-34]. The type of fouling is obtained from the
19
(
) (1.14)
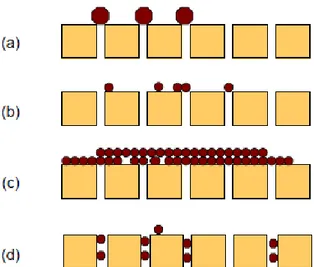
where the blocking index i and the resistance coefficient k are functions of the blocking models. The model expressed by eq. 1.14 permits, on the basis of experimental data, to point out the fouling mechanism involved in the filtration process, according the estimated value for i; for example, i=2 is complete blocking, i=1.5 is standard blocking,
i=1 is intermediate blocking, and i=0 is cake filtration (Fig. 1.7). The blocking index
and the resistance coefficient can be calculated by plotting d2t/dv2 versus dt/dv or solving eq.1.14 [35].
Fig. 1.7. Schematic representation of (a) complete blocking, (b) intermediate blocking, (c) cake filtration and (d) standard blocking in pressure-driven membrane processes.
In addition, fouling can be evaluated by comparing the hydraulic permeability before and after the treatment according to the following equation:
( ) (1.15)
where L1p and L0p are the hydraulic permeabilities measured after and before the treatment of the feed solution, respectively.
Although polarization concentration and fouling phenomena determine a reduction of the permeate flux they can have an opposite effect on the observed rejection.
20
The concentration polarization determines a reduction of the rejection; in case of fouling, if the build-up of solids on the membrane is significant enough, it may act as a secondary membrane and change the effective sieving and transport properties of the system: consequently, the rejection can be increased or maintained constant. In addition, while the concentration polarization is a reversible process based on diffusion taking place over a few seconds, fouling is generally irreversible and the flux decline is a long term process. Finally, the concentration polarization can be minimized by hydrodynamic means, such as the feed flow velocity and the membrane module design; on the contrary, the control of membrane fouling is more difficult.
Methods generally accepted to control and minimize fouling phenomena include feed pre-treatment, modification of membrane properties, modification of operating conditions, flow manipulation and membrane cleaning with proper chemical agents. A mathematical model generally accepted to describe concentration polarization phenomena is the well-known film theory. As previously reported, this model is more useful in describing transport phenomena through membranes when a polarized layer is reached and the flux becomes independent of pressure.
The film model assumes that the solute is brought to the membrane surface by convective transport at a rate Js defined as:
(1.16)
where J is the permeate flux and CB is the bulk concentration of rejected solute. The
resulting gradient causes a back-transport of solute into the bulk of the solution due to diffusional effect, which can be described as:
(1.17)
where D is the diffusion coefficient and dC/dx is the concentration gradient over a differential element in the boundary layer. Once the steady state is reached, the two mechanisms will balance each other, and Equations (1.16) and (1.17) can be equated and integrated over the boundary layer leading to the following equation:
21
where CG is the gel concentration (solute concentration at the membrane surface), and k
is the mass transfer coefficient given by:
(1.19)
where δ is the thickness of the boundary layer over which the concentration gradient exists.
Several relationships to correlate the mass-transfer coefficients with physical properties, flow channel dimensions, and operating parameters have been reported in literature [36-38]. These relationships generally adapted to specific applications are not universally applicable.
An estimation of the mass transfer coefficient can be approached through a dimensional analysis. By using the theorem the following equation can be derived:
(1.20)
where Sh, Re and Sc are Sherwood, Reynolds and Schmidt numbers, respectively. The dimensionless numbers can be obtained through Equations (1.21), (1.23) and (1.24).
(1.21)
here dh is the hydraulic diameter that can be calculated as:
(1.22)
The Sherwood number is a measure of the ratio of convective mass transfer to molecular mass transfer; the Reynolds number is a measure of the ratio of inertia effect to viscous effect and the state of turbulence in a system can be obtained as:
(1.23)
In general, Re values less than 1800 are considered to be laminar flow, and Re greater than 4000 turbulent flow [4].
22
The Schmidt number represents the ratio of momentum diffusivity (viscosity) and mass transfer; it is given by:
(1.24)
The exponents α and β in equation (1.20) are constants determined by the state of development of the velocity and concentration profiles along the channel.
On the other hand, in processes such as NF and RO where membranes are non-porous, the separation occurs by means of a different solubility and diffusivity of components across the membrane due to a concentration or chemical potential gradient. The molecules diffusion through homogeneous dense membranes occurs through the free volume elements, or empty spaces between polymer chains caused by thermal motion of the polymer molecules, which fluctuate in position and volume on the same time scale as the molecule permeates. This type of transport is described by the Fick’s law:
(1.25)
23
References
[1] S.P. Nunes, K.V. Peinemann. 2001. Membrane Technology in the Chemical Industry. Weinheim: Wiley-VCH Verlag GmbH.
[2] S. Loeb, S. Sourirajan. 1962. Seawater demineralization by means of a semipermeable membrane. In Advances in Chemistry, ed. R. Gould, 117-132. Washington: American Chemical Society.
[3] M. Mota, J.A. Teixeira, A. Yelshin. Influence of cell-shape on the cake resistance in dead-end and cross-flow filtrations. Separation and Purification Technology, 27 (2002) 137-44.
[4] M. Cheryan, 1998. Ultrafiltration and Microfiltration handbook. Lancaster: Technomic Publishing Company.
[5] H. Strathmann, L. Giorno, E. Drioli. 2006. An introduction to membrane science and technology. Roma: Consiglio Nazionale delle Ricerche.
[6] P. Hogan, R. Canning, P. Peterson, R. Johnson, A. Michaels, A new option: osmotic distillation. Chemical Engineering Progress, 94 (1998) 49–61.
[7] R.R. Bhave. 1991. Inorganic Membranes: Synthesis, Characterization and Application. New York: Van Nostrand Reinhold.
[8] J.E. Cadotte. 1985. Evolution of composite reverse osmosis membranes. In Material Science of Synthetic Membranes, ed. D.R. Lloyd, ACS Symposium Series 269, 273-294. Washington: American Chemical Society.
[9] M.A. Frommer, I. Feiner O. Kedem, R. Bloch. Mechanism for formation of skinned membranes: II. Equilibrium properties and osmotic flows determining membrane structure. Desalination, 7 (1970) 393-402.
[10] W.C. Hiatt, G.H. Vitzthum, K:B. Wagner, K. Gerlach, C. Josefiak. 1985. Microporous membranes via upper critical temperature phase separation. In Material Science of Synthetic Membranes, ed. D.R. Lloyd, ACS Symposium Series 269, 229-244. Washington: American Chemical Society.
[11] K. Kamide, S. Manabe. 1985. Role of microphase separation phenomena in the formation of porous polymeric membranes. In Material Science of Synthetic Membranes, ed. D.R. Lloyd, ACS Symposium Series 269, 197-228. Washington: American Chemical Society.
24
[12] R.E. Kesting. 1985. Phase inversion membranes. In Material Science of Synthetic Membranes, ed. D.R. Lloyd, ACS Symposium Series 269, 131-164. Washington: American Chemical Society.
[13] J. Smid, C. Avci, V. Guenay, R.A. Terpstra, J.P.G.M. Van Eijk.. Preparation and characterization of microporous ceramic hollow fiber membranes. Journal of Membrane Science, 112 (1996) 85-90.
[14] S. Sourirajan, B. Kunst. 1977. Cellulose acetate and other cellulose ester membranes. In Reverse osmosis and synthetic membranes, ed. S. Sourirajan, 129-152. Ottawa: National Research Council Canada.
[15] H. Strathmann. 1985. Production of microporous media by phase inversion processes. In Material Science of Synthetic Membranes, ed. D.R. Lloyd, ACS Symposium Series 269, 165-195. Washington: American Chemical Society.
[16] R.E. Kesting. 1971. Synthetic polymeric membranes. New York: McGraw-Hill. [17] J.E. Cadotte, R.I. Petersen. 1981. Thin film reverse osmosis membranes: Origin,
development, and recent advances. In: Synthetic membranes, ed. A.F. Turbak, ACS Symposium series 153, 305-325. Washington: American Chemical Society.
[18] T. Tanaka, K.I. Abe, H. Asakawa, H. Yoshida, K. Nakanishi. Filtration characteristics and structure of cake in cross-flow filtration of bacterial suspension. Journal of Fermentation and Bioengineering, 78 (1994) 455-61.
[19] F.M. Tiller, H.R. Cooper. The role of porosity in filtration. Part V, Porosity variation in filter cakes. American Institute of Chemical Engineers 8 (1962)445-9. [20] F.M. Tiller, C.S. Yeh. The role of porosity in filtration. Part X. Deposition of
compressible cakes on external radial surface. American Institute of Chemical Engineers, 31 (1985) 1241-8.
[21] P. Rai, G.C. Majumdar, G. Sharma, S. DasGupta, S. De. Effect of various cutoff membranes on permeate flux and quality during filtration of mosambi (Citrus sinensis L.) Osbeck juice. Food and Bioproducts Processing, 84 (2006) 213-9. [22] V. Singh, P.K. Jain, C. Das. Performance of spiral wound ultrafiltration membrane
module for with and without permeate recycle: Experimental and theoretical consideration. Desalination, 322 (2013) 94-103.
[23] S.F. Mexis, M.G. Kontominas. Effect of oxygen absorber, nitrogenflushing, packaging material oxygen transmission rate and storage conditions on quality retention of raw whole unpeeled almond kernels (Prunus dulcis). LWT-Food Science and Technology, 43 (2010) 1-11.
25
[24] C. Das, P. Patel, S. De, S. Das Gupta. Treatment of tanning effluent using nanofiltration followed by reverse osmosis. Separation and Purification Technology, 50 (2006) 291-9.
[25] K.S. Youn, J.H. Hong, D.H. Bae, S.J. Kim, S.D. Kim. Effective clarifying process of reconstituted apple juice using membrane filtration with filter-aid pretreatment. Journal of Membrane Science, 228 (2004) 179-86.
[26] P. Aimar, J.A. Howell, M. Turner. Effects of concentration boundary layer development on the flux limitations of ultrafiltration. Chemical Engineering Research and Design, 67 (1989) 255-61.
[27] M. Mulder. 1991. Basic Principles of Membrane Technology. Dordrecht: Kluwer Academic Publishers.
[28] G. Belfort. Fluid mechanics in membrane filtration. Journal of Membrane Science, 40 (1989) 123-147.
[29] P. Bacchin, P. Aimar, R.W. Field. Critical and sustainable fluxes: Theory, experiments and applications. Journal of Membrane Science, 281 (2006) 42–69. [30] M.C. Vincent Vela, S. Alvarez Blanco, J. Lora García, E. Bergantiños Rodríguez,
Analysis of membrane pore blocking models adapted to crossflow ultrafiltration in the ultrafiltration of PEG. Chemical Engineering Journal, 149 (2009) 232–241. [31] R.W. Field, D. Wu, J.A. Howell, B.B. Gupta, Critical flux concept for
microfiltration fouling. Journal of Membrane Science, 100 (1995) 259–272.
[32] J. Hermia, Constant pressure blocking filtration law: application to power law non-Newtonian fluids. Transaction of the Institution of Chemical Engineers, 60 (1982) 183–187.
[33] C. Duclos-Orsello, W. Li, C.C. Ho, A three mechanism model to describe fouling of microfiltration membranes. Journal of Membrane Science, 280 (2006) 856–866. [34] M.C. Vincent Vela, S. Alvarez Blanco, J. Lora García, E. Bergantiños Rodríguez,
Analysis of membrane pore blocking models applied to the ultrafiltration of PEG. Separation and Purification Technology, 62 (2008) 489–498.
[35] K.J. Hwang, C.Y. Liao, K.L. Tung, Analysis of particle fouling during microfiltration by use of blocking models. Journal of Membrane Science, 287 (2007) 287–293.
26
[36] V. Gekas, B. Hallstrom. Mass transfer in the membrane concentration polarization layer under turbulent dross flow: I. Critical literature review and adaptation of existing Sherwood correlation to membrane operations. Journal of Membrane Science, 30 (1987) 153-70.
[37] R.K. Sherwood, R.L. Pigford, C.R. Wilke. 1975. Mass transfer. New York: McGraw-Hill.
27
Citrus fruit processing and orange press liquor
characterization
2.1 Citrus fruits: properties and global market
Citrus fruits are probably the most known and extensive fruits around the world. Citrus is the general terms referred to products such as oranges, lemons, grapefruits and limes. Several authors have mentioned that the origin of citrus was in the southeast China and Southeast Asia [1]. Today citrus is cultivated principally in subtropical areas, where the environmental conditions are optimal for its productions. World citrus production and consumption have grown strongly since the mid-1980s. Production of oranges, tangerines, lemons and limes has expanded rapidly, and even faster growth has been realized for processed citrus products as improvements in transportation and packaging have lowered costs and improved quality. The projected orange production in 2010 was 66.4 million tonnes, approximately 14 percent greater than that realized over the 1997-99 period. The projected production was expected to be utilized as 36.3 million tonnes fresh and 30.1 million tonnes processed. Italy is an important orange producer in the EU with a production equal to 2,393,660 tonnes/year that represents the 3.45% of the world production according with the data published by the Food and Agriculture Organization of the United Nations (FAOSTAT) [2].
Citrus is a product with many desirable characteristics for consumers who are health-conscious, demand convenience and place a premium on food safety. Phenolic compounds present in citrus fruits have gained a lot of importance due to their potential as prophylactic and therapeutic agents in many diseases [3-9]. In human body reactive oxygen species (ROS) and reactive nitrogen species (RNS) are constantly generated for physiological purposes and often over-produced in pathological conditions, resulting in oxidative stress which is defined as “an imbalance” between oxidants and antioxidants in favour of the oxidants, potentially leading to damage [10-12]. Oxidative stress can damage lipids, proteins, enzymes, carbohydrates and DNA in cells and tissues, resulting
28
in membrane damage, fragmentation or random cross linking of molecules like DNA, enzymes and structural proteins and even lead to cell death induced by DNA fragmentation and lipid peroxidation [13]. These consequences of oxidative stress construct the molecular basis in the development of cancer, neurodegenerative disorders, cardiovascular diseases, diabetes and autoimmune disorders [3].
The antioxidant defence system in the human body consist of in several systems such as enzymatic scavengers, hydrophilic scavengers and lipophilic radical scavengers [10,11]. Some of these agents are synthesized by cell itself; however the majority, including ascorbic acid, polyphenols and carotenoids, are derived from dietary sources. For this reason antioxidants have gained a great interest in recent year because of their potential as prophylactic and therapeutic agents in many diseases. The discovery of the role of free radicals in cancer, diabetes, cardiovascular diseases, autoimmune diseases, neurodegenerative disorders, aging and other diseases has led to a medical revolution that is promising a new paradigm of healthcare [3-9].
The global market of antioxidants is increasing rapidly, because of the increased health risk in a constantly polluting environment. These agents also have cosmetic applications, leading to the development of researchers at industrial and academic level to explore these molecules and their analogues [3]. In this way there is a great biomedical interest in the separation, purification and recovery of antioxidant compounds from natural sources. In particular, the consumption of citrus fruits appears to be associated with lower risk of colorectal, esophageal [14,15], gastric [16,17], and stomach [18] cancers, and stroke [17,19-21]. Citrus fruits also appear to be associated with improved blood lipid profiles [22], and improved survival in the elderly [23]. The components responsible for these beneficial effects are unknown, but the citrus flavonoids are one group of compounds that may be involved [24-38]. Some flavonoids have been reported to possess a variety of biological activities and pharmacological properties, including antiallergic, antidiabetic, antiinflammatory, antiviral, antiproliferative, and anticarcinogenic activities, in addition to having effects on mammalian metabolism [17,39].
Flavonoids are widely distributed in fruits, vegetables, fruit juices, cocoa, teas and wines [40] where their distribution depends on several factors, including variation and
29
degree of light exposure [41]. Most Citrus species accumulate substantial quantities of flavonoids during the development of their different organs [40].
More than 5000 different plant-derived flavonoids have been isolated from various plants [42]. They are classified into at least 10 chemical groups. Flavanones, flavones, isoflavonoids, flavans (flavanols), anthocyanins, and flavonols are particularly common in the diet [42-44]. Flavanones are mainly found in citrus fruits [45]. The dominant flavanone glycosides in sweet oranges (Citrus sinensis) are hesperidin and narirutin [46].
Plant material wastes from industries contain high levels of phenolic compounds. Importantly, most of this phytonutrients are found in the orange peel, in the inner white pulp, rather than in the juice, so these beneficial compounds are too often removed by the processing of orange into juice [4,47,48]. Membrane processes such as microfiltration (MF) and ultrafiltration (UF) can be considered a valid approach for separating and recovering valuable compounds from finely divided solid materials present in orange wastes [49].
2.2 Citrus processing
The popularity of orange juice dramatically increased again with the development of the commercial orange juice industry in the late 1920s. In its early days, the juice industry primarily relied on salvaged fruit, which was unsuitable for regular consumption because it was misshapen, badly coloured or blemished. In the 1930s, development of porcelain-lined cans and advances in pasteurization techniques led to improved juice quality and the industry expanded significantly. Then, in 1944, scientists found a way to concentrate the juice by thermal and freezing system without destroying the flavour or vitamin content. After the second world war, concentrated juices became the predominant form.
An overview of the classical production process of orange juice is shown in Fig. 2.1. The major unit operations will be described in the following.
30
Fig. 2.1. Flowchart of industrial orange juice processing.
Cleaning/Grading: The fruit is transported along a conveyor belt where it is washed with a detergent as it passes over roller brushes. This process removes debris and dirt and reduces the number of microbes. The fruit is rinsed and dried. Graders remove bad fruit as it passes over the rollers and the remaining quality pieces are automatically segregated by size prior to extraction. Proper size is critical for the extraction process.
Extraction: Proper juice extraction is important to optimize the efficiency of the juice production process as well as the quality of the finished drink. The latter is true because oranges have thick peels, which contain bitter resins that must be carefully separated to avoid tainting the sweeter juice. There are two automated extraction methods commonly used by the industry. The first places the fruit between two metal cups with sharpened metal tubes at their base. The upper cup descends and the fingers on each cup mesh to express the juice as the tubes cut holes in the top and bottom of the fruit. The fruit solids are compressed into the bottom tube between the two plugs of peel while the juice is
31
forced out through perforations in the tube wall. At the same time, a water spray washes away the oil from the peel. This oil is reclaimed for later use.
The second type of extraction has the oranges cut in half before the juice is removed. The fruits are sliced as they pass by a stationary knife and the halves are then picked up by rubber suction cups and moved against plastic serrated reamers. The rotating reamers express the juice as the orange halves travel around the conveyor line.
Some of the peel oil may be removed prior to extraction by needles which prick the skin, thereby releasing the oil which is washed away. Modern extraction equipment of this type can slice, ream, and eject a peel in about 3 seconds.
The extracted juice is filtered through a stainless steel screen before it is ready for the next stage. At this point, the juice can be chilled or concentrated.
Pasteurization: Thanks to its low pH (about 4), orange juice has some natural protection from bacteria, yeast, and mold growth. However, pasteurization is still required to further retard spoilage. Pasteurization also inactivates certain enzymes which cause the pulp to separate from the juice, resulting in an aesthetically undesirably beverage. This enzyme related clarification is one of the reasons why fresh squeezed juice has a shelf life of only a few hours. Flash pasteurization minimizes flavour changes from heat treatment and is recommended for premium quality products. Several pasteurization methods are commercially used. One common method passes juice through a tube next to a plate heat exchanger, so the juice is heated without direct contact with the heating surface. Another method uses hot, pasteurized juice to preheat incoming unpasteurized juice. The preheated juice is further heated with steam or hot water to the pasteurization temperature. Typically, reaching a temperature of 85-94°C for about 30 seconds is adequate to reduce the microbe count.
Concentration: Concentrated juice is approximately five times more concentrated than squeezed juice. Concentration is useful because it extends the shelf life of the juice and makes storage and shipping more economical. Juice is commonly concentrated with a piece of equipment known as a Thermally Accelerated Short-Time Evaporator