FACOLTÀ DI MEDICINA E CHIRURGIA
Corso di Dottorato di Ricerca in
SALUTE DELL’UOMO
LEVETIRACETAM INFLUENCES DOWNSTREAM
PROTEIN INTERACTIONS AT SYNAPSES
EXPRESSING SV2A
Tesi di Dottorato di Relatore
Marcotulli Daniele Chiarissimo
Prof. Conti Fiorenzo
Table of contents
Acknowledgments 1
Abstract 2
Introduction
Principles of synaptic function 3
SV2 5
Epilepsy 9
Levetiracetam 11
Aim of the research 13
Materials and methods
Animals and treatment 14
Reverse Transcription-Polymerase Chain Reaction (RT-PCR) 14
Western Blot (WB) 15
Network Analysis 17
Newly recycled vesicles isolation 17
Dynamin purification 19
LC/MS mass spectrometry and data analysis 19
Gene Ontology (GO) analysis and overrepresentation test 20
GST protein-protein interaction assay 21
Statistical Analysis 22
Results
Levetiracetam regulates levels of several synaptic
vesicle proteins 23
Levetiracetam regulates protein levels by a
post-transcriptional mechanism 24
A method to isolate newly recycled
vesicles 28
Newly recycled vesicles treated with levetiracetam isolated from SV2B-KO mice contain less complexin
1 31
Levetiracetam hinders synaptotagmin interaction with
SV2A and complexin 33
Discussion 35
Tables 39
1
Acknowledgments
I am very grateful to Dr. Giorgia Fattorini for supporting me in my project and throughout my Ph.D.
I would like to thank Dr. Jessica Perugini for helping me in the RT-PCR experiments. I thank Kristine Ciruelas, Dr. Jia Yao, and the Bajjalieh’s group for developing the protocol to isolate newly recycled vesicles used here.
I thank Kristine Ciruelas for scientific discussion and cooperation.
The mass-spectrometry analyses presented here were conducted in collaboration with the Ong Lab (University of Washington). I gratefully thank Dr. Shao-En Ong and Dr. Ho-Tak Lau for their guidance, knowledge, and continued advice.
Besides, I thank Dr. Marta Balietti, Dr. Luca Bragina, Dr. Walter Gulisano, Dr. Marcello Melone and Arianna Pugliese for exciting discussion and suggestions.
2
Abstract
Although levetiracetam is one of the most widely prescribed antiepileptic drugs, its mechanism of action remains unknown beyond the binding to the synaptic vesicle protein SV2A.
SV2A is one of the three paralogs of the SV2 family. The function of SV2 has not been fully elucidated yet, however it is known that SV2A is involved in synaptic endocytosis and vesicle protein trafficking; in particular, it regulates vesicular levels of synaptotagmin, the calcium sensor for neurotransmitter release.
Here, we tested the hypothesis that levetiracetam affects synaptic vesicle composition. Levetiracetam chronic treatment post-transcriptionally decreased several vesicular proteins and increased LRRK2, without any change in mRNA levels. Analysis of SV2A interactome indicated that the presynaptic proteins regulations induced by levetiracetam are mediated through protein-protein interactions.
Next, we asked whether levetiracetam affects the trafficking function and protein-protein interactions of SV2A. To this end, a new approach to isolate newly endocytosed vesicles was developed. Unbiased proteomics results revealed that levetiracetam changes the association of APT1 (a depalmitoylating enzyme) and complexin-1 (a synaptotagmin interactor) to newly endocytosed vesicles. Protein-protein interaction studies suggested that levetiracetam alters the interaction of synaptotagmin with SV2A and complexin. Importantly, levetiracetam effects predominated in the absence of SV2B, suggesting a possible mechanism of pharmacological specificity.
We propose that levetiracetam shapes the mechanism of neurotransmitter release by altering SV2A trafficking function and that SV2 paralogs’ expression pattern underlies pharmacological specificity.
3
Introduction
Principles of synaptic function
The core concept of brain activity and function involves neuronal communication through a chemical synapse, the site where a neurotransmitter is released from a presynaptic neuron to transfer information to a postsynaptic element. Perturbations of this elemental mechanism constitute the leading cause for most neurological disorders.
The mechanism of neuronal communication has been studied for decades, but the specific principles of synaptic action were not described until the middle of the last century. The pioneering work of Bernard Katz (del Castillo and Katz, 1954; Fatt and Katz, 1952), along with the direct visualization of chemical synapses (De Robertis and Bennett, 1955; Palay and Palade, 1955), characterized the principles of synaptic action. Briefly, the arrival of an action potential at the presynaptic terminal allows the opening of voltage-gated calcium channels; the entry of calcium in the presynaptic terminal triggers the exocytosis of synaptic vesicles containing neurotransmitters that contact specific receptors on the postsynaptic element. Thereafter, a full understanding of the molecular machinery governing neurotransmitter release and its control by Ca2+ has been one of the major quests in molecular neuroscience.
Since the first observations of the synapse using electron microscopy, it has been clear that the synapses in the Central Nervous System (CNS) are of two principal types: type I or asymmetric synapses, and type II or symmetric synapses. Asymmetric synapses generally release glutamate that consequently depolarizes the postsynaptic element. Symmetric synapses release GABA (or glycine) and have an inhibitory function (Colonnier, 1968; Gray, 1959).
Notwithstanding some critical differences in the composition and physiology of the different types of synapses (Sugino et al., 2005), the essential mechanism for neurotransmitter release is the same for all chemical synapses.
The precise timing of neurotransmitter release upon Ca2+ inflow is driven by the interaction and cooperation of a complex molecular machinery. One of the critical steps in this process is membrane fusion at the presynaptic terminal. The SNARE (soluble N-ethylmaleimide-sensitive factor attachment protein receptor) and the SM (Sec1/Munc18-like) complexes are at the center of the machinery controlling membrane fusion and neurotransmitter release (Südhof, 2013). The SNARE complex, formed by the plasma membrane proteins syntaxin-1 and SNAP-25 and the vesicular protein VAMP (synaptobrevin), forces the vesicular and plasma membrane together. The SM proteins Munc18-1 and Sec1 bind to the SNARE complex and mediate the
4 opening of the fusion pore, which is crucial for the release of neurotransmitter in the synaptic cleft (Südhof, 2013). In addition, the precisely timed control of neurotransmitter release requires the cooperation of synaptotagmin and complexin (Zhou et al., 2017). Synaptotagmin is the Ca2+ sensor for neurotransmitter release (Littleton et al., 1993); it is a vesicular protein that binds anionic membranes, the SNARE complex, and Ca2+ by means of two C2 domains (C2A and C2B; Zhou et al., 2017). Complexin, a small soluble protein, interacts with synaptotagmin and inserts into the SNARE complex to lock membrane fusion. Ca2+ binding to synaptotagmin induces molecular rearrangements of the complexin-synaptotagmin-SNARE assembly and unlocks the tripartite complex, thus allowing full membrane zippering and neurotransmitter release (Zhou et al., 2017).
While the described model of vesicular priming and fusion accounts for the basic mechanism driving membrane fusion at the presynaptic terminal, several other proteins are involved in the regulation of presynaptic functions. Indeed, synaptic vesicle composition affects synaptic release probability (Thomson and Thomson, 2000) by regulating trafficking and fusion competence of synaptic vesicles.
The organization of synaptic vesicles is important for understanding how their composition informs these processes. The synaptic vesicles are organized in three major functional pools: a reserve pool, a recycling pool and a readily releasable pool (Alabi and Tsien, 2012; Rizzoli and Betz, 2005; Schikorski and Stevens, 2001). The reserve pool constitutes up to 80-90% of the total vesicles and is recruited only upon intense stimulation; the recycling pool maintains neurotransmitter release on moderate synaptic activity and continuously recycles through the exo-endocytosis cycle; the readily releasable pool is made up of vesicles primed to fuse promptly upon stimulation. The three vesicular pools differ for their localization in the presynaptic terminal and the interaction established with presynaptic proteins. Recently, Truckenbrodt and colleagues proposed that the reserve pool contains “older” vesicles, while the recycling pool is composed of recently synthesized proteins (Truckenbrodt et al., 2018). Whether the different pools are also molecularly defined it is not clear yet, but few proteins and molecular pathways controlling the assignment of synaptic vesicles to different pools have been identified (Cazares et al., 2016; Hua et al., 2011).
To maintain a steady readily releasable pool and recycling pool of vesicles, synaptic exocytosis is followed by endocytosis that allows recycling of vesicle components and vesicles reformation to start a new round of exo-endocytosis (Rizzoli, 2014). A synaptic vesicle comprises of more than 80 different proteins, thus synaptic vesicle reformation requires precise
5 sorting in order to form vesicles of the correct size and stoichiometry (Takamori et al., 2006; Wilhelm et al., 2014). To accomplish this task, central nerve terminals employ a series of cargo recognition/retrieval strategies (Cousin, 2017). Different routes of endocytosis have been described at the presynaptic terminal, but the exact roles and requirements of each are not fully understood (Rizzoli et al., 2014). Importantly, it remains obscure how vesicular proteins are sorted to endocytosing vesicles and how synaptic vesicles maintain their identity or stoichiometry through multiple exo-endocytosis cycles. The most accredited hypotheses consider that some vesicular proteins remain together as metastable assemblies after membrane fusion (Rizzoli, 2014; Willig et al., 2006) and multiple protein-protein interactions between cargo and adaptor proteins mediate endocytosis and vesicle reformation (Cousin, 2017).
Synaptic Vesicle Protein 2 (SV2)
Of the many proteins that compose the synaptic vesicle, Synaptic Vesicle Protein 2 is one of the steadiest and most widespread components, so that it is considered a reliable synaptic marker (Bajjalieh et al., 1994; Finnema et al., 2016; Mutch et al., 2011).
SV2 is a family of proteins sharing structural similarities: they are transmembrane glycoproteins of the Major Facilitator Superfamily composed of 12 transmembrane (TM) domains (Bajjalieh et al., 1992; Feany et al., 1992; Gingrich et al., 1992). SV2 shares with other proteins of the MFS family: 12 predicted TM domains (Reddy et al., 2012; Feany et al., 1992), a basic RXGRR motif between TM2 and TM3, glycine residues in TM4 and TM5, and a sequence of prolines and charged residues following TM domains 6 and 12 (Pao et al., 1998). Nonetheless, SV2 has distinguishing characteristics compared to other MFS members: the long cytoplasmic loop between TM6 and TM7 and the glycosylated intra-vesicular loop between TM7 and TM8 (Figure 1).
6
Figure 1.
Shown is a schematic drawing of human SV2A (NCBI accession: NP_001315603) depicting the position of transmembrane domains and domains of interest. Each circle denotes an amino acid, and the orange bar the vesicle membrane. Amino-terminal residues unique to SV2A and SV2C are colored cyan. Tyrosine-based endocytosis motifs are colored yellow. Thr84 phosphorylation site is colored blue. Residues conserved in the MFS superfamily are colored green. Residues conserved in the SLC22 family are colored red. N-glycosylation sites are colored magenta. The illustration was generated using Protter tool. From Ciruelas et al., submitted.
Transporter-like proteins with some SV2-defining motifs can be found in single cell flagellates (e.g. Salpingoceca Rosetta PTSG_08752 (NCBI accession: XP_004990136)) and invertebrate animals (e.g. Drosophila SV2C-related protein CG14691). However, putative SV2 precursors lack the long intraluminal glycosylated loop and have a shorter cytoplasmic loop. While the role of these additions is not completely understood, SV2 may have acquired new functions during its evolution or even evolved into a functionally distinct class of proteins. To date, there is no functional information on the putative SV2 homologs in invertebrates, and thus bona fide SV2 is cautiously considered a protein exclusive to vertebrates. While SV2 appears
7 to be a relatively late development, divergence of the gene family occurred rapidly (Figure 2). The emergence of multiple paralogs likely provided differential regulation of SV2 expression or regulation, as has been proposed for the organic ion transporter family (Eraly et al., 2003; Ciruelas et al., submitted).
Figure 2.
Shown is a dendrogram illustrating the relatedness of SV2, SVOP and homologous proteins in invertebrates. To generate the dendrogram, Human SV2A, SV2B, SV2C and SVOP protein sequences were used in a series of NCBI BLASTP queries. The best BLASTP hit (lowest E-value) per paralog for each species was taken as a representative sequence. Protein sequences were aligned using the sequence alignment tool MUSCLE [135]. Sequence alignment was further refined using MAFFT under the Li-NSI option [136]. The phylogenetic tree was generated using the Maximum Likelihood method as implemented in ETE 3 [137]. Schematic drawings of paralogs were generated using Protter [134]. Protein sequences used for tree construction were: synaptic vesicle glycoprotein 2A [Homo sapiens] (NP_001315603); synaptic vesicle glycoprotein 2A [Mus musculus] (NP_071313); synaptic vesicle glycoprotein 2A [Rattus norvegicus] (NP_476558); synaptic vesicle glycoprotein 2A [Danio rerio]
8 (XP_696434); synaptic vesicle glycoprotein 2A [Xenopus tropicalis] (XP_012825002); synaptic vesicle glycoprotein 2B [Homo sapiens] (NP_001309966); synaptic vesicle glycoprotein 2B [Mus musculus] (NP_001347503); synaptic vesicle glycoprotein 2B [Rattus norvegicus] (NP_476555); synaptic vesicle glycoprotein 2B [Danio rerio] (XP_005161575); synaptic vesicle glycoprotein 2B [Xenopus tropicalis] (XP_004912713); synaptic vesicle glycoprotein 2C [Homo sapiens] (NP_055794); synaptic vesicle glycoprotein 2C [Mus musculus] (NP_083486); synaptic vesicle glycoprotein 2C [Rattus norvegicus] (NP_113781); synaptic vesicle glycoprotein 2C [Danio rerio] (NP_001121811); synaptic vesicle glycoprotein 2C [Xenopus tropicalis] (XP_002934873); synaptic vesicle glycoprotein 2C isoform X1 [Strongylocentrotus purpuratus] (XP_003723431); synaptic vesicle glycoprotein 2C-like [Aplysia californica] (XP_012946265); synaptic vesicle 2-related protein isoform X2 [Strongylocentrotus purpuratus] (XP_003726207); synaptic vesicle 2-related protein isoform X3 [Xenopus tropicalis] (XP_002932106); synaptic vesicle 2-related protein isoform 1 [Homo sapiens] (NP_061181); synaptic vesicle 2-related protein isoform 1 [Mus musculus] (NP_081081); synaptic vesicle 2-related protein isoform 1 [Rattus norvegicus] (NP_599231); synaptic vesicle 2-related protein [Danio rerio] (XP_005165254); CG3168, isoform A [Drosophila melanogaster] (NP_572345); CG4324, isoform A [Drosophila melanogaster] (NP_611868); Dmel_CG31272 [Drosophila melanogaster] (NP_650013); svop-1 [Caenorhabditis elegans] (NP_498960.2). From Ciruelas et al., submitted.
There are three SV2 paralogs in mammals, SV2A, SV2B, and SV2C. The three paralogs widely differ in their distribution: SV2A is expressed in nearly all neurons, SV2B is principally expressed in glutamatergic neurons, making SV2A the only paralog expressed in GABAergic neurons. SV2C expression is largely limited to striatum, midbrain and hindbrain neurons and is the primary SV2 paralog in dopaminergic neurons (Bajjalieh et al., 1994; Bragina et al., 2010; Dardou et al., 2013; Dunn et al., 2017; Grønborg et al., 2010; Janz and Südhof, 1999; © 2004 Allen Institute for Brain Science. Allen Mouse Brain Atlas. Available from: mouse.brain-map.org). The functional significance of three, very similar but non-identical SV2 genes is still not fully understood. However, all three can rescue normal neurotransmission when expressed in neurons lacking SV2 demonstrating functional redundancy (Nowack et al., 2010; Ciruelas et al., submitted).
The function of SV2 has not been fully elucidated yet. Deletion of SV2A in mice is associated with violent seizures and premature death within three weeks of birth, indicating that SV2A is fundamental for normal brain activity, while SV2B-knockout (KO) mice are viable (Crowder et al., 1999). Indeed, electrophysiological recordings of SV2A-KO hippocampal neurons showed reduced synaptic depression indicating that SV2A regulates synaptic release
9 probability (Custer et al., 2006). Notably, reduced synaptic depression was more pronounced at the beginning of a stimulus train and at lower (2Hz) rather than at higher frequencies (20Hz), suggesting that SV2 ensures reliable transmission of low-frequency spikes (Custer et al., 2006). Furthermore, while the number of docked vesicles in synapses from SV2A-KO mice is similar to wild-type, SV2A-KO neurons have reduced readily releasable pool size. Together, these results suggest that SV2 functions in the last steps of the exocytic process, after vesicle docking, in or immediately before vesicle priming (Custer et al., 2006).
It is known that SV2A is involved in synaptic endocytosis and protein trafficking: it can bind the endocytosis adaptor protein AP-2, and it is required for the correct sorting of synaptotagmin to synaptic vesicles. Such conclusion is supported from multiple lines of evidence: deletion of SV2A in hippocampal neurons resulted in reduced levels of synaptotagmin in synaptic vesicles (Yao et al., 2010), slower synaptotagmin endocytosis and synaptotagmin trapping to the presynaptic plasma membrane (Kaempf et al., 2015). On the other hand, hippocampal neurons exogenously overexpressing SV2A have increased levels of synaptotagmin (Nowack et al., 2010). All in all, these data suggest that SV2 acts as an intrinsic trafficking partner (iTRAP; Cousin, 2017) in synaptotagmin endocytosis and as a regulator of the levels of synaptotagmin in synaptic vesicles. Interestingly, SV2 and synaptotagmin levels correlate with those of synaptogyrins (Yao et al., 2010), suggesting that other synaptic vesicle proteins may be influenced by SV2.
Epilepsy
Epilepsy is a severe neurologic disorder characterized by recurrent spontaneous seizures that affects approximately 1% of the population. One-third of patients have seizures despite optimal medical treatment (Chen et al., 2017; Fiest et al., 2016) and are encumbered by stigma, neuropsychiatric comorbidities and pharmacological side effects. Therefore, it is essential to understand the molecular mechanisms of epilepsy and of anti-epileptic medications to develop new therapeutic strategies.
The notion that “occasional, sudden, excessive, rapid, and local discharge of gray matter” underlies epileptic disorders and “a convulsion is but a symptom and implies only that there is an occasional, an excessive, and a disorderly discharge of nerve tissue” dates to the seventies of the XIX century (Jackson, 1870; Jackson, 1873). However, the precise causative mechanisms of most epileptic disorders are still unclear. The leading cause of most epilepsies is an imbalance
10 between exaggerate excitation and inadequate inhibition (Symonds, 1959) that drives the increased synchronization of brain activity, i.e. the defining feature of epilepsy. Thus reducing excitation or increasing inhibition have been the mainstay of anti-epileptic therapy for many years (Rogawski and Löscher, 2004). Although the excitation/inhibition hypothesis accounts for most, not all (Khoshkhoo et al., 2017; Sessolo et al., 2015), forms of epilepsy, the molecular mechanisms for the excitation/inhibition imbalance can be diverse (Li and Kavalali, 2017; Staley, 2015). Many studies have highlighted the role of altered ionic conductance and postsynaptic receptors in the pathogenesis of epilepsy and seizures, far fewer have examined presynaptic mechanisms. Recently, considerable sequencing efforts of epileptic patients revealed mutations of several presynaptic proteins associated with epilepsy; examples include SV2A, synapsins, syntaxin 1B, SNAP25b, STXBP1/Munc18-1 and dynamin-1 (Fukata and Fukata, 2017). Some hypotheses have been proposed on how mutations of proteins widely expressed both in glutamatergic and GABAergic terminals alter excitation/inhibition and trigger epilepsy (Li and Kavalali, 2017; Medrihan et al., 2014). However, there is not a common mechanism for all presynaptic proteins.
As for SV2A, both homozygous deletion in mice and a human missense mutation lead to severe epilepsy (Crowder et al., 1999; Serajee and Huq, 2015). Moreover, altered SV2A expression has been found in epileptic patients brains and various epileptic animal models (Crèvecoeur et al., 2014; Feng et al., 2009; Ohno et al., 2009; Toering et al., 2009; van Vliet et al., 2009). This suggests that SV2A is essential for neuronal synchronization in many types of epilepsies and can be considered an “epilepsy master regulator” (Kaminski et al., 2010; Löscher et al., 2016)
Janz and colleagues proposed that increased synaptic strength at glutamatergic inputs during low-frequency repetitive stimulation may change the balance of excitatory and inhibitory activities to favor overall excitation in neuronal circuits (Janz and Südhof, 1999). However, the similar electrophysiological phenotype of glutamatergic and GABAergic SV2A/B KO neurons does not support the conclusion (Chang and Südhof, 2009). Alternatively, the preferential expression of SV2A rather than SV2B in GABAergic neurons makes inhibitory neurotransmission more sensitive to SV2A deletion. The hypothesis is also corroborated by recent findings in animal carrying a point mutation in SV2A (L174Q) that showed impaired GABAergic release and intact excitatory neurotransmission (Tokudome et al., 2016).
11 Levetiracetam
SV2A serves as a novel receptor for anti-epileptic drug levetiracetam (Lynch et al., 2004). Levetiracetam is the first member of a new class of anti-epileptic drugs that now includes Brivaracetam, Seletracetam, and Padsevonil (Klitgaard et al., 2016; Leclercq K. et al., 2017; Löscher et al., 2016). Approved by FDA in 1999 as an adjunct therapy for partial and generalized epilepsy, levetiracetam is now used to treat a broad range of nervous system disorders linked to nervous system hyperexcitability (Oulis et al., 2009; Sanchez et al., 2012; Smith‐Hicks et al., 2007; Wong et al., 2011).
Levetiracetam was developed in 1977 as a nootropic drug, but it was devoid of any cognitive enhancing effect. It was later found that levetiracetam has a broad spectrum of anti-epileptic efficacy in animal models of acquired and genetic epilepsy, but it was not effective in models of acute seizure induction. Such unique clinical profile suggested a novel mechanism of action for levetiracetam (Löscher et al., 2016). Indeed, while most antiepileptic drugs affect ionic channels or neurotransmitter receptors and transporters, Lynch and colleagues demonstrated that SV2A is necessary and sufficient for levetiracetam’s binding (Lynch et al., 2004). The necessity for SV2A in the pharmacodynamics of levetiracetam is supported by the correlation between SV2A-binding affinity and anti-seizure potency in epilepsy models (Kaminski et al., 2008) and by the reduced anti-seizure activity of levetiracetam in heterozygous SV2A KO (SV2A+/−) mice (Kaminski et al., 2009).
A unique feature of levetiracetam action is a requirement for synaptic activity for the effect to manifest. This is attributed to the need for SV2A exposure at the plasma membrane to allow drug binding (Meehan et al., 2011, 2012; Yang and Rothman, 2009). This interpretation is supported by the observation that triggering intense synaptic vesicle turnover after drug exposure disrupts, or “washes out” the effect of levetiracetam (Yang et al., 2015). However, considering levetiracetam’s good membrane permeability (Nicolas et al., 2016), the exo-endocytosis cycle may not be required for levetiracetam’s binding. Other studies proposed that levetiracetam binds an intraluminal domain of SV2A (Correa-Basurto et al., 2015) that could explain the “unloading” effect observed by Meehan and colleagues (Meehan et al., 2011). Alternatively, levetiracetam may require a cycle of vesicle retrieval and re-priming and by this means may affect the recycling pool of vesicles but not already primed vesicles. This hypothesis is consistent with the bi-exponential profile of FM1-43 destaining observed in levetiracetam-treated neurons that suggested two vesicular pools with different sensitivities to levetiracetam. It is also consistent with SV2’s role in synaptotagmin trafficking to synaptic vesicles (Yao et
12 al., 2010). Thus the role of SV2A in modulating synaptotagmin expression and trafficking is a potential site of levetiracetam action (Ciruelas et al., submitted).
In patch-clamp experiments, levetiracetam applied to hippocampal slices decreased both excitatory (EPSC) and inhibitory postsynaptic currents (IPSC; Meehan et al., 2011, 2012); the analysis of the same experiments suggested that levetiracetam decreases synaptic transmission by reducing the readily releasable pool of synaptic vesicles (Meehan et al., 2011). Further studies indicated that the reduction of the readily releasable pool is due to faster manifestation of supply rate depression (i.e. the trafficking-dependent decrease of the rate at which new vesicles are supplied to replenish the readily releasable pool from reserve stores; García‐Pérez et al., 2015) and increased short-term depression (Yang et al., 2015).
Notwithstanding SV2A is expressed in all synaptic terminals, recent studies indicated that levetiracetam may differentially affect excitatory and inhibitory neurotransmission. In fact, in vivo measurements revealed a selective increase in extracellular GABA content induced by levetiracetam in kindled animals (Pichardo Macías et al., 2017). Furthermore, levetiracetam’s effects on IPSC require lower doses and shorter incubation time than its effects on excitatory EPSC (Meehan et al., 2012). A more potent effect on inhibitory transmission may result from the fact that most GABAergic neurons express only SV2A, and thus levetiracetam action is not “diluted” by the presence of SV2B or SV2C, which are not affected by levetiracetam. Alternatively, on the basis of its activity-dependency, levetiracetam could preferentially affect GABAergic neurons because of their higher tonic activity (Hayashi et al., 2008; Meehan et al., 2012). Determining whether SV2A-targeted drugs produce more pronounced effects on inhibitory vs excitatory neurotransmission in diseased neuronal circuits will provide crucial information in refining SV2-targeted therapies (Ciruelas et al., submitted).
Besides, the mechanism of action of levetiracetam at the molecular level is not well understood. One possibility is that levetiracetam affects the protein-protein interactions of SV2A and thus changes the composition of synaptic vesicles. Indeed, increased levels of SV2 and accumulation of preassembled SNARE complexes are present in hippocampal synaptosomes (detached nerve terminals) for one year after kindling. Levetiracetam administration during kindling prevented SNARE accumulation and SV2 increase, but no effect was observed on SV2 levels in non-kindled rats (Matveeva et al., 2007).
13
Aim of the research
In order to gain understanding of levetiracetam action, we asked two main questions: 1. Whether a chronic levetiracetam treatment induces changes in the expression of
synaptic vesicle proteins, in line with the emerging notion that presynaptic proteins are potential therapeutic targets for epilepsy and other neurological diseases.
2. Whether levetiracetam modulates the protein-protein interactions and trafficking function of SV2A to regulate synaptic vesicle composition. To this end, we developed and validated a new approach to isolate newly endocytosed vesicles. Furthermore, we tested the hypothesis that SV2B can mitigate the effects of levetiracetam.
We believe that a deeper understanding of the molecular action of levetiracetam will provide fundamental information for designing new therapeutics and may enlighten the enigmatic biology of SV2.
14
Methods
Animals and Treatment
Adult male Sprague-Dawley albino rats (170–200 g; Envigo RMS Srl, Udine, Italy) were used for RT-PCR and western Blot analysis. Their care and handling were approved by the local ethical committee for animal research. All experimental procedures involving animals and their care were carried out in accordance with National laws and policies (D.L. n. 26, March 14, 2014) and with the guidelines established by the European Community Council Directive (2010/63/UE) and were approved by the local authority veterinary services. Animals were kept under a dark-light cycle of 12 hours and permitted food and water ad libitum. Rats were randomly divided into two groups. Animals of the first group were administered daily intraperitoneal (i.p.) injections of levetiracetam (54 mg/kg; Keppra, UCB Pharma, Braine-l’Alleud, Belgium) dissolved in physiological saline at a concentration of 10 mg/ml; those belonging to the second group received the vehicle (physiological saline; 5.4 ml/kg) i.p. (Ueda et al., 2007). All animals received i.p. injections each morning between 09:00 and 11:00; they were sacrificed on the 14th day, 2 hours after having received the last i.p. injection.
SV2A+/+/ SV2B-/- (SV2B-KO; Custer et al., 2006) mice, used for newly recycled vesicles analysis and GST protein-protein interaction assay, were reported previously. All animals were 99.99% C57BL/6. The animal protocol was reviewed and approved by the Institutional Animal Care and Use Committee of the University of Washington.
Reverse Transcription-Polymerase Chain Reaction (RT-PCR)
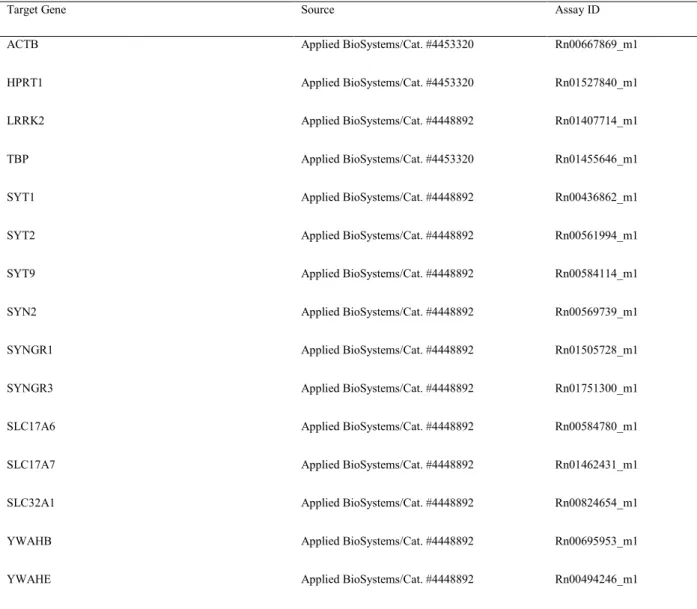
Levetiracetam-treated and control rats were anesthetized with chloral hydrate (300 mg/kg i.p.) and decapitated, cerebral neocortex and hippocampus were quickly separated. Total RNA was extracted from whole hippocampus and cerebral neocortex after homogenization using TRIZOL reagent (Invitrogen, Milan, Italy), purified, digested with ribonuclease-free deoxyribonuclease and concentrated using RNeasy Micro kit (Qiagen, Milan, Italy) according to the respective manufacturer’s instructions. For determination of mRNA levels, 1 μg of RNA was reverse-transcribed with a High-Capacity cDNA RT Kit with RNase Inhibitor (Applied BioSystems, Foster City, CA, United States) in a total volume of 20 μl. Real-time gene expression was analyzed in duplicate by using TaqMan Gene Expression Assays (Table 3) and Master Mix TaqMan (Applied BioSystems, Foster City, CA, United States). Reactions were carried out in an ABI 7300 system (Applied BioSystems, Foster City, CA, United States) using
15 50 ng of RNA in a final reaction volume of 10 μl and the following thermal cycle protocol: initial incubation at 95°C 10 minutes, followed by 40 cycles of 95°C 15 seconds and 60°C 20 seconds. Technical duplicates were run for all samples and no reverse transcriptase and no template controls were included in all experiments. Stability comparisons of three candidate reference genes (TBP, β-actin and HPRT-1) were separately conducted for hippocampus and neocortex with the NormFinder algorithm (Andersen et al., 2004). The geometric mean of the most stable pair of genes was used as normalization factor for each sample. Relative mRNA expression was determined by the ΔCt method (2-ΔCt).
Western Blot (WB)
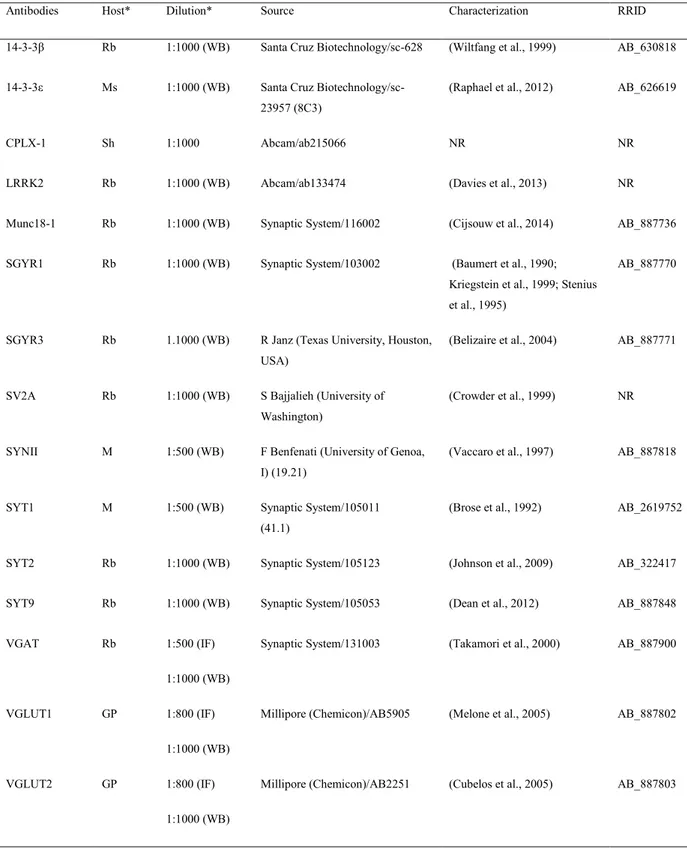
Levetiracetam-treated and control rats were anesthetized with chloral hydrate (300 mg/kg i.p.) and decapitated, and cerebral neocortex and hippocampus were quickly separated. Homogenization and crude synaptic plasma membrane preparation were carried out as described (Danbolt et al., 1990). Western blot experiments were carried out on supernatant of the first 1000 g centrifuge (S1, Figure 3), containing whole tissue protein content except crude nuclear fraction, blood and other debris (Danbolt et al., 1990; Xu et al., 2013) and on crude membrane synaptic fractions (P3, Figure 3; Danbolt et al., 1990). Bio-Rad Protein Assay (Bio-Rad Laboratories GmbH, Munchen, Germany) and a Beckman DU 530 spectrophotometer (Beckman Coulter, Fullerton, CA, United States) were used to determine the total amount of protein in each homogenate (3–4 measurements per homogenate). A standard curve with 2, 4, 6, 8, and 10 mg of bovine serum albumin (A4503, Sigma Chemicals, St. Louis, MO, United States) was drawn for each dosing run. As housekeeping proteins (such as α-actin and β-tubulin) are sensitive to experimental treatments (particularly to pharmacologic treatments) and to diverse physiological conditions, and have therefore some limitations as internal standards (Ferguson et al., 2005), 3–6 measurements were made for each brain region of each animal. To minimize procedural variables, homogenates from treated and control animals were loaded onto the same gel (Bragina et al., 2006). For quantitative analysis, we drew standard curves of increasing concentration of total protein from controls to define a linear range for immunoblot densitometric analysis (Bragina et al., 2006); for optimal resolution, western blotting studies were performed in crude synaptic membranes with 7 μg of total protein for each antigen, except for VGLUT2 studies in hippocampal samples and for LRRK2 in P3 of both hippocampus and neocortex, where 15 μg of total protein were used because of the poor antigen expression. Aliquots of crude membrane fraction (P3) or first centrifuge supernatant (S1) from treated and
16 control animals were subjected to SDS-PAGE and separated proteins were electroblotted onto nitrocellulose filters using Trans-Blot TurboTM Transfer System (Bio-Rad, Hemel Hempstead, United Kingdom). To verify loading and transfer efficiency, nitrocellulose filters were visualized with 0.2% (w/v) of Ponceau S stain (Sigma, p-3504) in 3% trichloroacetic solution for 1 minute; filters showing dishomogeneity were discarded (Bragina et al., 2006). Nitrocellulose filters selected were finally probed with primary antibodies at dilutions as reported in Table 1. After exposure to appropriate secondary antibodies (Table 2), bands were visualized by Bio-Rad Chemidoc and Quantity One software using the SuperSignal West Pico (Rockford, IL, United States) chemiluminescent substrate (Bragina et al., 2006). Quantitation of immunoreactive bands were performed using Analyze gels function of ImageJ software (v. 1.48, NIH).
Figure 3.
Diagram showing preparatory steps for western blotting samples (S1 and P3), according to Danbolt et al. (1990). The tissue was homogenized in about 10 volumes of homogenization buffer and centrifuged (10 minutes, 1000 g, 4°C). The pellets (P1) were discarded. The combined supernatants (S1) were centrifuged again (20 minutes, 27000 g, 4°C), and the pellets (P2) were suspended in about 10 volumes of hypotonic buffer and centrifuged (20 minutes, 27000 g, 4°C). The pellets (P3) were resuspended in 10 volumes of homogenization buffer in order to eliminate the hypotonic buffer and centrifuged (20 minutes, 27000 g, 4°C). The final pellets (P3) were resuspended in appropriate volume. From Marcotulli et al., 2017.
17 Network Analysis
We identified the interactions of the analyzed genes and proteins from eight databases: mentha; BioGrid; InnateDB; EBI-GOA-nonIntAct-MINT; Reactome-Fis; UniProt; BAR; InnateDB. Interactional data were merged, and the interaction network was constructed using Cytoscape Software 3.4.0, redundant interactions were eliminated.
Newly recycled vesicle isolation
Recycling vesicles were isolated from wild-type or SV2B KO mice using differential centrifugation and Percoll™ density separation. Brain tissue was homogenized in HBS buffer [10 mM HEPES, 142 mM NaCl, 2.4 mM KCl, 1 mM MgCl2, 5 mM D-Glucose pH 7.4] with 1 mM EGTA and 1x Roche protease inhibitor. Three brains were used for each biological replicate. After homogenization, it was spun at 1000 g for 10 minutes. The supernatant was loaded onto a Percoll™ (GE Healthcare Lifescience) step gradient containing (vol/vol) 10%, 24%, 27%, and 31% filtered Percoll™ diluted in 1x HBS. The gradient was then centrifuged in a Ti-40 rotor for 7 minutes at 22250 g and 4°C. The interface between 24% and 27% (corresponding to the synaptosomal fraction) was collected and diluted in HBS (containing 1 mM EGTA) and centrifuged at 17000 g for 15 minutes. The synaptosomes (pellet) were resuspended in HBS and centrifuged again at 17000 g for 15 minutes. The synaptosomes were resuspended in HBS containing 1 mM Ca2+ and 5 mM K+ and allowed to recover for 10 minutes at 35°C and incubated with 100 mM Dynole® 34-2 (abcam, ab120463). After Dynamin incubation, synaptosomes were treated with 300 µM levetiracetam or water. All the solutions used for the stimulation and recovery of synaptosomes contained 100 µM Dynole® 34-2. A final concentration of 300 µM levetiracetam was manteined for the levetiracetam-treated sample.
Exocytosis is induced by addition of 60 mM KCl for 5 minutes in the presence of 100 µM Dynole® 34-2. Excitation was halted by dilution of K+ to a final concentration of 3 mM, and synaptosomes incubated for 30 minutes. Following the recovery step, synaptosomes were diluted in 10 volumes of ice-cold hypotonic buffer (10 mM HEPES) to induce swelling and subjected to homogenization. Synaptosomes were homogenized for 3 strokes in a Teflon/glass homogenizer and incubated 30 minutes at 4°C. Synaptosomal lysis solution was further homogenized for 3 strokes. Recycling intermediates (recycling vesicles trapped on the plasma membrane) were separated from membrane debris and reserve vesicle pool by
18 ultracentrifugation in a JA25.50 rotor for 25000 g for 20 minutes. The pellet was resuspended in HBS buffer and treated with recombinant dynamin-1 and 1 mM GTP to allow completion of endocytosis and scission of vesicles for 1 hour at 35°C. Endocytosed vesicles were isolated by centrifugation at 15000 g for 30 minutes at 4°C. The supernatant containing endocytosed vesicles was collected and analyzed by MS-based proteomics (~ 150 µL of supernatant were obtained for each preparation, with 8 µL enabling the detection and quantification of ~ 1000 proteins by MS-based proteomics; Figure 4).
Figure 4.
Schematic of the isolation of newly recycled synaptic vesicles from mouse brain. From Marcotulli et al., in preparation.
19 Dynamin purification
Lenti-X™ HEK 293T cells were transfected by calcium phosphate precipitation with 60 μg of dynamin-His-MBP cDNA/15 cm dish. After 24 hours, cells were returned to growth medium (DMEM) for 24 hours before harvesting. Cells were resuspended in lysis buffer (20 mM HEPES pH 7.4, 250 mM NaCl, 30 mM NaCl, 1% Triton X-100, 1 mM EDTA, 1 mM EGTA) containing protease inhibitor (cOmplete™, Roche), sonicated and centrifuged at 15000 g for 20 minutes. The supernatant was rotated with amylose resin (1 ml; New England Biolabs) for 1 hour at 4°C. The beads coupled to dynamin-His-MBP were washed with wash buffer (250 mM, NaCl 20 mM HEPES, 1 mM DTT, pH 7.4) and incubated overnight with ~ 40 μg of TEV protease in incubation buffer (20 mM NaCl and 20 mM Tris-HCl, pH 7.4). Recombinant 6X HIS-TEV (Tobacco Etch Virus protease) was produced in bacteria and purified on nickle resin. After incubation with TEV, amylose beads were separated from supernatant containing purified dynamin by centrifugation (1000 g).
Protein quality was checked by western Blot, and protein concentration was quantified by Bradford assay. Purified protein with 0.1 M DDT was snap frozen in liquid nitrogen and stored at -80°C.
Malachite Green Assay
GTPase activity of dynamin was assayed as in Leonard et al. (2005). Briefly, 40 µg of purified dynamin were incubated with 1 mM GTP for 90 minutes at 37 °C in 20 mM HEPES (pH 7.4), 150 mM KCl, 2 mM MgCl2, and 1 mM DTT. Reactions were stopped by diluting 20 μL of the sample in 0.25 M EDTA (final concentration). Samples were then added to 150 μL of malachite green stock solution (1 mM malachite green and 10 mM ammonium molybdate in 1 N HCl), and the absorbance at 620 nm was determined and compared to a standard curve of free phosphate (from 5–100 μM Pi). The absorbances of matched negative controls without dynamin were subtracted from the samples’ absorbances to control for spontaneous GTP breakdown.
LC/MS mass spectrometry and data analysis
Proteins of newly recycled vesicles were acetone precipitated and resuspended in 8 M urea buffer (8 M urea, 100 mM Tris, pH 8). Resuspended proteins were reduced and alkylated with 1 mM tris(2-carboxyethyl)phosphine (TCEP) and 2 mM chloroacetamide (CAM).
20 After reduction and alkylation, proteins were diluted with 100 µL (same as initial volume) of 50 mM Tris, pH 8.0 and digested with 1 µg of Lys-C (125-05061, Wako) for 2 hours at 37°C. The solution was further diluted by adding 200 µL (2 times of initial volume) of 50 mM Tris and subsequently digested with 1 µg of Pierce™ Trypsin Protease, MS Grade (90058, Thermo Fisher Scientific) overnight at 37°C. The digested proteins were acidified with trifluoroacetic acid (1% final concentration) and desalted with StageTip (Rappsilber et al., 2007).
For LC/MS analysis, 3 injections were performed for each sample to increase the sequence coverage. Desalted peptides were loaded to self-pulled 360 µm OD x 100 µm ID 20 cm column with a 7 µm tip packed with 3 µm Reprosil C18 resin (Dr. Maisch, Germany). Peptides were analyzed in 120 minutes, 10% to 35% acetonitrile gradient in 0.1% acetic acid at 300 nL/min nanoLC-MS (Thermo Dionex RSLCnano) on an Orbitrap Elite. Orbitrap FTMS spectra (R = 30 000 at 400 m/z; m/z 350–1600; 3e6 target; max 500 ms ion injection time) and Top15 data dependent CID MS/MS spectra (1e4 target; max 100 ms injection time) were collected with dynamic exclusion for 30 s and an exclusion list size of 50. The normalized collision energy applied for CID was 35% for 10 ms.
Proteins were identified and quantified using MaxQuant (Cox and Mann, 2008). Mass spectra were searched against UniProt mouse reference proteome downloaded on July 06th, 2016 using MaxQuant v1.5.7.4. Detail MaxQuant settings were: Under “Group-specific parameters” tab, “Label-free quantification”, in “Global parameters” tab, under “General”, “Match between run” box was checked and under “Label-free quantification”, the “iBAQ” boxes were checked. Other settings were kept as default.
MaxQuant output was analyzed using Perseus (Tyanova et al., 2016) and R environment. Protein intensities were log2 transformed and Z-score normalized. Samples were then annotated as treatment or sample group and rows with less 3 valid values in at least one group were filtered. Missing values were then replaced by imputation from normal distribution with 2.1 down-shift. Statistical significance was evaluated by two-tailed Student’s t-test, and a permutation-based FDR was used to adjust the p-value.
Gene Ontology (GO) analysis and overrepresentation test
The possibility that certain cellular compartments were enriched in supernatant from the newly recycled vesicle preparation (see above) was tested by comparing the set of proteins that
21 meet the selection criteria with the entire mouse database using the statistical overrepresentation test (Boyle et al., 2004; Yu et al., 2012). GO biological process was used as the Annotation Dataset. The Bonferroni correction was applied for multiple testing. All the analysis process was conducted in R environment using the ClusterProfiler package (Yu et al., 2012).
GST protein-protein interaction assay
Pull-down assays were carried out as in Schivell et al. (1996). Briefly, cDNA containing the glutathione-S-transferase (GST)-synaptotagmin (C2A and C2B domains only) was transfected in BL21 E. Coli by electroporation. Bacteria were grown overnight at 37°C and protein production was induced the next day with addition of 100 µM isopropyl-1-thio-β-D-galactopyranoside for 5 hours. Bacteria were resuspended in phosphate-buffered saline, 2 mM EDTA, 0.1% 2-mercaptoethanol, and 200 µM PMSF and lysed by sonication. The lysate was incubated with 0.5% Tween-20 for 30 minutes, followed by centrifugation. GST-synaptotagmin fusion protein was isolated by glutathione-agarose chromatography, separated by SDS-PAGE, and checked using Coomassie Blue staining. Brains from wild-type or SV2A+/+/SV2B-/- mice brains were used for each replicate study. Each brain was separately homogenized in ice-cold HBS buffer containing 1 mM EGTA. The brain homogenate was centrifuged at 1000 g for 10 minutes to remove nuclei and undisrupted cells (S1). One milligram of S1 was solubilized in equal volumes of solubilization buffer [20 mM HEPES, 1 mM EGTA, 95 mM KOAc, 2% Triton X-100 with added 3 mM CaCl2 or 1 mM EGTA and 300 µM levetiracetam or water] for two hours on ice then centrifuged at 19000 g for 30 minutes at 4°C. The supernatant was incubated with 100 µg of GST-synaptotagmin fusion protein bound to glutathione-agarose beads for 1 hour at 4°C with 2 mM or 1mM EGTA and 300 µM levetiracetam or water. After binding, beads were washed 3 times with 1 ml of the same solubilization buffer. Proteins were eluted in 8 M urea buffer (8 M urea, 100 mM Tris, pH 8), separated by SDS-PAGE, and transferred to nitrocellulose. GST-synaptotagmin fusion protein was visualized by Ponceau staining. Membranes with homogeneous amounts of GST-synaptotagmin across experimental conditions were probed with primary antibodies anti-complexin1 and anti-SV2A (Table 1). After exposure to appropriate secondary antibodies (Invitrogen goat anti-rabbit G-21234, and goat anti-mouse G-21040; Jackson donkey anti-sheep 713-035-003), bands were visualized using Bio-Rad Chemidoc with ECL chemiluminescent substrate (BioRad Clarity™). Immunoreactive bands were quantified using ImageLab software (BioRad).
22 Statistical Analysis
Statistical significance was evaluated by the non-parametric Mann–Whitney U-test using the GraphPad Prism Software (v. 6.0; GraphPad Software, San Diego, CA, United States), unless otherwise specified.
23
Results
Levetiracetam regulates levels of several synaptic vesicle proteins
To verify the hypothesis that levetiracetam modulates synaptic vesicle proteins levels, rats were subjected to a chronic levetiracetam treatment and changes in the expression of synaptic vesicle proteins were measured. Non-epileptic animals were used to exclude any bias related to the variability of expression of SV2 (Ohno et al., 2009, van Vliet et al., 2009) and other presynaptic proteins (Yamagata et al., 1995; Li et al., 2002) in epileptic models, that could alter levetiracetam’s effects.
We first measured the expression of vesicular proteins in neocortical crude membrane synaptic fractions (termed P3; Danbolt et al., 1990; Figure 3) of control and levetiracetam-treated animals (Figures 5A, light blue). Quantitative analysis of independent samples showed that levetiracetam treatment affected neither SV2A nor SV2B expression. Thus, levetiracetam does not act by directly modifying the expression of its receptor; and its action does not induce secondary or compensatory changes in SV2A or SV2B levels. On the contrary, expression of synaptotagmins was significantly reduced by levetiracetam (p < 0.05); in particular, levels of synaptotagmin 1, synaptotagmin 2, and synaptotagmin 9 was 77.10% ± 4.23%, 85.48% ± 3.22%, and 79.43% ± 4.27% of controls, in the order. Significant changes following treatment were also observed for synapsin II (73.79% ± 1.62%), SGYR1 (76.27% ± 3.68%), SGYR3 (73.92% ± 4.56%), VGLUT1 (68.81% ± 5.24%), VGLUT2 (82.60% ± 5.47%), and VGAT (77.33% ± 4.77%) (Figures 5A, light blue and blue). Levels of Rab3a, Rab3c, VAMP1, VAMP2, synaptophysin I, and synapsin I were similar in both groups (Figures 5A, light blue), indicating that levetiracetam-induced changes are specific for some, not all, vesicular proteins. We also showed that in levetiracetam-treated animals, expression of the major plasma membrane proteins participating in neurotransmitter release (i.e., syntaxin 1A, syntaxin 1B, SNAP23, SNAP25, and Munc18-1) were unchanged compared to controls (Figures 5A, green), an observation that highlights the central role of synaptic vesicles in levetiracetam’s action (Marcotulli, 2015; Marcotulli et al., 2017). Western blot analysis of the same vesicular and plasma membrane proteins was performed in hippocampal P3; results showed that levetiracetam treatment did not affect their expression (Figure 5B; Marcotulli et al., 2017).
24
Figure 5.
Levels of presynaptic proteins in crude synaptic membrane fraction (P3) of rat neocortex (A) and hippocampus (B) in levetiracetam-treated animals (vesicular proteins, light blue; vesicular transporters,
blue; and plasma membrane proteins, green). Values are expressed as percentage of controls (dotted
lines)1. *P<0.05 (Mann-Whitney); n= 4 to 8 levetiracetam (LEV), n= 4 to 8 control (CTR). Immunoblot
of presynaptic proteins in P3, neocortex (C). SYT, synaptotagmin; SYN, synapsin, SYP, synaptophysin; SGYR, synaptogyrin; STX, syntaxin. From Marcotulli et al., 2017.
Levetiracetam regulates protein levels by a post-transcriptional mechanism
To determine whether levetiracetam effects depended on transcriptional, translational or post-translational mechanisms, we measured mRNA levels for levetiracetam-regulated proteins and analyzed western blot of the same proteins in whole cellular proteins content devoid of nuclear fractions (termed S1; Danbolt et al., 1990; Xu et al., 2013). In both neocortex and hippocampus of levetiracetam-treated animals, mRNAs levels (Figures 6A and C) and S1
1 Since Mann-Whitney test was used to compare levetiracetam-treated and control animals, box-plots showing
medians, Q1 and Q3 were used. Showing mean and S.E.M. could be misleading when using nonparametric statistics (Weissgerber et al., 2015).
25 proteins expression (Figures 6B and D) were similar in the experimental and control groups, suggesting that levetiracetam-induced changes are in all likelihood due to synaptic terminal-specific post-transcriptional mechanisms.
Figure 6.
Levels of mRNA coding for levetiracetam-regulated proteins in rat neocortex (A) and hippocampus (C) of levetiracetam-treated animals (vesicular proteins, light blue; vesicular transporters, blue). Values are expressed as percentage of controls (dotted lines). *P<0.05 (Mann-Whitney); n= 8 levetiracetam (LEV), n= 8 control (CTR). Levels of levetiracetam-regulated proteins in total proteins fraction (S1; excluding nuclear and debris) of rat neocortex (B) and hippocampus (D) of levetiracetam-treated animals (vesicular proteins, light blue; vesicular transporters, blue). No significant effect of levetiracetam was observed on mRNA and total proteins levels. Values are expressed as percentage of controls (dotted lines). Outliers are squares. *P<0.05 (Mann-Whitney); n= 4 to 8 levetiracetam, n= 4 to 8 control. From Marcotulli et al., 2017.
Next, to gain a deeper insight into levetiracetam’s effects, we constructed a network of protein-protein interactions for the studied proteins. The analysis of the resulting network
26 (Figure 7A) identified LRRK2 (leucine-rich repeat kinase 2, a large multidomain protein that includes a central catalytic tridomain with GTPase and kinase activities surrounded by a series of potential protein-protein interaction domains; Martin et al., 2014), 14-3-3β and 14-3-3ε (14-3-3s are soluble proteins abundantly expressed in brain and involved in signal transduction, apoptotic, checkpoint control, and nutrient-sensing pathways by altering the subcellular localization of numerous binding partners; Aghazadeh and Papadopoulos, 2016) as SV2A interactors potentially capable of contributing to levetiracetam’s effects. Therefore, we used RT-PCR and western blot analysis to study mRNA and protein levels in neocortex. Results showed that mRNA levels coding for LRRK2 and 14-3-3s were not modified by levetiracetam treatment (Figure 7B). Western blot studies showed that 14-3-3β and ε levels were not changed in S1 and P3 samples; and that LRRK2 protein levels were upregulated by levetiracetam (up to 130.08% ± 9.35%) in S1 but not in P3 samples (Figures 7B and D), in line with its cellular localization (Martin et al., 2014). These findings indicate that LRRK2 up-regulation is mediated by a post-transcriptional mechanism. Finally, on a network re-analysis which included LRRK2 and 14-3-3s, we observed that LRRK2 never clustered with levetiracetam-regulated proteins, while it strikingly clustered with most non-regulated presynaptic proteins, suggesting that LRRK2 plays a crucial role in defining the pattern of levetiracetam’s effects (Figure 7E; Marcotulli et al., 2017).
27
Figure 7.
The network of interactions of the presynaptic proteins investigated in the present study modeled from eight protein-protein interaction (PPI) databases (A). Nodes considered to be not relevant to our analysis or redundant are not shown. Regulated proteins, grey nodes; unregulated proteins, cyan nodes; proteins not studied, white nodes; SV2A node and edges, pink. RT-PCR of LRRK2 and 14-3-3s in rat neocortex (B) and hippocampus (C) of levetiracetam-treated animals. Levels of LRRK2 and 14-3-3s proteins in S1 samples of rat neocortex (B) and hippocampus (C) in levetiracetam treated animals. Western blot showing levels of LRRK2 and 14-3-3s in P3 samples of rat neocortex (B, D) and hippocampus (C) in levetiracetam treated animals. Values are expressed as percentage of controls (dotted lines). *P<0.05 (Mann-Whitney); n= 4 to 8 levetiracetam, n= 4 to 8 CTR. Network of analyzed PPI, querying for all proteins, including LRRK2, 14-3-3ε and 14-3-3β (E). Nodes considered to be not relevant to our analysis or redundant are not shown. Regulated proteins, grey nodes; unregulated proteins, cyan nodes; proteins not studied, transparent nodes; SV2A node and edges, pink; LRRK2 edges, black; modified proteins links to and from SV2A first degree interactors, thick grey edges. From Marcotulli et al., 2017.
28 A method to isolate newly recycled vesicles
Synaptic protein trafficking and endocytosis are crucial determinants of synaptic vesicle composition (Cousin, 2017). Since synaptotagmin’s trafficking is regulated by SV2A, and levetiracetam changed synaptotagmin levels (Nowack et al., 2011, Marcotulli et al., 2017), we asked whether levetiracetam remodels the composition of synaptic vesicles by affecting SV2A trafficking function and if trafficking-related changes are specific to synaptotagmin.
To this end, the isolation of a single endocytosis event is required to exclude confounding factors. If levetiracetam regulates synaptic vesicles composition by altering the endocytosis of SV2A-interacting proteins, changes in vesicles stoichiometry should be seen in the pool of vesicles continuously entertaining the exo-endocytosis cycle. Previous works estimated the recycling pool to be approximately 10-20% of the total vesicles in a synaptic terminal (Schikorski and Stevens, 2001, Alabi and Tsien, 2012; Rizzoli and Betz, 2005). As traditional synaptic vesicles preparations (Ahmed et al., 2013) cannot distinguish between different vesicle pools, it would be difficult to quantify differences affecting only 10-20% of vesicles. For this reason, an approach to isolate newly endocytosed vesicles from synaptosomes (pinched off nerve terminals) was developed (Figure 4; Marcotulli et al., in preparation).
To obtain sufficient quantities of newly formed vesicles, we developed a protocol that employs inhibitors of dynamin, a GTPase that mediates vesicle fission at the end of the endocytic process (Watanabe et al., 2013). Inhibiting dynamin traps recycling vesicles at the plasma membrane. Hypertonic sucrose has been shown to deplete the recycling pool of vesicles (Rosenmund and Stevens, 1996), so we used a Percoll™ density gradient instead of the traditional sucrose gradient to isolate synaptosomes. Synaptosomes are subjected to intense stimulation in the presence of Dynole® 34-2 to trap endocytosing vesicles. Synaptosomes are ruptured and plasma membrane containing trapped vesicles (termed recycling intermediates) are purified away from free vesicles and reserve pool vesicles by centrifugation. Vesicle fission is then induced by incubating purified recycling intermediates with GTP and recombinant dynamin. Newly formed vesicles are separated from plasma membrane by centrifugation.
To test the performance of this strategy before proceeding with further experiments, the main steps of our protocol were verified. The quality of synaptosomes was evaluated by western blot of synaptic vesicle protein (synaptophysin) and plasma membrane protein (Na+/K+ ATPase) in sequential density gradient fractions (Figures 8A and B).
29 GTPase activity of recombinant dynamin-1 was demonstrated by its ability of dephosphorylating GTP, using a malachite green based colorimetric assay (Figure 8C). Synaptotagmin was used as a proxy for synaptic vesicles in validating our approach. The 6-fold increase of synaptotagmin in the supernatant observed with addition of GTP/Mg2+ alone suggests that some vesicle can be released in this condition (Figure 8D). This is probably because Dynole® 34-2 interacts with the nucleotide binding region of dynamin (Hill et al., 2009). Addition of dynamin to recycling intermediates (see Methods) almost doubled the yield (Figure 8D).
Figure 8.
(A) Western blot of the Na+/K+ ATPase α6 subunit and the synaptic vesicle protein synaptophysin across Percoll® gradient fractions for synaptosome preparation. 1% of each fraction was used for western blotting. (B) Quantification of total protein per fraction showing a peak of synaptic vesicle proteins (synaptophysin, Syp) in fraction 6. (C) GTPase activity of purified dynamin evaluated by malachite green assay after 90 minutes incubation. Pi released/time scale linearly with GTP concentration. Absorbance of matched control reactions without dynamin were subtracted to calculate
30 the released Pi. (D) Western blot of the synaptic vesicle protein synaptotagmin in supernatant from the last step of newly recycled synaptic vesicle preparation. Adding recombinant dynamin and 1mM GTP to the preparation increased synaptotagmin concentration in supernatant by ≈12 fold. From Marcotulli et al., in preparation.
We used an MS-based label-free proteomic approach to identify and quantify proteins in the supernatant (Figure 4). A gene ontology over-representation analysis (Boyle et al., 2004) of the identified proteins demonstrated that the preparation is highly enriched in synaptic vesicle proteins. Indeed, biological processes involving synaptic vesicle proteins (i.e. vesicle localization (GO: 0051648), vesicle-mediated transport in synapse (GO: 0099003), signal release from synapse (GO: 0099643), regulation of synaptic vesicle cycle (GO: 0098693)) were significantly over-represented in the supernatant (Figure 9). On the other hand, VAMP7, a marker of the reserve pool (Hua et al., 2011), was not identified by MS analyses 2.
2 Failure to identify VAMP7 in 12 out of 12 replicates (n = 6) has been considered an indicator of recycling vesicle
pool enrichment. Label-free MS-based proteomics is increasingly recognized as a highly sensitive method of protein detection and quantification (Sun et al., 2018). Also, VAMP7 had been successfully identified with similar methods (Han et al., 2014). Although complete absence of VAMP7 cannot be firmly demonstrated by MS-based proteomics, it is beyond the scope of our preparation.
31
Figure 9.
Gene Ontology (GO) over-representation test (Boyle et al. 2004) of proteins identified in supernatant by MS-based proteomics. The ten most represented GO terms are shown. Terms representative of synaptic vesicle functions are highly enriched in supernatant. Analysis was performed using the Bioconductor package ClusterProfiler; n=2. From Marcotulli et al., in preparation.
Newly recycled vesicles treated with levetiracetam isolated from SV2B-KO mice contain less complexin 1
Unpublished results obtained by the Bajjalieh’s group showed that levetiracetam impairs synaptotagmin endocytosis in SV2B-KO, but not in wild-type neurons (Ciruelas et al., in preparation)
In view of the effect of levetiracetam on synaptogamin endocytosis observed in SV2B-KO neurons but not in wild-type, newly recycled vesicles’ proteome from SV2B-KO mice were analyzed.
To determine if levetiracetam affects the stoichiometry of recycling vesicles, newly endocytosed vesicles treated with and without 300 μM levetiracetam were subjected to proteomic analysis to quantify differences in protein composition.
Three biological replicates obtained from SV2B-KO mice brains were analyzed. In total 1961 proteins were identified. Quantification of proteins in levetiracetam-treated and control samples revealed that levetiracetam reduced to undetectable levels the amount of complexin-1 associated with newly recycled vesicles and increased the amount of acyl-protein thioesterase 1 (APT1/lypla1) (Figures 10A and B). APT1 is a depalmitoylating enzyme. Of note, several synaptic vesicle proteins are palmitoylated, and protein palmitoylation has been shown to regulate membrane tethering at the synapse (Kang et al., 2008; Fukata and Fukata, 2010). Critically, complexin-1 interacts with synaptotagmin and the SNARE complex to regulate neurotransmitter release and also affects synaptotagmin endocytosis (Li et al., 2017; Zhou et al., 2017).
No significant effect of levetiracetam was observed in the proteome of newly recycled vesicles from wild-type mice brains (Figure 10C) further suggesting that levetiracetam’s effects predominate in the absence of SV2B (Marcotulli et al., in preparation)
32
Figure 10.
Volcano plot showing the magnitude (ratio of protein abundance in levetiracetam condition (LEV) vs control condition (CTR), x-axis) and significance (-Log10 adjusted p-value, y-axis) of
levetiracetam’s effect on proteins associated with newly recycled synaptic vesicles in SV2B-KO animals (A) and wild-type (C). The dashed horizontal line indicates statistical significance threshold (P ≤ 0.05 after adjustment with permutation-based FDR correction. Missing values were then replaced by imputation from normal distribution with 2.1 down-shift); data are representative of 9 replicates (3 biological replicates, each analyzed 3 times). (B) Log2 Intensity of
levetiracetam-regulated proteins complexin-1 (CpxI) and Acyl Protein Thioesterase (APT1) in levetiracetam-treated samples (LEV) and control samples (CTR); 3 technical (Tech) replicates for each biological replicate (n=3, Bio) are shown, dash indicates undetected protein. From Marcotulli et al.,
33 Levetiracetam hinders synaptotagmin interaction with SV2A and complexin
To validate our results, we focused subsequent analyses on complexin because it regulates synaptic release through its interaction with synaptotagmin.
Indeed, synaptotagmin interacts with complexin and SNARE complex to regulate neurotransmitter release. Importantly, synaptotagmin levels in vesicles are regulated by SV2A, suggesting a chaperone-like function of SV2A. For these reasons, we tested the hypothesis that levetiracetam impacts the binding of synaptotagmin with SV2A and complexin. A GST-synaptotagmin fusion protein was used for pull-down assays of mice brain extracts. Since synaptotagmin-complexin and synaptotagmin-SV2A are calcium-regulated interactions, we examined the effects of levetiracetam (300 µm) in low-calcium condition (1 mM EGTA) and high-calcium condition (2 mM Ca2+).
Treatment of SV2B-KO brain homogenates with LEV reduced the amount of complexin bound to GST-synaptotagmin in the presence of low-calcium concentration (to 13.1% ± 11%), but not in high [Ca2+] (Figure 11A). Furthermore, levetiracetam significantly decreased the SV2A-synaptotagmin complexes both in low (to 63% ± 20%) and high [Ca2+] (from 44.7% to 15.1%) (Figure 11B). A smaller but significant effect of levetiracetam on the synaptotagmin-complexin interaction (to 70% ± 17.2%) was also observed in wild-type brains (Figure 11C). Levetiracetam had no significant effect on the synaptotagmin-SV2A interaction in wild-type brains (Figure 11D). Collectively, the protein-protein interaction results indicate that levetiracetam alters the interaction of synaptotagmin with SV2A and complexin. In addition, these findings support the hypothesis that SV2B mitigates levetiracetam’s effects.
34
Figure 11.
Binding of SV2 and complexin to the cytoplasmic domain of GST-synaptotagmin. SV2 and complexin were from brain extracts following treatment +/- levetiracetam (LEV). Shown are the results of GST-Synaptotagmin pull-down assays demonstrating the effects of levetiracetam on SV2A-synaptotagmin and complexin-synaptotagmin interaction in low and high calcium condition. GST alone was used as control. One milligram of Triton X-100-solubilized mouse brain homogenate was incubated with 100 µg of a GST-synaptotagmin fusion protein containing the cytoplasmic domain of synaptotagmin. Bound SV2A and complexin were detected by western blot analysis. Data are shown as percentage of the low calcium, untreated condition. In SV2B-KO brains, (A) levetiracetam reduces the amount of complexin bound to GST-synaptotagmin only in low calcium condition (P=0.037); (B) levetiracetam reduces the amount of SV2A bound to GST-synaptotagmin in low calcium (P=0.037) and high-calcium condition (P=0.049). (C) levetiracetam reduced the binding of complexin to GST-synaptotagmin in low calcium wild-type brains (P = 0.037); (D) levetiracetam had no effect on SV2A binding to GST-synaptotagmin in wild-type brains; n=3 for each condition. P values, Mann-Whitney test. A band was observed in the control conditions of some replicates probably due to the presence of synaptotagmin bound to GST.
35
Discussion
Synaptic vesicle protein SV2A is shown to be necessary and sufficient for levetiracetam binding (Lynch et al., 2004). Our results suggest that levetiracetam binding to SV2A modifies the composition of synaptic vesicles through a post-transcriptional mechanism, conceivably based on a protein-protein interaction network. The observations that SV2A is a regulator of synaptotagmin 1 and synaptogyrin 1 levels (Yao et al., 2010); that modulation of presynaptic proteins results in reduced synaptic activity and release probability (Wilson et al., 2005; Meehan et al., 2011; Li and Kavalali, 2017); that deletion of synapsins, which are co-regulated with SV2A, abolishes LEV effectiveness (Boido et al., 2010); are consistent with the present findings. Together, the observed changes support the levetiracetam-induced reduction of release probability (Li and Kavalali, 2017; Meehan et al., 2011; Wilson et al., 2005). The different effects in neocortex and hippocampus may be due to the different pattern of SV2 paralogs expression (Bajjalieh et al., 1994). Furthermore, considering that levetiracetam action is activity-dependent, it is conceivable that its different effects in neocortex and hippocampus reflect their different pattern of activity (Ito et al., 2014).
To study the long-term effects of levetiracetam, we used a dosing schedule that simulates chronic treatment in humans (Ueda et al., 2007). The absence of any significant change in mRNA and total protein levels (S1) suggests that levetiracetam acts through a synapse-specific post-transcriptional mechanism to regulate proteins levels in the synaptic fraction (P3; Marcotulli et al., 2017).
The analysis of the presynaptic interactome pointed out the role of protein-protein interactions for levetiracetam’s effects and the centrality of 14-3-3β and 14-3-3ε and LRRK2 in the interactome. LRRK2 controls synaptic proteins levels by modulating autophagic proteins degradation, promoting translation (Martin et al., 2014), and accelerating endocytosis with regional and neuronal specificity (i.e., in GABAergic striatal neurons and not glutamatergic hippocampal neurons; Maas et al., 2017). Increased LRRK2 may maintain normal concentrations of interacting proteins and, thus, may contribute to forging the pattern of levetiracetam-induced regulations (Marcotulli et al., 2017).
Presynaptic protein endocytosis and trafficking are probably the main mechanisms that regulate synaptic vesicles composition (Cousin, 2017). Thus, impacting SV2A’s trafficking function could affect vesicles stoichiometry and could explain levetiracetam’s effects.