Effect-based activities on air pollution:
What is the state of the natural and anthropogenic Italian ecosystems?
www.enea.it
Effect-based activities on air pollution: what is the state of the natural and anthropogenic Italian ecosystems?
Edited by Ilaria D’Elia, Alessandra De Marco, Giovanni Vialetto
Chapter 1 Chapter 2
Authors: Giovanni Vialetto, Alessandra De Marco, Tiziano Pignatelli, Antonio Ballarin-Denti Chapter 3
Authors: Ilaria D’Elia, Luisa Ciancarella, Antonio Piersanti, Giovanni Vialetto Chapter 4
Authors: Marco Ferretti, Giada Bertini, Filippo Bussotti, Laura Canini, Mario Cammarano, Roberto Canullo, Stefano Carnicelli, Guia Cecchini, Gianfranco Fabbio, Angela Farina, Daniele Giorgini, Matteo Feducci, Aldo Marchetto, Maurizio Marchi, Giorgio Matteucci, Khawla Zouglami
Chapter 5
Authors: Elisabetta Salvatori, Alessandra Campanella, Maria Chiesa, Lorenzo Cotrozzi, Angelo Finco, Lina Fusaro, Giacomo Gerosa, Giacomo Lorenzini, Riccardo Marzuoli, Cristina Nali, Romina Papini, Elisa Pellegrini,
Mariagrazia Tonelli, Fausto Manes Chapter 6
Authors: Maria Francesca Fornasier, Patrizia Bonanni, Marcello Vitale, Michele De Sanctis, Giuliano Fanelli, Fabio Attorre, Alessandra De Marco, Silvano Fares, Luca Salvati
Chapter 7
Authors: Michela Rogora, Aldo Marchetto, Rosario Mosello Chapter 8
Authors: Pasquale Spezzano, Giovanni Vialetto Chapter 9
Authors: Elena Paoletti, Elisabetta Salvatori, Fausto Manes, Chapter 10
Authors: Antonio Piersanti, Pierluigi Altavista, Carla Ancona, Giovanna Berti, Ennio Cadum, Luisella Ciancarella, Ilaria D’Elia, Francesco Forastiere, Marina Mastrantonio, Francesca Pacchierotti, Gaia Righini, Raffaella Uccelli Chapter 11
Authors: Ilaria D’Elia, Giovanni Vialetto, Luisella Ciancarella, Alessandra De Marco
2017 ENEA
National Agency for New Technologies, Energy and Sustainable Economic Development
ISBN 978-88-8286-344-9 Copy editing: Giuliano Ghisu Cover design: Flavio Miglietta
Printing: Laboratorio Tecnografico ENEA – Frascati
Actual and potential impact of
air pollution on Italian forests:
results from the long-term
national forest monitoring
networks under the
ICP Forests
National Focal Point: Angela Farina and Laura Canini (State Forestry Authority) Chapter coordinator: Marco Ferretti
Contributors: Marco Ferretti1,2, Giada Bertini3, Filippo Bussotti4, Laura Canini5, Mario Cammarano6,
Roberto Canullo7, Stefano Carnicelli8, Guia Cecchini8, Gianfranco Fabbio3, Angela Farina5, Daniele Giorgini7,
Matteo Feducci4, Aldo Marchetto9, Maurizio Marchi3, Giorgio Matteucci10, Khawla Zouglami7
1Swiss Federal Research Institute WSL; 2formerly at TerraData environmetrics; 3CREA-Centro di ricerca per la
selvicoltura; 4 Università di Firenze - Dipartimento di Biotecnologie Agrarie, Sezione di Botanica Ambientale ed
Applicata; 5State Forestry Autority; 6CNR-Istituto di Biologia Agroambientale e Forestale; 7 Università di Camerino -
School of Biosciences and Veterinary Medicine, Plant Diversity and Ecosystems Management unit;
CHAPTER4-ACTUAL AND POTENTIAL IMPACT OF AIR POLLUTION ON ITALIAN FORESTS: RESULTS FROM THE LONG-TERM NATIONAL FOREST MONITORING NETWORKS UNDER THE ICP
FORESTS
This Chapter was prepared for the most part on the basis of evaluations carried out within the LIFE project “Sustainable Monitoring And Reporting To Inform Forest and Environmental Awareness and Protection – SMART4Action” [LIFE13 ENV/IT/000813].
4.1 Introduction
Forests in Italy cover ca. 8.76 x 10⁶, stock 1,242 Mt carbon and offer a series of invaluable products
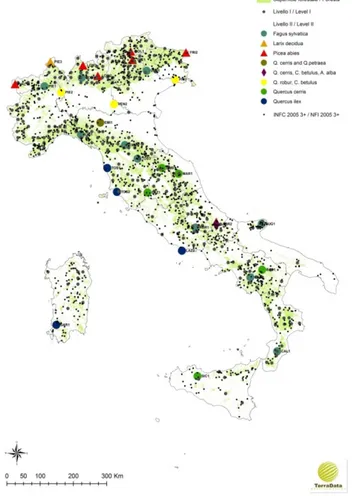
and services to the entire society (Gasparini and Tabacchi, 2011; Gasparini et al., 2013). Preserving forest integrity is therefore essential. Although effects are in general less obvious and frequent in comparison with other biotic and abiotic stressors, air pollution may have an impact on several compartments of forest ecosystem, and may endanger forest health, productivity and diversity (Bobbink et al., 2010; Karnosky et al., 2003). In this chapter, we will present status, trends of pressure, impacts and risks placed to forests by the most important air pollution issues in Italy as emerged from data collected by national forest monitoring networks since the mid of the 1990s. To do this, we will concentrate on data originated from harmonized measurements carried out at the national Level I and Level II networks that are parts of the UNECE ICP Forests (Figure 4.1).
Figure 4.1 – Level I (small black dots) and Level II (large colored symbols) networks in Italy. Colors refer to main tree species in Level II plot (source: LIFE SMART4Action).
4.2 Pressures
Deposition of oxydized (NOx) and reduced nitrogen (NHy) and tropospheric ozone (O3) are the most
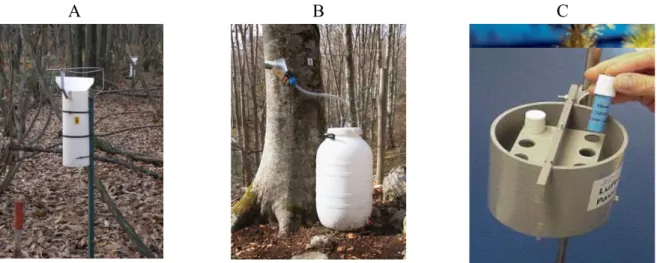
important air pollution forest-related issues in Italy and elsewhere. Both N deposition and ozone levels have been measured at the sites of the Italian ICP Forests Level II network since the 1990s. Atmospheric deposition is collected in the open field and under forest canopy (throughfall) by different set of funnels (Figure 4.2A). Stemflow collectors (Figure 4.2B) are used in beech plots to collect precipitation running along stems. Ozone concentration is measured using passive samplers (Figure 4.2C) since 1996. A further set of ozone measurements have been carried out over the period 2007 - 2011 on 15 Level I plots in Trentino (Northern Italy) (Gottardini et al., 2010).
A B C
Figure 4.2 – Collectors used for open field and throughfall (A), stemflow (B), and ozone passive samplers (C).
4.2.1 Status
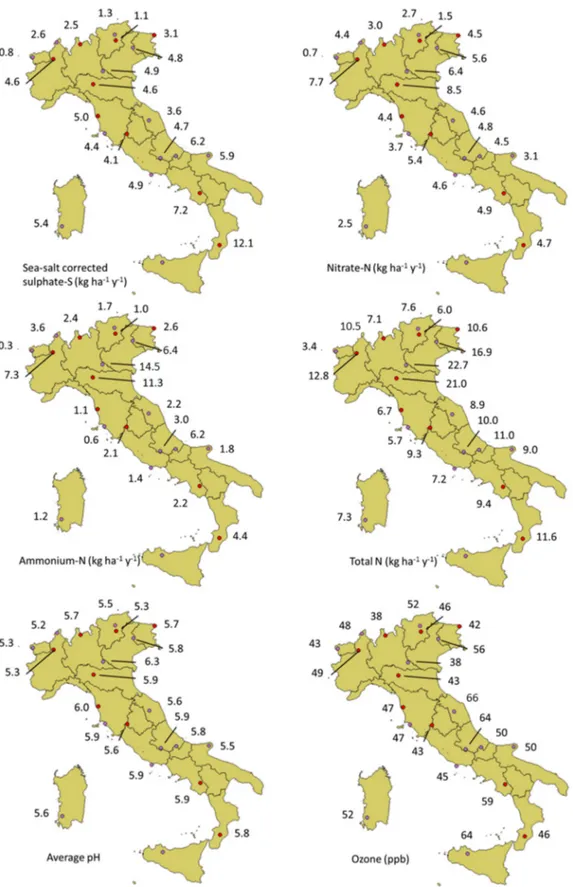
Sampling and analysis of atmospheric deposition and of ozone was carried out on a variable number of plots, depending on funding. In particular, in 2009-2011 this activity was carried out and validated on 21 plots. Throughfall deposition represents a good estimate of the deposition reaching the forest soil. The geographic distribution of average throughfall deposition for 2009-2011 of some selected ions and of the pH values obtained from the volume weighted average of hydrogen ion deposition is shown in Figure 4.3.
All the plots show pH values higher than> 5, mostly around the equilibrium value of 5.6. In the case of sulphate deposition (corrected for the amount deriving by marine aerosol - (CLRTAP, 2004), a geographic pattern is evident, with lower values on the Alps, and higher values in the Southernmost plots. Due to the episodic deposition of Saharan dust, this is leading to episodes with high sulphate and calcium concentration. In the case of nitrate, ammonium and total N (which includes N in organic compounds), high values were measured in the Po plain (where most of industries and farming are located) and in the surrounding hills, while lower values were detected in high elevation Alpine sites.
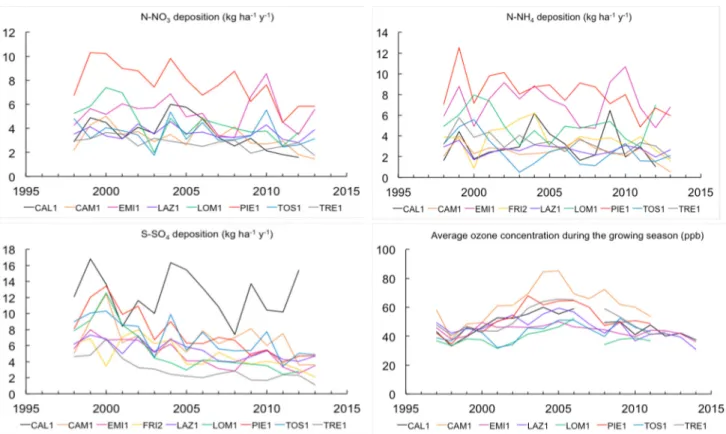
Figure 4.3 – Annual deposition of selected ions and average ozone concentration during the growing season at Level II sites, 2009-2011. Site codes in Figure 4.1. (Source: LIFE SMART4Action).
As for ozone, average concentration during the growing season was in general > 40 ppb in all sites, with slightly higher values in the Southern regions and in the Adriatic part of the peninsula (Figure 4.3).
Figure 4.4 – Mean 2000-2003 AOT40 at 26 Italian Level II sites (dots) and 41 background conventional monitoring stations over the period 2000-2003. After Ferretti et al., 2007.
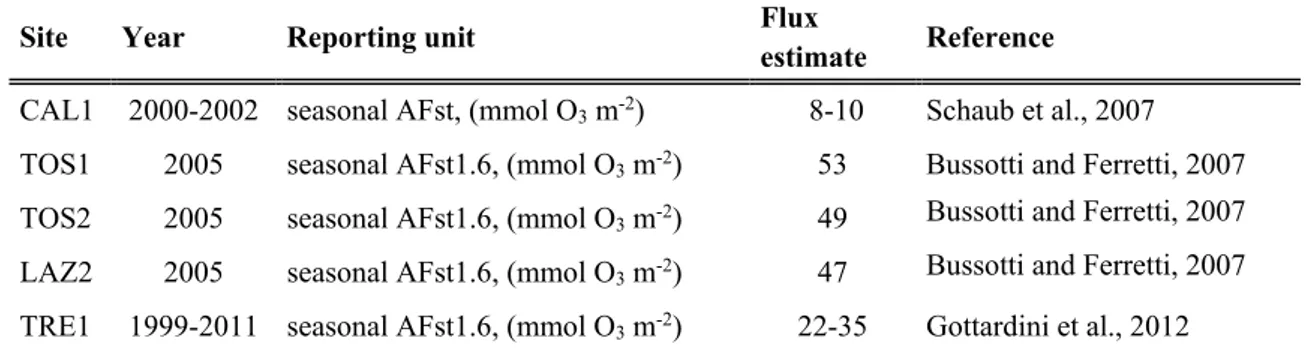
Table 4.1. Ozone flux estimates available for Level II sites in Italy.
Site Year Reporting unit Flux
estimate Reference
CAL1 2000-2002 seasonal AFst, (mmol O3 m-2) 8-10 Schaub et al., 2007
TOS1 2005 seasonal AFst1.6, (mmol O3 m-2) 53 Bussotti and Ferretti, 2007
TOS2 2005 seasonal AFst1.6, (mmol O3 m-2) 49 Bussotti and Ferretti, 2007
LAZ2 2005 seasonal AFst1.6, (mmol O3 m-2) 47 Bussotti and Ferretti, 2007
TRE1 1999-2011 seasonal AFst1.6, (mmol O3 m-2) 22-35 Gottardini et al., 2012
Accumulated ozone above threshold 40 ppb (AOT40) was estimated to exceed up to 10 times the Critical Level set to protect vegetation (Gerosa et al., 2003, 2007; Ferretti et al., 2007) (Figure 4.4). In terms of ozone flux, estimates were obtained for some Level II sites at individual years (Table 4.1) (Bussotti and Ferretti, 2007).
4.2.2 Trend
Figure 4.5 shows the temporal trend of sulphate, nitrate, and ammonium deposition and ozone concentration in nine forest sites with complete 1997-2013 dataseries. A marked decrease in sulphate deposition is evident in all sites at the end of the 1990s, while the reduction is less evident in the more recent period. Sulphate reduction resulted statistically significant (Seasonal Kendall test on monthly data, p<0.01) in eight out of nine sites. In the case of nitrate and ammonium, a slight decrease was evident only in the last years and it was significant (p<0.05) only in four and one site, respectively.
Figure 4.5 – Temporal trend in deposition of selected ions in nine Level II forest plots in Italy. (Source: LIFE SMART4Action).
Ozone concentration increased between 1997 and 2005, and decreased between 2005 and 2011 (Figure 4.5). The decreasing pattern is confirmed over the most recent years. As for ozone flux trend, information is available only for one Level II plot, namely TRE1 (Gottardini et al., 2012). At this site, ozone flux in terms of accumulated flux above 1.6 (AFst1.6) follows the same time pattern as AOT40, augmenting from 25 to 35 mmol m2 PLA between 1999 and 2005, and decreasing to ca.
27 mmol m2 PLA between 2006 and 2009 (Gottardini et al., 2012). 4.3 Impacts
N deposition may affect soil chemistry, nutrient balance, alter species-host interactions, biomass allocation, sensitivity to climate and to ozone. Ozone may reduce photosynthesis, cause premature senescence and direct injury to foliage. All together, this may have direct and indirect impact on forest health, growth, plant species diversity, and nutrition.
4.3.1 Forest health
In Italy, forests health has been measured under quality assured conditions since 1997. The most reliable variable adopted was (and is) defoliation, assessed both on Level I (ca. 250 plots) and Level II (31 plots) networks (see Figure 4.1). Direct injury to foliage due to ozone has been also assessed on some sites.
On Level I, mean defoliation for the 1997-2014 period was higher in broadleaves (39.7% of trees with defoliation higher than 25%) than in conifers (24.1%). Defoliation shows lower level in the South (30.7%) with respect to the North (35.5%) and Central (36.0%) Italy. Broadleaves were more defoliated (43.6%) in Northern Italy and less defoliated (35.8%) in Southern Italy. In conifers, defoliation was higher in Central Italy (36.9%) than in Southern Italy (12.3%).
Figure 4.6 – A) Percentage of trees with defoliation higher than 25% in the Level I plots, year -2014. B) 1997-2014 trend of the percentage of trees with defoliation >25%. Plots with at least 10 years of observations were analyzed with
Mann-Kendall test. Significant increases (positive, red) and decreases (negative, green) of defoliation are indicated. (Source: LIFE SMART4Action).
The distribution of the defoliated trees (>25%) at each Level I plot (Figure 4.6A) reveals higher frequency in the North-Western regions of Italy (Piedmont, Lombardy, Liguria and partly the Northern areas of Tuscany). The analysis of the 1997-2014 trends (Figure 4.6B) evidenced that plots with significant increase of defoliated trees were concentrated especially in the Northern regions and in the Alpine area. All in all, however, there is a significant (P<0.01) decreasing trend for defoliation, mostly driven by broadleaves.
Level II results confirm substantially the pattern described for the level I. Defoliation is increasing in Northern Italy (with the exception of VAL1) and decreasing in Central and Southern Italy (with the exception of LAZ1).
Foliar symptoms attributable to ozone injury were assessed at 12 Level II sites over the period 2003-2009 (Bussotti and Ferretti, 2007, 2009; Gottardini et al., 2012) and on a subset of Level I plots in Trentino in 2008-2009 (Gottardini et al., 2012). While no symptom was reported for Level I plots in Trentino, 46 taxa were found symptomatic at the investigated Level II sites. Off-plot investigation carried out nearby Level I plots in Trentino revealed symptoms on additional species, noticeably on Viburnum lantana (Gottardini et al., 2012).
4.3.2. Forest growth
Forest growth has been monitored since 1997 on Level II plots, and 17 plots have full coverage of the monitoring period 1997-2015 (i.e. five subsequent inventories). Current volume increment (IcV,
the difference in volume between two subsequent years) and mean volume increment (ImV, the ratio
by the Italian National Forest Inventory (Tabacchi et al., 2011). Concerning absolute values and expected trends, data are summarized in Table 4.2.
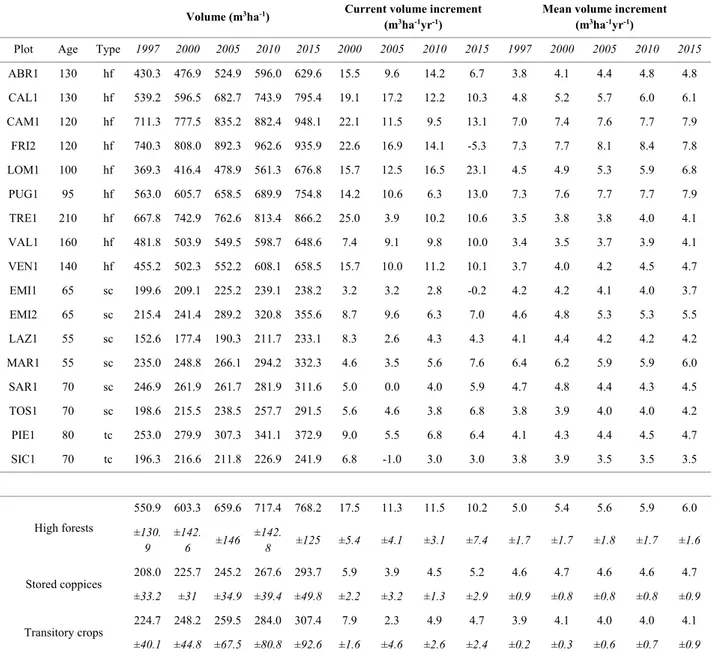
Table 4.2 – Estimated volume and increments for the 17 CONECOFOR plots (hf=high forests; sc=stored coppices; tc=transitory crops). Standard deviation is reported in italic. (Source: LIFE SMART4Action).
Volume (m3ha-1) Current volume increment
(m3ha-1yr-1)
Mean volume increment (m3ha-1yr-1)
Plot Age Type 1997 2000 2005 2010 2015 2000 2005 2010 2015 1997 2000 2005 2010 2015 ABR1 130 hf 430.3 476.9 524.9 596.0 629.6 15.5 9.6 14.2 6.7 3.8 4.1 4.4 4.8 4.8 CAL1 130 hf 539.2 596.5 682.7 743.9 795.4 19.1 17.2 12.2 10.3 4.8 5.2 5.7 6.0 6.1 CAM1 120 hf 711.3 777.5 835.2 882.4 948.1 22.1 11.5 9.5 13.1 7.0 7.4 7.6 7.7 7.9 FRI2 120 hf 740.3 808.0 892.3 962.6 935.9 22.6 16.9 14.1 -5.3 7.3 7.7 8.1 8.4 7.8 LOM1 100 hf 369.3 416.4 478.9 561.3 676.8 15.7 12.5 16.5 23.1 4.5 4.9 5.3 5.9 6.8 PUG1 95 hf 563.0 605.7 658.5 689.9 754.8 14.2 10.6 6.3 13.0 7.3 7.6 7.7 7.7 7.9 TRE1 210 hf 667.8 742.9 762.6 813.4 866.2 25.0 3.9 10.2 10.6 3.5 3.8 3.8 4.0 4.1 VAL1 160 hf 481.8 503.9 549.5 598.7 648.6 7.4 9.1 9.8 10.0 3.4 3.5 3.7 3.9 4.1 VEN1 140 hf 455.2 502.3 552.2 608.1 658.5 15.7 10.0 11.2 10.1 3.7 4.0 4.2 4.5 4.7 EMI1 65 sc 199.6 209.1 225.2 239.1 238.2 3.2 3.2 2.8 -0.2 4.2 4.2 4.1 4.0 3.7 EMI2 65 sc 215.4 241.4 289.2 320.8 355.6 8.7 9.6 6.3 7.0 4.6 4.8 5.3 5.3 5.5 LAZ1 55 sc 152.6 177.4 190.3 211.7 233.1 8.3 2.6 4.3 4.3 4.1 4.4 4.2 4.2 4.2 MAR1 55 sc 235.0 248.8 266.1 294.2 332.3 4.6 3.5 5.6 7.6 6.4 6.2 5.9 5.9 6.0 SAR1 70 sc 246.9 261.9 261.7 281.9 311.6 5.0 0.0 4.0 5.9 4.7 4.8 4.4 4.3 4.5 TOS1 70 sc 198.6 215.5 238.5 257.7 291.5 5.6 4.6 3.8 6.8 3.8 3.9 4.0 4.0 4.2 PIE1 80 tc 253.0 279.9 307.3 341.1 372.9 9.0 5.5 6.8 6.4 4.1 4.3 4.4 4.5 4.7 SIC1 70 tc 196.3 216.6 211.8 226.9 241.9 6.8 -1.0 3.0 3.0 3.8 3.9 3.5 3.5 3.5 High forests 550.9 603.3 659.6 717.4 768.2 17.5 11.3 11.5 10.2 5.0 5.4 5.6 5.9 6.0 ±130. 9 ±142. 6 ±146 ±142. 8 ±125 ±5.4 ±4.1 ±3.1 ±7.4 ±1.7 ±1.7 ±1.8 ±1.7 ±1.6 Stored coppices 208.0 225.7 245.2 267.6 293.7 5.9 3.9 4.5 5.2 4.6 4.7 4.6 4.6 4.7 ±33.2 ±31 ±34.9 ±39.4 ±49.8 ±2.2 ±3.2 ±1.3 ±2.9 ±0.9 ±0.8 ±0.8 ±0.8 ±0.9 Transitory crops 224.7 248.2 259.5 284.0 307.4 7.9 2.3 4.9 4.7 3.9 4.1 4.0 4.0 4.1 ±40.1 ±44.8 ±67.5 ±80.8 ±92.6 ±1.6 ±4.6 ±2.6 ±2.4 ±0.2 ±0.3 ±0.6 ±0.7 ±0.9
High forests include stands from 95 to 210 years old and are characterized by an average volume of 550.9 m3 ha-1 in 1997 and 768.2 m3 ha-1 in 2015. Stored coppices include stands from 55 to 70 years
with an average volume of 208.0 m3 ha-1 in 1997 and 293.7 m3 ha-1 in 2015. Transitory crops
included just two plots ranging from 70 to 80 years and with an average volume of 224.7 m3 ha-1 in
1997 and 307.4 m3 ha-1 in 2015.
A positive trend in standing volume has been observed over the concerned period for all the forest types considered (Figure 4.7A). Between 1997 and 2015 high forests had an average increase of 11.84 m3 ha-1 per year, more than double if compared to stored coppices and transitory crops (4.62
m3 ha-1 per year and 4.34 m3 ha-1 per year respectively), which are characterized also by similar
Figure 4.7 – Trends in volume (A), current increment (B) and mean increment (C) at Level II plots in Italy. (Source: LIFE SMART4Action).
The analysis of increments (Figures 4.7 B, C) revealed that high forests are characterized by a decreasing IcV (10.2 m3 ha-1 per year in 2010-2014), but still higher and distant from ImV (6.0 m3
ha-1 per year in 2010-2014). For stored coppices and transitory crops, IcV is decreasing (5.2 m3 ha-1
per year and 4.7 m3 ha-1 per year in 2010-2014, respectively) and very close to ImV (4.7 m3 ha-1 per
year and 4.1 m3 ha-1 per year in 2010-2014), meaning that the latter is very close to the culmination.
The strongest variation of IcV among subsequent inventory periods (Figure 4.7B) has been recorded for the 2000-2005 as a possible effect of the well-known 2003 heat wave, as reported by various Authors across Europe (Ciais et al., 2005; Leuzinger et al., 2005; Bertini et al., 2011). This variation was much more evident in high forests and less obvious in coppices and transitory crops.
4.3.3 Forest biodiversity
Forest biodiversity has been assessed mostly as diversity of vascular plant species in the Italian forest monitoring networks, Level I and Level II.
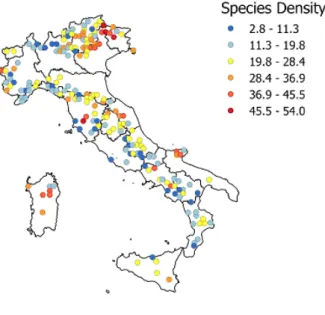
Level I was surveyed in 2007 by means of four 10x10 m Sampling Units (SU) on 201 selected plots, according to a harmonised manual (Canullo et al., 2007). It is considered as the representative baseline for the assessment of vascular plant diversity in Italian forests. As grouping factors, the Biogeographical regions and the EFCTs Forest types (EEA 2007, 2012) have been assumed. The spatial distribution of α-diversity across Level I plots in Italy is given in Figure 4.8, with vascular species density (no. of species x 100 m-2) ranging from 2.8 to 54.
A B
Figure 4.8 – Species density (no. of species x 100 m-2) as result of mean species richness between 4 SU on each site.
(Source: LIFE SMART4Action).
Non Metric Multidimentional Scaling (NMDS) analysis ordinates the sites in terms of similarity of species composition: the most clustered groups by EFTC Forest types are well separated and distributed according both to Latitude and Biogeographical regions (Alpine coniferous forests, Mountainous beech forest, Thermophilous deciduous forests, Broadleaved evergreen forests; Figure 4.9).
Figure 4.9 – Non Metric Multidimentional Scaling plot shows the relation between species composition (Jaccard dissimilarity index) and the EFTC. R = 76.8%; stress ≈ 22%. 3 - Alpine coniferous forests; 5 - Oak-hornbeam forests;
6 - Beech forests; 7 - Mountainous beech forest; 8 - Thermophilous deciduous forests; 9 - Broadleaved evergreen forests; 10 - Coniferous forests of the Mediterranean region; 13 - Native plantations;
14 - Exotic plantations and woodlands. (Source: LIFE SMART4Action).
The sampling design in the Level II sites includes 12 10x10 m SUs (Canullo et al., 2013) and proved to capture at least 80% of the expected number of terricolous plant species (including Vascular, Lichens and Bryophytes). For vascular plants, species density was proved to be a good proxy for plot richness (Ferretti et al., 2006). Validated, continuous and comparable datasets cover the period 1999-2012 with 11 plots (Figure 4.10).
Figure 4.10 –Time pattern of total number of species at individual Level II plots. (Source: LIFE SMART4Action).
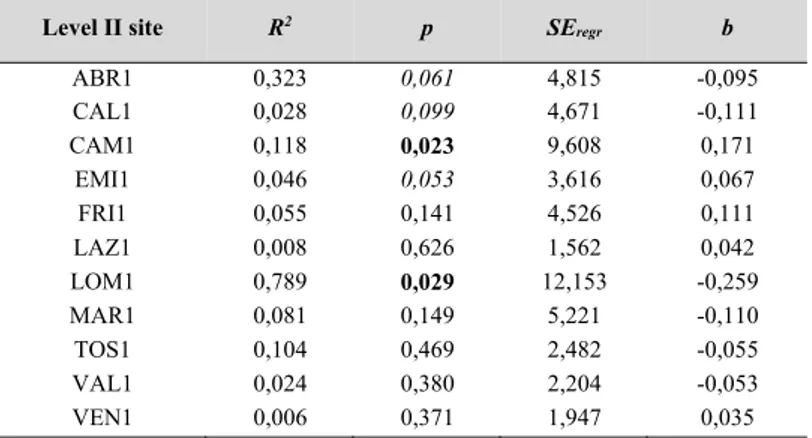
Linear model for plant species density (no. of species * 100 m-2) was tested for the selected plots. (within-subject contrasts RMANOVA. Table 4.3). Significant trends (P<0.05) were detected at CAM1 (Campania, South Italy, beech) where the beech forest shows there is an increasing species density, and at LOM1 (Lombardy, North Italy, Norway spruce), with a noticeable reduction in α-diversity of the transitional Spruce community (R2=0.79).
Table 4.3 – Linear model for species density (no. of species * 100 m-2) at the selected Level II plots
over the period 1999-2012. Italics: p<0.10; bold: p<0.05. (Source: LIFE SMART4Action).
Level II site R2 p SE regr b ABR1 0,323 0,061 4,815 -0,095 CAL1 0,028 0,099 4,671 -0,111 CAM1 0,118 0,023 9,608 0,171 EMI1 0,046 0,053 3,616 0,067 FRI1 0,055 0,141 4,526 0,111 LAZ1 0,008 0,626 1,562 0,042 LOM1 0,789 0,029 12,153 -0,259 MAR1 0,081 0,149 5,221 -0,110 TOS1 0,104 0,469 2,482 -0,055 VAL1 0,024 0,380 2,204 -0,053 VEN1 0,006 0,371 1,947 0,035
Trends in the species density appear a combination of previous management impact, present changes due to stand dynamics, and external factors. Even if not significant in term of linear trends, is worth to note the visible effect of a strong moth attack (Lymantria dispar) in 2002-2003 combined with the 2003 and 2007 heat waves at LAZ1 site (Turkey oak). Beech forest in VEN1 recovered quickly from a severe hailstorm of 1988, leading to still visible effects in 1999. The spruce community in VAL1 has no directional trends, but the annual variability is progressively reducing. The absolute minimum at CAL1 is not apparently linked to known factors.
10 20 30 40 50 60 70 80 90 100 to ta l n o . o f spe ci e s p e r p lot pe r ye ar 01ABR1 02BAS1 03CAL1 04CAM1 05EMI1 06EMI2 07FRI1 08FRI2 09LAZ1 10LOM1 11MAR1 12PIE1 13PUG1 14SAR1 15SIC1 16TOS1 17TRE1 18UMB1 19VAL1 20VEN1 21ABR2 22LAZ2 23LOM2 24LOM3 25TOS2 26TOS3 27BOL1 28LIG1 29PIE2 30PIE3 31VEN2 Dynamics of terricolous plant species in the Italian forest systems (LII CONECOFOR network, 1999‐2012) 1999 2000 2001 2002 2003 2004 2005 2006 2007 2008 2009 2010 2011 2012
4.3.4. Forest nutrition
Forest nutrition has been examined in terms of soil and foliar nutritional status.
(i) Soil solid phase. Soil chemistry is measured at Level I and Level II plots. Main results are reported in Figure 4.11 for Level I. In particular:
carbon content is most frequent between 15-30 g kg-1 and C:N ratio between 10-15;
base saturation (BS) is most frequently >75%;
cation exchange capacity (CEC) is most frequently between 10 and 20 mmolc+∙kg-1, and ca.
50% of the observed plots have a CEC > 20 mmolc+∙kg-1;
although ca. 50% of plots have a pH >5.5, there is a considerable amount of plots with pH <4.5.
Figure 4.11 – Soil condition on Level I plots in Italy (n: 239). From top left, clock-wise: frequency of plots in different class of carbon (C), C:N, Cation Exchange Capacity (CEC), Base Saturation (BS) and pH.
(Source: LIFE SMART4Action).
(ii) Soil solution. Soil solution is measured only at Level II sites. It provides important information about changes in the chemistry of soil water that may reflect changes in the atmospheric input and/or changes in ecosystem structure and processes. As such, careful interpretation is always necessary. Main results obtained after evaluating data collected over different time windows (3-15 yrs) and processed by means of Seasonal Mann-Kendall test (SMK) are summarized in Table 4.4.
Table 4.4 – Variable considered, layer examined, no. of plots, range of values among plots and occurrence of significant/non significant trends in soil solution data. (Source: LIFE SMART4Action).
Variable Layer No of plot Range
Significant increasing trend Significant decreasing trend Non significant trend pH forest floor 6 5.09-6.09 0 3 3 topsoil 8 4.24-6.59 2 0 6 subsoil 8 5.04-7.42 4 0 4 NO3-N forest floor 6 0.65-4.03 2 2 2 topsoil 8 0.09-8.85 1 1 6 subsoil 8 0.15-2.89 0 2 6 NH4-N forest floor 6 0.08-1.34 0 2 4 topsoil 3 0.03 1 - - subsoil 8 - - - - SO4-S forest floor 6 0.5-1.63 0 2 4 topsoil 8 0.31-2.3 0 5 3 subsoil 8 0.44-4.71 2 4 2
Base cations forest floor 6 6.01-15.09 1 3 2
topsoil 8 0.72-13.88 3 3 2
subsoil 8 0.85-16.44 2 3 3
(iii) Foliar nutrients. Bi-annual collection and chemical analysis of leaves and needles have been carried out at the Level II plots over the period 1995-2013. Major nutrients have been analyzed: N, S, P, Ca, Mg, K. Main results for the most important tree species are as follows (Figure 4.12A, B):
in terms of nutritional status, nutrient concentrations are for the most part of species and plots within the acceptable range. Possible exceptions are: high N values reported for some beech sites (Figure 4.12A), and low values reported for holm oak plots; possible low S values at Norway spruce sites; possible low K values at holm oak plots; generalized high values for Ca;
in terms of time trends, a generalized significant decreasing trend for N (beech, Norway spruce, Turkey oak), S (Norway spruce, Turkey oak). For other nutrients, the time trend is less generalized and more based on species-plot combination (Figure 4.12B).
Figure 4.12 – Foliar nutrients. A) mean N values at six beech plots; B) summary of time trends, all sites. Vertical axis shows the % of significant positive trends (above zero) and the % of negative trends (below zero). The % of non significant trend is not explicitly showed. Numbers above bars indicate the number of analyzed sites for
the given nutrient. (Source: LIFE SMART4Action).
4.4. Risk assessment
Risk is evaluated here in terms of possible effects of ozone and N deposition on the various impact indicators reported above.
4.4.1 Risk for forest health
No specific study has been undertaken to investigate the effect of N deposition on forest health in Italy. A European-scale study conducted on Level II sites (including Italy), however, revealed that N deposition and related N variables in soil and foliage improve tree defoliation models. The estimated effect is different according to the species being considered (Ferretti et al., 2015). As for ozone, a slight effect has been found for defoliation on beech (Ferretti et al., 2003; Ferretti et al., 2007; Bussotti and Ferretti, 2009). Results from a subset of Level I plots investigated in Trentino (N. Italy) over the period 2007-2011 show that ozone concentration has no significant effect on tree health of assorted species, with Norway spruce and larch being the most frequent ones (Gottardini et al., 2012).
As for direct effect on foliage, symptoms attributed to ozone were assessed at Level II sites and a subset of Level I plots in Trentino. Although several species were found symptomatic (Bussotti and Ferretti, 2007, 2009; Ferretti et al., 2003; Gottardini et al., 2012), statistical relationship with ozone exposure was always weak (Bussotti and Ferretti, 2009). Recent results obtained with single-species approach and Viburnum lantana as in situ biomonitor were promising, at least at local level (Gottardini et al., 2014; Gottardini et al., submitted).
4.4.2. Risk for forest growth
Distinct effect of N deposition has been detected on growth and C sequestration (Figure 4.13) (Ferretti et al., 2014). In relative terms, the maximal annual response of basal area increment (BAI) was estimated at 0.074–0.085% for every additional kgN. This corresponds to an annual maximal relative increase of 0.13–0.14% of carbon sequestered in the above-ground woody biomass for every additional kgN, i.e. a median value of 159 kgC per kgN ha-1 per year (range: 50–504 kgC per
kgN, depending on the site). The importance of N related variables was further confirmed by a study on 15 Level I plots in Trentino, where N:Mg was the most important predictor of BAI.
No significant effect of ozone has been detected, neither on Level II plots (Ferretti et al., 2003; Ferretti et al., 2014), nor on a subset of Level I plots in Trentino (Gottardini et al., 2012).
All in all, variables related to stand, N deposition, nutrition, soil and climate are by far the most important and significant predictors of growth (Ferretti et al., 2003; 2014).
A B
Figure 4.13 – Annual BAIrel (A) and annual estimated C sequestered (B) in 2000–2009 plotted against annual N deposition over the same time window at Level II plots in Italy. Solid line: all species; dashed line: broadleaves only.
FS: Fagus sylvatica; PA: Picea abies; QD: deciduous oak (only Quercus cerris in this diagram); QI: Quercus ilex. (after Ferretti et al., 2014).
4.4.3. Risk for forest biodiversity
Possible air pollution effect on species diversity at Level II plots has been examined in two respects: the expected sensitivity of species composition in relation to ozone and according to the list of sensitive species by the ICP Forests (Ferretti et al., 2003) and the expected effects of stand, soil, meteorology and deposition data on species density (Ferretti et al., 2006).
As for the frequency of ozone sensitive species, an ozone vulnerability index (OVI) that takes into account trees, shrubs, and herbs was calculated. According to this index, beech forests in north and central Italy were potentially the most sensitive to ozone.
As for the set of factors affecting vascular species diversity, multivariate (Generalized Linear Models; Ordinary Least Square Regression) and univariate (Spearman rank order correlation) statistical methods were tested on the set of data collected over the period 1999-2003. All in all, results of the multivariate approach revealed that soil (C, N, C/N, C/P, K, P) and stand (tree species, tree species in the upper layer, leaf litter) are the most important variables: species diversity was
___ All species y = 0.0744x - 0.0554 R² = 0.59; P<0.001 --- Broadleaves y = 0.085x - 0.3085 R² = 0.76; P<0.001 -0.5 0.0 0.5 1.0 1.5 2.0 2.5 3.0 0 10 20 30 40 Me an a nu al BAI re l (%)
Mean annual N deposition (kg ha-1 yr-1) FS PA QD QI ____ All species y = 0.1286x + 0.2298 R² = 0.64 P<0.001 --- Broadleaves y = 0.1388x + 0.0112 R² = 0.68 P<0.001 0 1 2 3 4 5 0 10 20 30 40 M e an a nn ua l Cs e qrel (%)
Mean annual N deposition (kg ha-1 yr-1)
FS PA QD QI
Figure 4.14 – Species density at beech Level II sites vs. exceedance of critical loads (CL) for N for the same sites. CL and exceedances were derived from measurements at the very site. Drawn after Ferretti et al., 2006.
Univariate analysis carried out for beech plots revealed that species diversity decreases as N deposition and exceedance of Critical Load for N increases (0.001<P<0.05) (Figure 4.14).
4.4.4. Risk for forest nutrition
Distinct effect of N deposition on soil pH and Basic Cation Exchangeable (BCE) was documented, especially for broadleaved forests (Ferretti et al., 2014) (Figure 4.15). Significant effect on foliar nutrient ratios was also reported (Ferretti et al., 2014) (Figure 4.16). With respect to ozone, no study has been undertaken so far to evaluate possible effects on soil biota and foliar nutrients.
Figure 4.15 – pH (a), C:N (b) and BCE (c) of the mineral topsoil plotted against actual N deposition. Soil data are those obtained after the 1995-1996 survey. Deposition data are mean annual values 2000-2009. Regressions represent
always the best fit for the given dataset. Continuous line: all species; dashed line: broadleaves only. FS: Fagus sylvatica; PA: Picea abies; QD: deciduous oaks; QI: Quercus ilex. After Ferretti et al., 2014.
a) b)
(a) (b)
(c) (d)
Figure 4.16 – Foliar N:P (a), N:Ca (b), N:Mg (c) and N:K (d) plotted against measured throughfall deposition. Foliar data are mean values after sampling carried out at years 2001, 2003, 2005, 2007, 2009. Deposition data
are mean annual values 2000-2009. Continuous line: all species; dashed line: broadleaves only. FS: Fagus sylvatica; PA: Picea abies; QD: deciduous oak; QI: Quercus ilex. After Ferretti et al., 2014.
4.5 Conclusions
When using measured data for both pressure and impact, evidence from the Italian forest monitoring networks (UNECE ICP Forests Level I and II) can be summarized as follows:
(i) trends in air pollution issues. There is a significant reduction of sulphate; for nitrate and ammonium the decrease is much slighter, although significant at some sites. After an increase between 1996-2005, mean summer ozone concentration is now decreasing. A decreasing 2000-2013 trend was also reported at the European scale (Sanders et al., 2016).
(ii) Measurable impact. Forest health improved over the 1997-2014 period, with a significant (P<0.01) decreasing trend for defoliation, mostly driven by broadleaves. Forests at Level II sites show positive trends in terms of average increment, and the standing volume is increasing. This latter point is not surprising, as sites are not actively managed and accumulate biomass. Forest biodiversity shows huge variability (Level I) but no clear trend (Level II) over the period 1999-2012. Forest nutrition revealed that acidic soils occur at ca. 50% of Level I plots. In soil solution
--- Broadleaves y = 0.8803x + 7.985 R² = 0.76; P<0.001 ___ All species y = 0.5187x + 11.179; R² = 0.28; P<0.01 0 10 20 30 40 50 0 10 20 30 40 F oliar N:P N deposition (kg ha-1 yr-1) FS PA QD QI --- Broadleaves y = 0.1132x + 1.6034 R² = 0.39; P<0.01 ____ All species y = 0.0609x + 2.2242 R² = 0.15; P<0.10 0 2 4 6 8 10 0 10 20 30 40 Fol ia r N: Ca N deposition (kg ha-1 yr-1) --- Broadleaves y = 0.3065x + 9.2155 R² = 0.13; P>0.1 ____ All species y = 0.1698x + 10.547 R² = 0.06; P>0.1 0 5 10 15 20 25 30 0 10 20 30 40 Foliar N:Mg N deposition (kg ha-1 yr-1) --- Broadleaves y = 0.1038x + 1.3926 R² = 0.65; P<0.001 ____ All species y = 0.0657x + 1.7729 R² = 0.36; P<0.01 0 1 2 3 4 5 0 10 20 30 40 F oliar N:K N deposition (kg ha-1 yr-1)
evidence of reduced basic cation leaching, which are important in relation to the impacts of acidifying deposition on soil chemistry. Foliar nutrients revealed a composite picture, with mostly decreasing trend for N and S, increasing for K, and much less obvious pattern for P, Ca, and Mg. (iii) Evidence for risk. Although in terms of reported levels, ozone is potentially a serious risk for Italian forests, measurable effects are quite limited on both Level I and II. Therefore, evidence for actual risk is weak, and limited effect on health and growth were reported by the various study undertaken since early 2000s. On the other end, evidence for N deposition effect on forest nutrition and growth is outstanding. Current level of N deposition was proven to impact soil and foliar chemistry, tree growth and carbon sequestration. Effects on plant diversity were also reported, mainly for beech forests.