Smart Proof System Instructions
It is recommended that you read all instructions below; even if you are familiar with online
review practices.
Using the Smart Proof system, proof reviewers can easily review the PDF proof, annotate
corrections, respond to queries directly from the locally saved PDF proof, all of which are
automatically submitted directly to our database without having to upload the annotated PDF.
Before completing your review...
Did you reply to all author queries found in your proof?
Did you click the "Publish Comments" button to save all your corrections?
Any unpublished comments will be lost.
Note:
Once you click "Complete Proof Review" you will not be able to add or
publish additional corrections.
Login into Smart Proof anywhere you are connected to the
internet.
Review the proof on the following pages and mark corrections,
changes, and query responses using the Annotation Tools.
Note:
Editing done by replacing the text on this PDF is not
permitted with this application.
Save your proof corrections by clicking the "Publish Comments"
button.
Corrections don't have to be marked in one sitting. You can
publish comments and log back in at a later time to add and
publish more comments before you click the "Complete Proof
Review" button below.
Complete your review after all corrections have been published
to the server by clicking the "Complete Proof Review" button
below.
Publish Comments
The Journal of Neuroscience 2019
Reprint Order Form
(Return only when ordering reprints. Keep a copy for your records.)
Orders must be paid before reprints are printed and mailed. Please print clearly.
Author
Name
Title
of
Article
Issue of Journal_ Manuscript # Publication Date
Number of Pages Color in Article? Yes / No (Please Circle) Symbol
UNEUSCI
Please include the journal name and reprint number or manuscript number on your reprint order form.
Order and Shipping Information
Reprint Costs
(Please see page 2 of 2 for reprint costs/fees.)Number of reprints ordered
$
Number of color reprints ordered
$
Number of covers ordered
$
Shipping Address
(cannot ship to a P.O. Box) Please Print ClearlyName
Institution
Street
City
State
Zip
Country
Subtotal $
Quantity_
Phone: Day
Fax
Evening
Taxes
$
(See page 2 and add appropriate sales tax for Virginia, Maryland, Pennsylvania, and the District of Columbia or Canadian GST to the reprints if your order is to be shipped to these locations.)
First address included, add $32 for
each additional shipping address
$
E-mail Address
Additional Shipping Address*
(cannot ship to a P.O. Box)Name
Institution
Street
City
State
Zip
Country
Quantity_
Fax
Total Amount Due $
Phone: Day
Evening
E-mail Address
* Add $32 for each additional shipping address
Payment Details
Credit Card Information
Credit Card payment Amount
Credit Card: VISA Am. Exp. MasterCard
Card NumberExpiration Date
Invoice Address
Please Print Clearly
Please complete Invoice address as it appears on credit card statement
Name
Institution
Department
Street
Wire Transfer Information
PNC BANK
Account # 5303779296
Account Title: SOCIETY OF NEUROSCIENCE
SWIFTCode: PNCCUS33
Routing/ABA # 031000053
Wire transfers must include your bank’s wire transfer fees plus a $25 processing fee. Reference the manuscript number in the comment section of the wire transfer.
Wire Confirmation Number
Wire Transfer Payment Amount_
Manuscript Number
Author’s Originating Bank
City State Zip
Wire Transfer Payments: Scan and email the completed reprint orderCountry
form and payment information to Society for Neuroscience:[email protected]Phone Fax
Check Information
E-mail Address
Credit Card Payments: Cenveo will process credit cards and
Cadmus Journal Services will appear on the credit card statement. Email completed order form and payment information to:
Check Number:
Checks must be paid in U.S. dollars and drawn on a U.S.
Bank.
Check Payments: Please send your payment and completed order
form made payable to: Society for Neuroscience Attn: Journal Department 1121 14thSt NW, Suite 1010
Washington, DC 20005
Signature
Date
Signature is required. By signing this form, the author agrees to accept the responsibility for the payment of reprints and/or all charges described in this document.
Domestic Color
# pages
100
200
300
400
500
1-4
$365
$440
$608
$752
$903
5-8
$608
$758
$1,077
$1,435
$1,777
9-12
$833
$1,088
$1,603
$2,078
$2,628
13-16
$1,042
$1,412
$2,095
$2,720
$3,450
17-20
$1,203
$1,725
$2,576
$3,490
$4,306
Covers
$203
$266
$336
$405
$463
International Color
# pages
100
200
300
400
500
1-4
$440 $550 $752 $949 $1,146
5-8
$729
$868
$1,227
$1,644 $2,211
9-12
$1,007
$1,262
$1,829
$2,385 $3,282
13-16
$1,239
$1,632
$2,396
$3,102
$4,237
17-20
$1,534
$1,968
$3,050
$3,936
$5,198
Covers
$272
$352
$498
$619
$793
The Journal of Neuroscience
2019
Minimum order is 100 copies.
For articles longer than 20 pages or larger than 500 copies,
please consult Cenveo Reprints at 410-943-0629.
B/W Reprint Cover
Cover prices are listed above. The cover will include the
publication title, article title, and author’s name printed in
black.
Late Order Charges
Articles more than 90 days from publication date will carry an
additional charge of $6.22 per page for file retrieval.
Shipping
Shipping costs are included in the reprint prices. Domestic
orders are shipped via FedEx Ground service. Foreign orders
are shipped via a proof of delivery air service.
Multiple Shipments
Tax Due
Residents of Virginia, Maryland, Pennsylvania, and the District
of Columbia are required to add the appropriate sales tax to each
reprint order. For orders shipped to Canada, please add 5%
Canadian GST unless exemption is claimed.
Sales Tax Rates
State
%
Virginia
4%
Maryland
6%
Pennsylvania
6%
Washington DC
6%
Ordering
Payment is required before reprints are printed and mailed. See
payment information provided on page 1 of this form.
PAYMENT
Orders can be shipped to more than one location. Please be
aware that it will cost $32 for each additional location.
Delivery
Your order will be shipped within 2 weeks of the journal print
date. Allow extra time for delivery.
Please direct all inquiries to:
Reprints
866-487-5625 (toll free number)
410-943-0629 (direct number)
H[email protected]
UTHMUST BE
RECEIVED
BEFORE
PRODUCTION
OF REPRINTS
CAN PROCEED.
Page 2 of 2
Domestic B/W
# pages
100
200
300
400
500
1-4
$289
$318
$347
$371
$399
5-8
$492
$550
$579
$631
$677
9-12
$677
$717
$805
$880
$949
13-16
$851
$915
$1,007
$1,158
$1,250
17-20
$990
$1,146
$1,239
$1,424
$1,545
Covers
$203
$266
$336
$405
$463
International B/W
# pages
100
200
300
400
500
1-4
$365
$417
$486
$550
$648
5-8
$585
$743
$827
$985
$1,124
9-12
$805
$984
$1,203
$1,418
$1,632
13-16
$990
$1,285
$1,574
$1,789
$2,153
17-20
$1,227
$1,545
$1,916
$2,188
$2,535
Covers
$272
$382
$544
$677
$793
Systems/Circuits
Oscillatory Properties of Functional Connections Between
Sensory Areas Mediate Cross-Modal Illusory Perception
Jason
Cooke
,
1Claudia
Poch
,
2Helge
Gillmeister
,
1Marcello
Costantini
,
3,4and
X
Vincenzo
Romei
1,51Centre for Brain Science, Department of Psychology, University of Essex, Wivenhoe Park, Colchester CO4 3SQ, United Kingdom,2Facultad de Lenguas y
Educacio´n, Universidad Nebrija, 28015 Madrid, Spain,3Department of Psychological, Health, and Territorial Sciences,4Institute for Advanced Biomedical
Technologies (ITAB), “G. d’Annunzio” University of Chieti-Pescara, 66013 Chieti, Italy, and5Centro studi e ricerche in Neuroscienze Cognitive,
Dipartimento di Psicologia, Universita’ di Bologna, Campus di Cesena, 47521 Cesena, Italy
The presentation of simple auditory stimuli can significantly impact visual processing and even induce visual illusions, such as the
auditory-induced double flash illusion (DFI). These cross-modal processes have been shown to be driven by occipital oscillatory activity
within the alpha band. Whether this phenomenon is network specific or can be generalized to other sensory interactions remains
unknown. The aim of the current study was to test whether cross-modal interactions between somatosensory-to-visual areas leading to
the same (but tactile-induced) DFI share similar properties with the auditory DFI. We hypothesized that if the effects are mediated by the
oscillatory properties of early visual areas per se, then the two versions of the illusion should be subtended by the same
neurophysiolog-ical mechanism (i.e., the speed of the alpha frequency). Alternatively, if the oscillatory activity in visual areas predicting this phenomenon
is dependent on the specific neural network involved, then it should reflect network-specific oscillatory properties. In line with the latter,
results recorded in humans (both sexes) show a network-specific oscillatory profile linking the auditory DFI to occipital alpha
oscilla-tions, replicating previous findings, and tactile DFI to occipital beta oscillaoscilla-tions, a rhythm typical of somatosensory processes. These
frequency-specific effects are observed for visual (but not auditory or somatosensory) areas and account for auditory–visual connectivity
in the alpha band and somatosensory–visual connectivity in the beta band. We conclude that task-dependent visual oscillations reflect
network-specific oscillatory properties favoring optimal directional neural communication timing for sensory binding.
Introduction
Our senses act as temporal gateways to our environment,
allow-ing continuous information streams within and across senses to
be coded into discrete information units (
VanRullen and Koch,
2003
;
Chakravarthi and VanRullen, 2012
;
VanRullen, 2016
). The
temporal resolution of such mechanisms may allow the brain to
temporally bind sensory input over time and across senses into
meaningful objects and events (
Cecere et al., 2015
), reducing the
complexity of our environment (
Wutz et al., 2016
,
2018
).
This Bayesian mechanism (
Beierholm et al., 2009
;
Barakat et
al., 2013
;
Kayser and Shams, 2015
;
Cuppini et al., 2017
) generally
leads to prompt, efficient readouts of the experienced
environ-ment. However, when presented with incongruent sensory
infor-mation, it often gives rise to illusory phenomena. One such
example is the double flash illusion (DFI).
Shams and et al. (2000)
first discovered that when two shortly interleaved beeps are
paired with a single flash, participants often perceive a second
illusory flash (
Shams et al., 2000
,
2002
). Such an illusion may
possibly represent the best coherent perceptual resolution of
oth-Received Dec. 19, 2018; revised April 14, 2019; accepted May 13, 2019.Author contributions: J.C., H.G., M.C., and V.R. designed research; J.C. performed research; J.C., C.P., and V.R. analyzed data; J.C. and V.R. wrote the paper.
V.R. is supported by the BIAL Foundation (Grant 204/2018). The authors declare no competing financial interests.
Correspondence should be addressed to either Jason Cooke at [email protected]; or Vincenzo Romei at [email protected].
https://doi.org/10.1523/JNEUROSCI.3184-18.2019 Copyright © 2019 the authors
Significance Statement
We investigated the oscillatory correlates of the auditory- and tactile-induced double flash illusion (DFI), a phenomenon where
two interleaved beeps (taps) set within 100 ms apart and paired with one visual flash induce the sensation of a second illusory flash.
Results confirm previous evidence that the speed of individual occipital alpha oscillations predict the temporal window of the
auditory-induced illusion. Importantly, they provide novel evidence that the tactile-induced DFI is instead mediated by the speed
of individual occipital beta oscillations. These task-dependent occipital oscillations are shown to be mediated by the oscillatory
properties of the neural network engaged in the task to favor optimal temporal integration between the senses.
The Journal of Neuroscience, Month XX, 2019•39(XX):XXX–XXX • 1
AQ:au, AQ:or
AQ: A
AQ: B
erwise conflicting sensory information (
Cecere et al., 2015
). By
systematically manipulating temporal intervals between paired
“beeps,” it is possible to define the temporal window of this
illu-sion (TWI; i.e., the time interval in which the illusory flash is
perceived). This TWI, first characterized by
Shams et al. (2002)
and detailed by
Cecere et al. (2015)
, demonstrates that the
illu-sion decays when the average time between stimuli exceeds 100
ms.
Cecere et al. (2015)
argued that these TWIs, variable across
individuals, are reminiscent of the temporal profile of posterior
oscillatory activity in the alpha band (8 –12 Hz). Using both
cor-relational and causal approaches,
Cecere et al. (2015)
found a
tight correlation between individual TWI and individual alpha
frequency (IAF) peak with faster IAFs predicting shorter TWIs,
and slower IAFs predicting larger TWIs.
Yet, we are unaware whether this mechanism is determined by
local network rules per se (i.e., local occipital oscillatory
reso-nance activity, typically alpha;
Rosanova et al., 2009
) or whether
it depends on long-range communication networks (
Fries, 2015
;
i.e., the way in which a sensory modality such as auditory, impacts
visual cortex activity;
Romei et al., 2012
). In other words, are
cross-modal visual illusions determined strictly by typically
vi-sual oscillatory constraints or do the vivi-sual oscillations mediating
these effects reflect the oscillatory properties of the functional
connection between sensory modalities?
An elegant way to tease apart these hypotheses is to investigate
the temporal profile and neural underpinnings of a DFI induced
by a sensory modality other than audition and compare it with
the auditory DFI. Here, we used the tactile DFI (
Violentyev et al.,
2005
), whereby replacing paired “beeps” with “taps” upon the
index finger elicits a similar illusory experience. No previous
re-port of a temporal profile for the tactile DFI exists. If the induced
illusory flash is determined by local resonance frequency of the
visual cortex (alpha), regardless of paired modality, then similar
illusory phenomena should also be mediated by occipital IAF.
Alternatively, if functional connections between
auditory/so-matosensory and visual cortices determine the fate of the illusory
experience, then occipital oscillations accounting for auditory
and tactile DFI may depend on communication-specific
mecha-nisms influencing visual cortical processing at the speed of their
typical resonance frequency.
According to the “Communication Through Coherence”
framework (
Fries, 2005
,
2015
), neural communication subserved
by oscillatory synchronization between remote but functionally
interconnected areas would be the result of the alignment of
post-synaptic neural activity (visual cortex) to prepost-synaptic input
(au-ditory/somatosensory cortex), creating temporal windows of
optimal communication.
This hypothesis would not contradict evidence that
auditory-induced TWI is mediated by alpha oscillations as auditory
pro-cessing (presynaptic), which is typically associated with alpha
activity (
Weisz et al., 2011
), phase aligns alpha oscillations in
visual cortex (postsynaptic;
Romei et al., 2012
). Crucially, this
would predict somewhat faster waves to influence the
tactile-TWI, since tactile processing (presynaptic) is often associated
with beta frequency oscillations (
Salenius and Hari, 2003
; Foffani
et al., 2005;
Engel and Fries, 2010
;
Baumgarten et al., 2015
).
Materials and Methods
Participants
A total of 62 participants volunteered to take part in the study, which was approved by the ethics committee of the University of Essex. Eleven participants were excluded from data analysis as their perceived illusion could not be fitted to the sigmoid function curve.
All but three participants (of whom two were left handed and one was ambidextrous by self-report were right handed; mean age, 25 years; age range, 18 – 44 years; 31 females).
Before taking part, participants completed a screening questionnaire ensuring that they had no psychiatric or neurological history and normal (or corrected) vision, as well as normal hearing and somatosensation by self-report.
Materials and apparatus
All visual stimuli were presented on a 17.5 inch cathode ray tube monitor via a Dell Optiplex 960 computer (resolution, 1280⫻ 1024; Windows XP, Microsoft) with a refresh rate of 85 Hz. Auditory stimuli were deliv-ered via a pair of speakers placed either side of the monitor (perceived by the participants as originating from the center of the screen, close to the visual stimuli). Volume was set so stimuli were⬃50 dB (SPL) at the location of the participants’ head. The tactile stimulation was provided via a tactile controller and mechanical solenoid stimulator (Heijo Re-search Electronics). This would deliver a suprathreshold tap (on the left index finger tip) by pushing a blunt plastic tip against the participant’s skin whenever a current was passed through the solenoid. During the tactile stimulation, white noise (⬃50 dB) was played to participants through speakers to mask and ensure that the mechanic noise produced by the tactile stimulator was not heard by the participants. Experimental stimuli were presented via E-prime (version 2.0; Psychology Software Tools).
We piloted the experiment in the first 15 participants, and an electro-encephalogram (EEG) was recorded with a restricted number of elec-trodes including elecelec-trodes Oz, O2, O1, FP1, FPz, and FP2, alongside the
ground electrode (location, AFz), and the reference electrode was placed over the right mastoid bone.
In the remaining participants (N⫽ 36), the EEG was recorded from 64 sintered Ag/AgCl electrodes mounted on an elastic cap (Easycap) along-side the ground electrode (position, AFz) and the reference electrode (placed upon the right mastoid bone). The EEG signals were digitized at 500 Hz and amplified using a BrainVision Professional BrainAmp am-plifier through the BrainVision Recorder program (BrainProducts). Be-fore the recording began, we ensured that all electrodes were set on the participant’s scalp at an impedance not exceeding 10 k⍀.
In all trials, participants were presented with a flashing disc, displayed just below a central fixation cross (this disc always flashed once for a duration of 12 ms and had a diameter of 2 cm). During the auditory DFI task, the disc was always paired with a double beep, with each beep having a frequency of 3500 Hz and a duration of 7 ms. During the tactile DFI task, disc presentation was paired with a double tactile stimulation to the left index finger.
The two brief tones (and the two tactile stimulations) were spaced apart by varying stimulus onset asynchronies (SOAs) ranging between 36 and 204 ms with increments of 12 ms, resulting in 15 different SOAs. Each SOA was presented 10 times, resulting in 150 randomly ordered trials per task.
The time between trials included the presentation of the stimuli (as described above) plus a varying interval. The interval corresponded to the elapsed time following the experimenter inputting on the keyboard the participant’s vocal response plus an interval ranging between 1000 and 1800 ms (there were five different intertrial delays in steps of 200 ms, each occurring 30 times).
Experimental design
Upon EEG fitting completion, participants were seated 57 cm away from the screen. EEG recording was manually started before trial commence-ment. Participants were instructed to fixate on a cross situated at the center of the screen while 150 flashing discs were presented in a first block of trials paired with two auditory (or tactile) stimuli, followed, after a brief resting period, by a second block of 150 flashing discs paired with two tactile (or auditory) stimuli. To control for order effects (including fatigue or boredom), the order of the blocks was counterbalanced, with half of the participants performing the tactile DFI first, and the other half performing the auditory DFI first. For the tactile DFI block, participants
2•J. Neurosci., Month XX, 2019•39(XX):XXX–XXX Cooke et al.• Oscillatory Networks Mediate Cross-Modal Illusions
rich3/zns-neusci/zns-neusci/zns99919/zns1769d19z xppws Sⴝ5 5/23/19 10:37 4/Color Figure(s): F1-F3 Art: 3184-18 Input-GT
AQ: C
were asked to place their left index finger immediately below the presen-tation of the flashing disc to maximize spatial co-occurrence of the visual and tactile stimuli processing.
In all trials, participants were required to verbally report whether they perceived one or two flashes, to avoid motor interference from partici-pants using their resting hand to respond to the stimuli, especially with the tactile version of the experiment. Participants were instructed to provide unspeeded, accurate responses. The verbal report was then input by the examiner via the “1” and “2” key on the keyboard, which prompted the new trial to start after a variable intertrial interval.
Statistical analysis
Behavioral data analysis
The participants’ perceived illusory flashes across the different SOAs were used to separately calculate for the auditory and tactile DFI the temporal window in which the visual illusion was maximally perceived. Therefore, we calculated the percentage of illusory trials (i.e., two flashes perceived) and plotted them as a function of SOAs separately for the auditory and tactile DFI. A psychometric sigmoid function [y⫽ a ⫹ b/ (1⫹ exp(⫺(x ⫺ c)/d)), where a is the top asymptote, b is the bottom asymptote, c is the inflection point, and d is the slope] was then fitted to each percentage of distribution returning a corresponding inflection point (center c) of the fitted sigmoid representing the point of decay of the illusion, taken as an index of the TWI. If data would not fit to the sigmoid function, a participant’s performance was deemed unreliable and discarded. Following this procedure, 11 of the 62 participants were not enrolled in the full experiment procedure and therefore were ex-cluded from data analysis.
EEG data analysis
Sensor space analysis. EEG activity concurrently recorded during task
execution was analyzed to calculate individual alpha and beta frequency peaks for each participant performing the auditory and tactile DFI tasks. In the first 15 participants, EEG analysis was performed on electrode Oz only. Depending on the band of interest, the data were bandpass filtered as follows: for alpha, a high-pass filter of 3 Hz and a low-pass filter of 40 Hz were used (identical toCecere et al., 2015); for beta, given the lower power relative to alpha, a more stringent criterion, a high-pass filter of 12 Hz and a low-pass filter of 25 Hz, was used. The EEG signal was segmented into equal epochs of 2000 ms. As data in this first sample of participants were not synched to stimulus presentation (no trigger was recorded for each stimulus onset and response), the 2000 ms epochs corresponded to consecutive nonoverlapping segments independent of the stimulus onset (for a total of⬃170 epochs on average). The potential confound of induced and evoked oscillatory responses was controlled for in the second group of 36 participants, where a 64 channel EEG was recorded at a sampling rate of 500 Hz. In this group, the EEG signal was rereferenced off-line to the average of all scalp electrodes. EEG data were subsequently segmented into 2000 ms epochs time locked to and preced-ing the visual stimulus onset. This resulted in 150 epochs of prestimulus oscillatory activity for each of the three frequency bands assessed both for the tactile and auditory DFI task. Each single epoch was visually inspected for artifacts (from eye blinks and muscle contractions) and manually rejected where necessary. For each participant and for all the recorded electrodes, a full power spectrum was obtained through fast Fourier transform with a zero padded window (nominal frequency resolution, 0.125 Hz). Finally, for each participant, task, and frequency band, EEG segments were averaged for calculation of the average peak frequency in the visual cortex, as calculated at the electrode Oz. For each frequency band, the peak frequency was determined for each participant as the value corresponding to the maximum peak frequency within their fre-quency range: alpha, 7–12 Hz; beta, 12–25 Hz. Finally, for each partici-pant the speed (in milliseconds) of one single oscillatory cycle was calculated using the peak frequency data (in hertz) obtained in the alpha and beta bands over Oz in the first 15 participants and⬎64 channels in the other 36 participants.
Source space analysis. All source space analyses were performed on the
second group of 36 participants for whom the signal had been recorded from a full set of 64 EEG channels.
Frequency peak analysis in virtual electrodes. Virtual electrodes were
computed for three different cortical areas (visual cortex, auditory cor-tex, and somatosensory cortex) using the linearly constrained minimum variance scalar beamformer (Sekihara et al., 2004) implemented in Field-trip. First, a 10 mm three-dimensional grid was fitted to the MNI stan-dard brain. Then, the forward model was created using a stanstan-dardized realistic head model. The spatial filters were computed for each DFI task using a 2 s prestimulus and a 0.5 s post-second stimulus covariance window, with the regularization parameter set to 10%. Single-trial time series were projected to the cortical surface by multiplying them by the spatial filters weights. The source volume was interpolated with the MNI standard brain to define the following three regions of interest: right calcarine gyrus (visual cortex), right superior temporal gyrus (auditory cortex), and the right postcentral gyrus (somatosensory cortex). For each participant, the IAF and individual beta frequency (IBF) were calculated in the voxel inside each of the three ROIs that showed a clear peak with the maximal amplitude. Finally, for each participant and selected voxel we calculated the speed (in milliseconds) of one single oscillatory cycle for each peak frequency data (in hertz).
Phase-locking value analysis. To quantify the frequency specificity
syn-chronization between the visual and the somatosensory cortex in the tactile DFI condition, and between the visual and the auditory cortex in the auditory DFI condition, we computed the phase-locking value (PLV) centered in each participant-specific IAF and IBF (Lachaux et al., 1999). The time series in each virtual electrode was filtered with Fc of IAF and IBF⫾1 Hz. The instantaneous phase complex representation of the fil-tered signal was calculated as follows: ei(t )⫽ s
a(t)/兩sa(t)兩, where sa(t) is
the analytic representation of the signal. The phase alignment between the two virtual electrodes was computed as follows:
PLVi, j共t兲 ⫽ 1 N
冏
冘
n⫽1 N e⫺i共i共t,n兲⫺j共t,n兲兲冏
,where N is the number of trials.
PLVs were computed separately for trials within each participant’s TWI and for trials outside each participant’s TWI, and rescaled with respect to a 100 ms prestimulus window. Nonparametric statistics were used to compute significant differences between each condition (Maris and Oostenveld, 2007). First, temporal clusters of PLVs were calculated based on time-points that were significant in paired t tests. Then, Monte-Carlo randomization was performed to obtain the empirical distribution of the maximum cluster statistic, computed as the sum of within-cluster
t values. The observed cluster was considered significant if its cluster
statistic value was above the 95% of the empirical distribution.
Correlation analyses on behavioral data. First, we looked at the
behav-ioral data obtained in the 51 participants for the auditory and tactile DFI, to compare performance in the two tasks and characterize for the first time the temporal profile of the tactile DFI. Second, we assessed the relationship between the known auditory DFI and the previously unex-plored tactile DFI temporal profiles.
To investigate this relationship, we also used the robust skipped cor-relation method, as described byPernet et al. (2013).
Correlation analyses between behavioral and electrophysiological data (sensor space). Next, we performed correlational analyses between the
individual speeds (in milliseconds) of each oscillatory cycle and the in-dividual width (in milliseconds) of the TWI separately for the auditory and tactile DFI.
Our behavioral and electrophysiological data were used to test the following predictions. First, we aimed to replicate data fromCecere et al. (2015)providing evidence suggesting that occipital IAF is selectively pre-dictive of TWI size. Second, we wanted to test the hypothesis that occip-ital IAF is predictive of both the size of the auditory and tactile TWI or alternatively that the size of TWI is differently accounted for by the occipital IAF in the specific instance of the auditory DFI and by the IBF in the specific instance of the tactile DFI. We tested these hypotheses first in the initial 15 participants over Oz (with epochs unlocked to stimulus onsets) and again in the sample of 36, this time using a full array of electrodes allowing for a topographical distribution of Pearson’s r (and
Cooke et al.• Oscillatory Networks Mediate Cross-Modal Illusions J. Neurosci., Month XX, 2019•39(XX):XXX–XXX • 3
stimulus-locked epochs). As the preliminary analyses of both behavioral and EEG data showed comparable results between groups, notably ex-cluding at the EEG level the potential confounds of evoked responses in the calculation of individual frequency peaks, data from both groups were pooled together for behavioral and EEG analyses at sensor Oz. Furthermore, we used the robust skipped correlation method as de-scribed byPernet et al. (2013).
Multiple regression analyses between behavioral and electrophysiological data (source space). To test whether any relationship between behavioral
and oscillatory data was specific to the visual cortex, a multiple linear regression analysis was used to assess the relationship between: (1) the TWI in the auditory DFI and the IAF and IBF of visual and auditory virtual electrodes; and (2) the TWI in the tactile DFI and the IAF and IBF of visual and somatosensory virtual electrodes (Keil et al., 2016). A for-ward step procedure was adopted to fit the regression model.
Results
Auditory-induced versus tactile-induced DFI
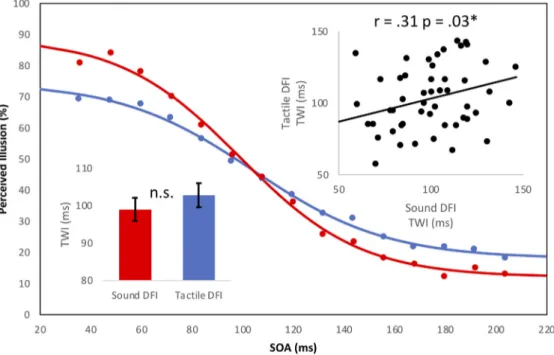
We first determined the temporal profile for the auditory and
tactile DFI. For the auditory DFI, we replicated previous reports
(
Cecere et al., 2015
) of an average TWI of just
⬃100 ms. The
temporal profile of the tactile-induced DFI was very similar to the
auditory-induced DFI in the same participants and did not
sig-nificantly differ from each other (auditory-induced TWI, 99.02
ms; SEM, 3.08; tactile-induced TWI, 102.80 ms; SEM, 3.23; t
(50)⫽
⫺1.02; p ⫽ 0.31). We then tested whether these two measures
were correlated. We found a significant correlation between the
two versions of the DFI (Pearson’s r
⫽ 0.31, p ⫽ 0.03), which also
survived the robust skipped correlation method (r
⫽ 0.31, CI ⫽
0.02– 0.55;
Fig. 1
).
We further compared the two sensory versions of the illusion
by contrasting the goodness of fit across the two versions of the
DFI. Specifically, measurements were taken for the R
2value (as
an indicator of the goodness of fit) for each curve across
partici-pants and conditions. We found that the goodness of fit for the
tactile illusion (R
2⫽ 0.70) was significantly lower compared with
that of the auditory illusion (R
2⫽ 0.83, p ⬍ 0.001), suggesting
that the tactile illusion is inherently noisier than the auditory
illusion.
Overall, a first interpretation of these behavioral findings is
that the auditory and tactile versions of the DFI might be driven
by similar neurophysiological mechanisms.
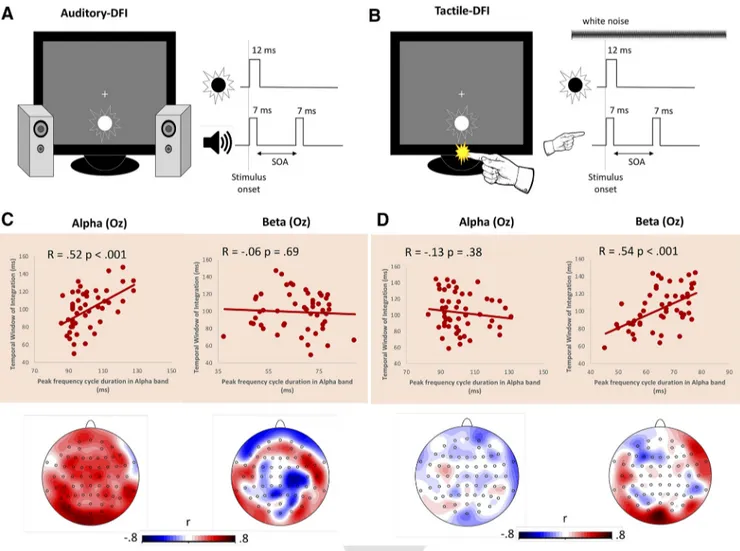
EEG correlates of auditory DFI and tactile DFI
Sensor space
We found that occipital IAF (in milliseconds) positively
corre-lates with the size of the TWI in the auditory DFI (Pearson’s r
⫽
0.52; p
⬍ 0.001), which also survives robust skipped correlations
(r
⫽ 0.41, CI ⫽ 0.18–0.59), such that faster IAFs accounted for
shorter TWIs, essentially replicating the results of the study by
Cecere et al. (2015)
. Pearson’s correlation topography (calculated
on 36 participants) suggests that this effect is maximal over
pos-terior regions and is frequency specific as no significant
correla-tions could be found for IBF (calculated on 51participants: r
⫽
⫺0.06, p ⫽ 0.69;
Fig. 2
). Crucially, when looking at the tactile
DFI, a different pattern of results emerged. IAF did not correlate
with TWI when the TWI was induced by tactile stimuli (r
⫽ 0.13,
p
⫽ 0.38). Instead, we found that occipital IBF positively
corre-lated with the size of the TWI in the tactile DFI (Pearson’s r
⫽
0.54, p
⬍ 0.001), which also survives robust skipped correlations
(r
⫽ 0.54, CI ⫽ 0.32–0.69), such that faster IBFs accounted for
shorter TWIs (
Fig. 3
B).
Source space
Multiple linear regression analysis showed that, for the TWI of
the auditory DFI task, the visual IAF (beta
⫽ 0.751, p ⬍ 0.01) was
a significant predictor [in line with recent findings by
Keil and
Senkowski (2017)
], while the auditory IAF (0.040, p
⬎ 0.05), the
visual IBF (beta
⫽ 0.020, p ⬎ 0.05) and the auditory IBF (beta ⫽
⫺0.05, p ⬎ 0.05) were not significant. The overall model fit was
R
2⫽ 0.184.
For the TWI of the tactile DFI task, the visual IBF (beta
⫽
0.984, p
⬍ 0.05) was a significant predictor, while the
somatosen-Figure 1. Behavioral data. Sigmoid curve represents the best fit of the average probability of perceiving the DFI plotted as a function of interbeep (red) and intertap (blue) delays. Each individual point represents the average TWI at each SOA. Top inset represents the significant positive correlation between respective TWIs for each illusion. Bottom inset displays the absolute values of the average TWIs for the auditory-induced (red) and the tactile-induced (blue) TWI, respectively.
4•J. Neurosci., Month XX, 2019•39(XX):XXX–XXX Cooke et al.• Oscillatory Networks Mediate Cross-Modal Illusions
rich3/zns-neusci/zns-neusci/zns99919/zns1769d19z xppws Sⴝ5 5/23/19 10:37 4/Color Figure(s): F1-F3 Art: 3184-18 Input-GT
F1 AQ: J AQ: F AQ: G F2 F3
sory IBF (
⫺0.141, p ⬎ 0.05), the visual IAF (beta ⫽ ⫺0.020, p ⬎
0.05), and the somatosensory IAF (beta
⫽ 0.104, p ⬎ 0.05) were
not significant. The overall model fit was R
2⫽ 0.16.
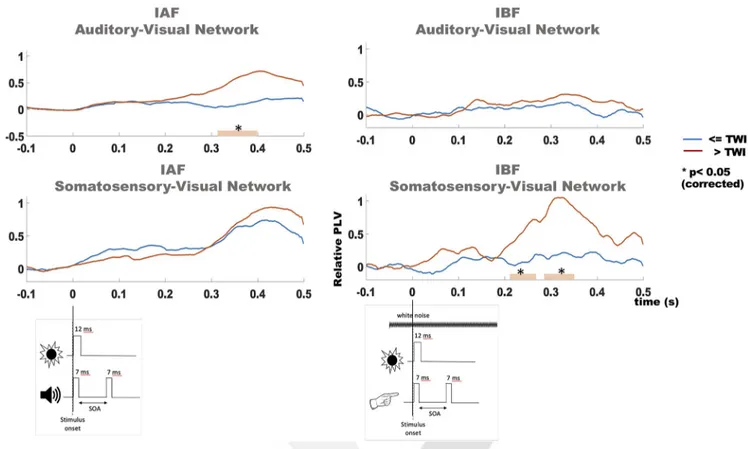
Phase-locking value
Next, we explored whether the frequency-specific effects
ob-served at the level of the visual cortex for the auditory DFI and the
tactile DFI can be best explained by a network-specific
mecha-nism. For this purpose, we measured the PLV in alpha and beta
oscillatory activity for auditory–visual and somatosensory–visual
networks depending on the following: (1) the performed task
(auditory and tactile DFI); and (2) the individual TWI, thus
con-trasting trials within and outside the TWI, respectively.
Nonparametric statistical analysis revealed significant
differ-ences between trials within and outside the TWI (
Fig. 3
).
Specif-ically, IAF PLVs between the auditory and visual cortices in the
auditory DFI were significantly greater for the trials outside the
TWI in a temporal cluster composed between 310 and 400 ms
poststimulus ( p
⫽ 0.046). IBF PLVs between the visual and
so-matosensory cortices in the tactile DFI differed between
condi-tions in two temporal clusters, between 210 and 260 ms and
between 280 and 360 ms poststimulus ( p
⫽ 0.015 and p ⫽ 0.03,
respectively).
Discussion
In the current study, we characterized for the first time the
tem-poral profile of the tactile DFI by directly comparing it to the
temporal profile of the auditory DFI. We found that these
tem-poral profiles are comparable; they do not significantly differ and
positively correlate, suggesting that similar mechanisms may be
at play in determining these effects. We thus tested which
neuro-physiological mechanism might best account for the auditory
and tactile DFI.
EEG results demonstrated that oscillatory processes relate to
the two illusions in a frequency-specific and network-specific
manner. While replicating previous findings demonstrating a
re-lationship between IAF and auditory DFI (
Cecere et al., 2015
;
Keil
and Senkowski, 2017
), we could not replicate this relationship
Figure 2. EEG correlates of auditory and tactile DFI. A, Auditory DFI. While viewing the flashing disc (12 ms duration) participants also experienced two 3500 Hz tones (both with a 7 ms duration). These auditory stimulations were separated by a variable SOA (36 –204 ms). Participants were asked to ignore the sound and state aloud whether they perceived one or two flashes. B, Tactile DFI. While viewing the flashing disc (12 ms duration), participants also experienced two brief taps to their left index finger (both with a 7 ms duration). These tactile stimulations were separated by a variable SOA (36 –204 ms). In addition, white noise was continuously played to mask the noise induced by the tactile stimulation. Participants were asked to ignore the tactile stimulation and state aloud whether they perceived one or two flashes. C, Correlation plots (top panels) for occipital regions (electrode Oz) and Pearson’s r topographic distributions (bottom panels) between auditory TWI and alpha (leftmost panel) or beta (rightmost panel) bands. A selective, positive, and significant relationship between the auditory-induced TWI and the speed of alpha oscillations was found, suggesting that faster alpha speed accounts for shorter TWI, replicating previous evidence (Cecere et al., 2015;Keil and Senkowski, 2017). D, Correlation plots (top panels) for occipital regions (electrode Oz) and Pearsons’ r topographic distributions (bottom panels) between tactile TWI and alpha (leftmost panel) or beta (rightmost panel) bands. A selective, positive, and significant relationship between the tactile-induced TWI and the speed of beta oscillations was found, suggesting that faster beta speed accounts for shorter TWI.
between IAF and tactile-TWI. Instead, a positive correlation
be-tween TWI and IBF was found, such that faster IBF predicted
shorter TWI. This was found both at sensor and source space,
over early visual areas. Moreover, in source space we found that
visual (but not auditory or somatosensory) IAF explained the
auditory–visual TWI (in line with a recent report by
Keil and
Senkowski, 2017
) and similarly only visual IBF explained the
tactile–visual TWI.
To test for the specific interpretation that oscillatory
corre-lates of the auditory DFI and tactile DFI represent not just a local
occipital phenomenon but rather a reliable marker of the specific
cross-modal network engendering the illusion, we have looked at
an index of connectivity between nodes of the network, namely
PLV. Specifically, we investigated the modulation of signal
strength between auditory–visual and somatosensory–visual
net-works in alpha and beta bands following stimulus presentation.
We found enhanced PLV in alpha (but not beta) oscillations
between auditory–visual (but not tactile–visual) nodes, while the
same was found in beta (but not alpha) oscillations between
tac-tile–visual (but not auditory–visual) nodes, confirming that
os-cillatory tuning to the particular version of the illusion reflects a
marker of network-specific activation.
This frequency- and network-specific PLV enhancement was
found for trials not inducing the illusion. This finding might
reflect temporal alignment to coherent temporal and quantity
information across the senses within the temporal binding unit
defined by the oscillatory cycle (
Romei et al., 2012
). This same
mechanism may be time sensitive to quantity-disparity
informa-tion presented within the temporal binding unit defined by the
oscillatory cycle, leading to altered integration processes across
the senses, ultimately resulting in an illusory percept.
What neurophysiological mechanism might be in place to
ac-count for this set of results? A relevant model that might explain
the current data is the “communication through coherence”
framework (
Fries, 2005
,
2015
). Here, neural communication is
subserved by neural synchronization between remote but
func-tionally interconnected areas. Specifically, such neural
synchro-nization is the result of alignment of postsynaptic neural activity
to presynaptic input, creating temporal windows of optimal
pre-ferred communication between involved areas. In this case, such
temporal profiles observed in our study related to the auditory
and tactile DFI may be the result of top-down directed alpha and
beta (7–25 Hz) influences (feedback connections) on primary
sensory input (
Fries, 2015
), shaping the final illusory perceptual
outcome.
From this perspective, if a cross-modal stimulus (auditory/
tactile) phase aligns oscillatory activity (alpha/beta) in visual
ar-eas, it will define the temporal windows corresponding to such
oscillatory cycle lengths (alpha/beta) within which two
consecu-tive stimuli may give rise to the illusory percept (i.e., the TWI).
The illusory phenomenon will be engendered by a second
modal phase alignment attempt induced by the second
cross-sensory stimulus reactivating the visual trace still being processed
by the ongoing phase alignment induced by the first multisensory
pair. Thus, individual frequency peaks would characterize the
Figure 3. PLV analysis in source space. PLV in the alpha (leftmost quadrants) and beta (rightmost quadrants) oscillatory activity for auditory–visual (top quadrants) and somatosensory–visual (bottom quadrants) networks. For each quadrant, trials within (blue trace) and outside (red trace) each individual TWI are depicted as a function of time (in ms) from visual stimulus onset. In the auditory DFI, trials outside the TWI showed significantly higher PLVs in the alpha band for the auditory–visual (but not somatosensory–visual) network between 310 and 400 ms poststimulus. In tactile DFI, trials outside the TWI showed significantly higher PLVs in the beta band for the somatosensory–visual network (but not the auditory–visual network) between 210 and 260 ms and again between 280 and 360 ms poststimulus. PLV differences between trials within or outside the TWI occurred at a late time following stimuli presentation. However, it should be noted that by the nature of experimental design, the second cross-modal stimulus was not locked to the first one but was jittered by tens of milliseconds (different SOAs), which might have masked an early differential PLV onset.
6•J. Neurosci., Month XX, 2019•39(XX):XXX–XXX Cooke et al.• Oscillatory Networks Mediate Cross-Modal Illusions
rich3/zns-neusci/zns-neusci/zns99919/zns1769d19z xppws Sⴝ5 5/23/19 10:37 4/Color Figure(s): F1-F3 Art: 3184-18 Input-GT
temporal resolution of inter-regional synchronization within
which the TWI phenomenon arises.
A closely related reference framework has been introduced by
Klimesch et al. (2007)
, who propose that communication
be-tween remote, but interconnected, areas can be achieved through
traveling waves; that is, neural oscillations allowing information
transference as measured through propagation between
elec-trodes via a neural network (
Klimesch et al., 2007
;
Muller et al.,
2018
). According to this framework, local oscillatory activity (i.e.,
resonance frequency) in auditory (alpha) or somatosensory
(beta) cortices will propagate toward the visual cortex accounting
for the specific differential impact of alpha and beta oscillations
on the auditory DFI and tactile DFI, respectively. This
mecha-nism allows prompt rescaling of temporal sampling across the
senses, optimizing cross-sensory communication efficiency.
Under these circumstances, one expects the respective size of
observed TWIs to reflect the length of the oscillatory cycle
deter-mining it (i.e.,
⬃100 ms when alpha oscillations mediate the
auditory TWI and
⬃70 ms when beta oscillations mediate the
tactile TWI). While this is the case for the auditory DFI, the tactile
DFI instead shows a TWI comparable to the auditory DFI rather
than one that is significantly shorter.
Here several issues may combine to account for the lack of
one-to-one correspondence between beta cycle length and the
length of tactile TWI. First, it simply takes longer for signals from
the hand to reach the brain than it does for signals from the ears
(
von Bekesy, 1959
). Such conduction time differences could total
10 –15 ms, which may in part account for the longer than
ex-pected tactile TWI. Second, the tactile DFI was far noisier than its
auditory counterpart, with its overall goodness of fit being
signif-icantly lower. A possible caveat accounting for noisier fitting may
lie in the asymmetry in our experimental design. White noise was
continuously played in the tactile DFI but not in the auditory DFI
to cancel out the spiky noise induced by the tactile stimulator.
One potential solution could have been to use white noise across
both versions of the illusion or, even better, to intermix both
versions within the same block while continuously playing white
noise. Additionally, this might have taken care of a potentially
induced bias in the allocation of intersensory attention (
Pomper
et al., 2015
) across the two versions of the illusion.
However, it should be noted that by pairing white noise with
the auditory DFI, participants may have relied more on visual
information (
Hartcher-O’Brien et al., 2014
), which may hamper
the auditory DFI.
Moreover, several reports have shown the DFI to be resistant
to feedback training (
Rosenthal et al., 2009
) and that participants
perceive the illusion independently of cross-modal spatial
con-gruence (
Innes-Brown and Crewther, 2009
) or even with prior
awareness of the illusion itself (
Rosenthal et al., 2009
), suggesting
a minor role played by intersensory attention allocation in this
particular task.
Therefore, given the comparative nature of our design looking
at possible differences of the impact of auditory and tactile
stim-uli on DFI, it was imperative to control for the specific
contribu-tion of each sensory modality.
Playing white noise in the tactile DFI might have contributed
to the tactile TWI being more skewed toward slower durations
due to noisier curve fitting, leading to a less efficient temporal
profile calculation of the tactile DFI. These aspects may in part
provide an explanation as to the lack of a one-to-one relationship
between TWI and the beta cycle length. Nevertheless, they would
not affect or alter the relationship between TWI and the
oscilla-tory marker as they represent a fixed-level noise to be accounted
for in the calculation of the absolute size of the tactile TWI.
The specific mechanism subtending this outcome may be
comparable across sensory modalities but simultaneously reflects
the peculiarity of each sensory modality, including temporal
res-olution. In other words, auditory and tactile cross-modal
in-duced visual illusions might have been caused by the specific
oscillatory properties of the pairing of each sensory signal. The
different oscillatory tuning could be explained as the specific
computational speed needed by the cross-sensory network to
efficiently integrate information, thus representing the optimal
quantum for temporal binding between a given cross-sensory
pair when impacting visual processing specifically. In this respect,
there is ample evidence that, in isolation, visual and auditory
sensory processing are governed by oscillatory activity in the
al-pha band (
Ergenoglu et al., 2004
;
Hanslmayr et al., 2007
;
Romei
et al., 2008a
,
b
,
2010
;
Van Dijk et al., 2008
;
Dugue´ et al., 2011
;
Weisz et al., 2011
;
Frey et al., 2014
), while somatosensory
pro-cessing typically occurs within the beta band (
Salenius and Hari,
2003
; Foffani et al., 2005;
Engel and Fries, 2010
;
Baumgarten et
al., 2015
). While there is abundant documentation of the
rela-tionship of visual processing with alpha oscillations, and with the
speed of alpha frequency (
Samaha and Postle, 2015
;
Wutz et al.,
2016
,
2018
;
Gulbinaite et al., 2017
;
Minami and Amano, 2017
;
Ronconi et al., 2018
), there is little empirical evidence
highlight-ing the specific oscillatory nature of the interaction between
mul-tiple senses. We and other groups have shown that the impact of
simple auditory stimulation on visual processing seems to be
governed by the way sounds phase align alpha oscillatory activity
in the occipital cortex (
Teplan et al., 2003
;
Romei et al., 2012
;
Mercier et al., 2013
;
Frey et al., 2014
;
Gleiss and Kayser, 2014
).
Yet, it was unclear whether this was a general feature of
cross-modal interactions within the visual system or whether the
spe-cific cross-sensory input determines the fate of the visual
response to the visual processing. In the current study, we
pro-vide the first epro-vidence highlighting the relevance of neural
com-munication at the network level through frequency-specific
oscillatory activity.
References
Barakat BK, Seitz AR, Shams L (2013) The effect of statistical learning on internal stimulus representations: predictable items are enhanced even when not predicted. Cognition 129:205–211.
Baumgarten TJ, Schnitzler A, Lange J (2015) Beta oscillations define discrete perceptual cycles in the somatosensory domain. Proc Natl Acad Sci U S A 112:12187–12192.
Beierholm UR, Quartz SR, Shams L (2009) Bayesian priors are encoded independently from likelihoods in human multisensory perception. J Vis 9(5):23, 1–9.
Cecere R, Rees G, Romei V (2015) Individual differences in alpha frequency drive crossmodal illusory perception. Curr Biol 25:231–235.
Chakravarthi R, Vanrullen R (2012) Conscious updating is a rhythmic pro-cess. Proc Natl Acad Sci U S A 109:10599 –10604.
Cuppini C, Shams L, Magosso E, Ursino M (2017) A biologically inspired neurocomputational model for audiovisual integration and causal infer-ence. Eur J Neurosci 46:2481–2498.
Dugue´ L, Marque P, VanRullen R (2011) The phase of ongoing oscillations mediates the causal relation between brain excitation and visual percep-tion. J Neurosci 31:11889 –11893.
Engel AK, Fries P (2010) Beta-band oscillations—signalling the status quo? Curr Opin Neurobiol 20:156 –165.
Ergenoglu T, Demiralp T, Bayraktaroglu Z, Ergen M, Beydagi H, Uresin Y (2004) Alpha rhythm of the EEG modulates visual detection perfor-mance in humans. Cogn Brain Res 20:376 –383.
Frey JN, Mainy N, Lachaux JP, Mu¨ller N, Bertrand O, Weisz N (2014) Se-lective modulation of auditory cortical alpha activity in an audiovisual spatial attention task. J Neurosci 34:6634 – 6639.
Cooke et al.• Oscillatory Networks Mediate Cross-Modal Illusions J. Neurosci., Month XX, 2019•39(XX):XXX–XXX • 7
Fries P (2005) A mechanism for cognitive dynamics: neuronal communica-tion through neuronal coherence. Trends Cogn Sci 9:474 – 480. Fries P (2015) Rhythms for cognition: communication through coherence.
Neuron 88:220 –235.
Gleiss S, Kayser C (2014) Acoustic noise improves visual perception and modulates occipital oscillatory states. J Cogn Neurosci 26:699 –711. Gulbinaite R, van Viegen T, Wieling M, Cohen MX, VanRullen R (2017)
Individual alpha peak frequency predicts 10 Hz flicker effects on selective attention. J Neurosci 37:10173–10184.
Hanslmayr S, Aslan A, Staudigl T, Klimesch W, Herrmann CS, Ba¨uml KH (2007) Prestimulus oscillations predict visual perception performance between and within subjects. Neuroimage 37:1465–1473.
Hartcher-O’Brien J, Di Luca M, Ernst MO (2014) The duration of uncertain times: audiovisual information about intervals is integrated in a statisti-cally optimal fashion. PLoS One 9:e89339.
Innes-Brown H, Crewther D (2009) The impact of spatial incongruence on an auditory-visual illusion. PLoS One 4:e6450.
Kayser C, Shams L (2015) Multisensory causal inference in the brain. PLoS Biol 13:e1002075.
Keil J, Senkowski D (2017) Individual alpha frequency relates to the sound-induced flash illusion. Multisens Res 30:565–578.
Keil J, Pomper U, Senkowski D (2016) Distinct patterns of local oscillatory activity and functional connectivity underlie intersensory attention and temporal prediction. Cortex 74:277–288.
Klimesch W, Hanslmayr S, Sauseng P, Gruber WR, Doppelmayr M (2007) P1 and traveling alpha waves: evidence for evoked oscillations. J Neuro-physiol 97:1311–1318.
Lachaux JP, Rodriguez E, Martinerie J, Varela FJ (1999) Measuring phase synchrony in brain signals. Hum Brain Mapp 8:194 –208.
Maris E, Oostenveld R (2007) Nonparametric statistical testing of EEG- and MEG-data. J Neurosci Methods 164:177–190.
Mercier MR, Foxe JJ, Fiebelkorn IC, Butler JS, Schwartz TH, Molholm S (2013) Auditory-driven phase reset in visual cortex: human electrocor-ticography reveals mechanisms of early multisensory integration. Neuro-image 79:19 –29.
Minami S, Amano K (2017) Illusory jitter perceived at the frequency of alpha oscillations. Curr Biol 27:2344 –2351.e4.
Muller L, Chavane F, Reynolds J, Sejnowski TJ (2018) Cortical travelling waves: mechanisms and computational principles. Nat Rev Neurosci 19:255–268.
Pernet CR, Wilcox R, Rousselet GA (2013) Robust correlation analyses: false positive and power validation using a new open source Matlab tool-box. Front Psychol 3:606.
Pomper U, Keil J, Foxe JJ, Senkowski D (2015) Intersensory selective atten-tion and temporal orienting operate in parallel and are instantiated in spatially distinct sensory and motor cortices. Hum Brain Mapp 36: 3246 –3259.
Romei V, Rihs T, Brodbeck V, Thut G (2008a) Resting electroencephalo-gram alpha-power over posterior sites indexes baseline visual cortex ex-citability. Neuroreport 19:203–208.
Romei V, Brodbeck V, Michel C, Amedi A, Pascual-Leone A, Thut G (2008b) Spontaneous fluctuations in posterior alpha-band EEG activity reflect variability in excitability of human visual areas. Cereb Cortex 18:2010 – 2018.
Romei V, Gross J, Thut G (2010) On the role of prestimulus alpha rhythms over occipito-parietal areas in visual input regulation: correlation or cau-sation? J Neurosci 30:8692– 8697.
Romei V, Gross J, Thut G (2012) Sounds reset rhythms of visual cortex and corresponding human visual perception. Curr Biol 22:807– 813. Ronconi L, Busch NA, Melcher D (2018) Alpha-band sensory entrainment
alters the duration of temporal windows in visual perception. Sci Rep 8:11810.
Rosanova M, Casali A, Bellina V, Resta F, Mariotti M, Massimini M (2009) Natural frequencies of human corticothalamic circuits. J Neurosci 29: 7679 –7685.
Rosenthal O, Shimojo S, Shams L (2009) Sound-induced flash illusion is resistant to feedback training. Brain Topogr 21:185–192.
Salenius S, Hari R (2003) Synchronous cortical oscillatory activity during motor action. Curr Opin Neurobiol 13:678 – 684.
Samaha J, Postle BR (2015) The speed of alpha-band oscillations predicts the temporal resolution of visual perception. Curr Biol 25:2985–2990. Sekihara K, Nagarajan SS, Poeppel D, Marantz A (2004) Asymptotic SNR of
scalar and vector minimum-variance beamformers for neuromagnetic source reconstruction. IEEE Trans Biomed Eng 51:1726 –1734. Shams L, Kamitani Y, Shimojo S (2000) Illusions: what you see is what you
hear. Nature 408:788.
Shams L, Kamitani Y, Shimojo S (2002) Visual illusion induced by sound. Brain Res Cogn Brain Res 14:147–152.
Teplan M, Krakovska´ A, S˘tolc S (2003) EEG in the context of audiovisual stimulation. Meas Sci Rev 3:17–20.
van Dijk H, Schoffelen JM, Oostenveld R, Jensen O (2008) Prestimulus os-cillatory activity in the alpha band predicts visual discrimination ability. J Neurosci 28:1816 –1823.
VanRullen R (2016) Perceptual cycles. Trends Cogn Sci 20:723–735. VanRullen R, Koch C (2003) Is perception discrete or continuous? Trends
Cogn Sci 7:207–213.
Violentyev A, Shimojo S, Shams L (2005) Touch-induced visual illusion. Neuroreport 16:1107–1110.
von Bekesy G (1959) Similarities between hearing and skin sensations. Psy-chol Rev 66:1–22.
Weisz N, Hartmann T, Mu¨ller N, Lorenz I, Obleser J (2011) Alpha rhythms in audition: cognitive and clinical perspectives. Front Psychol 2:73. Wutz A, Muschter E, van Koningsbruggen MG, Weisz N, Melcher D (2016)
Temporal integration windows in neural processing and perception aligned to saccadic eye movements. Curr Biol 26:1659 –1668.
Wutz A, Melcher D, Samaha J (2018) Frequency modulation of neural os-cillations according to visual task demands. Proc Natl Acad Sci U S A 115:1346 –1351.
8•J. Neurosci., Month XX, 2019•39(XX):XXX–XXX Cooke et al.• Oscillatory Networks Mediate Cross-Modal Illusions