Università degli Studi di Ferrara
DOTTORATO DI RICERCA IN
FARMACOLOGIA E ONCOLOGIA MOLECOLARE
CICLO XXI
COORDINATORE Prof. Pier Andrea Borea
H
H
i
i
g
g
h
h
G
G
l
l
u
u
c
c
o
o
s
s
e
e
I
I
n
n
d
d
u
u
c
c
e
e
s
s
A
A
d
d
i
i
p
p
o
o
g
g
e
e
n
n
i
i
c
c
D
D
i
i
f
f
f
f
e
e
r
r
e
e
n
n
t
t
i
i
a
a
t
t
i
i
o
o
n
n
o
o
f
f
M
M
u
u
s
s
c
c
l
l
e
e
-
-
D
D
e
e
r
r
i
i
v
v
e
e
d
d
S
S
t
t
e
e
m
m
C
C
e
e
l
l
l
l
s
s
Settore Scientifico Disciplinare MED/04
Dottorando Tutore
Dott.ssa Aguiari Paola Prof. Rizzuto Rosario
I
I
n
n
d
d
e
e
x
x
Abstract
__________________________________________________________________ 1Introduction
_____________________________________________________________ 2 Adipose Tissue __________________________________________________________ 2 Adipocyte Differentiation ____________________________________________ 4 Transcriptional Regulation of Adipocyte Differentiation _____________ 7 Obesity ____________________________________________________________ 12 Etiology of Obesity ___________________________________________ 13 Adipose Tissue as a Secretory Organ ______________________________ 15 Leptin ______________________________________________________ 16 Adiponectin _________________________________________________ 18 Retinol Binding Protein 4 ______________________________________ 19 Free Fatty Acids _____________________________________________ 19 Inflammation and Obesity _______________________________________ 20 Tumor Necrosis Factor α ______________________________________ 21 Interleukin 6 _________________________________________________ 21 Resistin _____________________________________________________ 21 Obesity‐induced Insulin Resistance and Type II Diabetes _________________ 23 Insulin Resistance and Type II Diabetes _________________________ 23 Pathogenesis of Insulin Resistance ______________________________ 26 Reactive Oxygen Species __________________________________________________ 31 ROS in Insulin Resistance and Type II Diabetes __________________________ 35 Protein Kinase C _________________________________________________________ 38Aim of the work
_________________________________________________________ 42Results
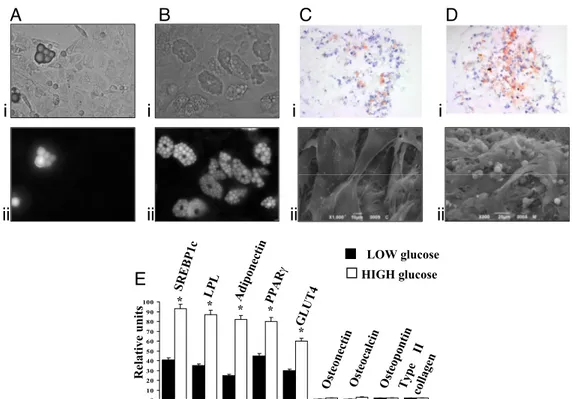
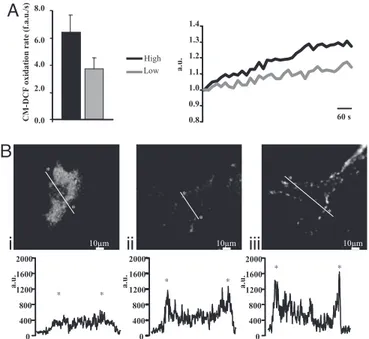
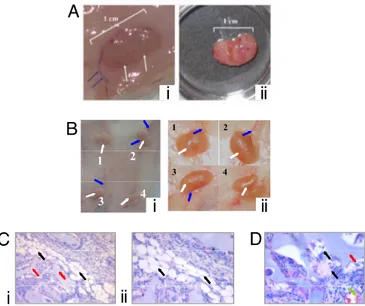
____________________________________________________________________ 44 Osteogenic, Chondrogenic and Adipogenic Differentiation Potential of Adipose‐derived Stem Cells __________________________________ 44 High glucose induces adipocyte differentiation of stem cells from adipose tissue ____________________________________________________ 47 Adipogenic conversion of muscle‐derived stem cells upon high glucose __________________________________________________________ 49Oxidative stress, via effector PKCs, is a trigger of adipocyte differentiation _________________________________________________________ 51 High glucose‐differentiated adipocytes can be successfully implanted in vivo ______________________________________________________ 55
Discussion
_______________________________________________________________ 57Materials and Methods
_________________________________________________ 63 Cell Cultures __________________________________________________________ 63 Biomaterials __________________________________________________________ 64 Characterization of the Mesenchymal Potential of ADSCs ___________________ 64 Adipocyte Differentiation Detection ______________________________________ 65 Electron Microscopy ___________________________________________________ 65 Real Time PCR ________________________________________________________ 65 Analysis of PKCβ Translocation _________________________________________ 66 Measurement of ROS Production ________________________________________ 66 PKCβ overexpression and silencing ______________________________________ 67 Surgical implantation of hyaluronic acid sponges seeded with adipocytes _______________________________________________________ 67References
________________________________________________________________ 68Abbreviations
____________________________________________________________ 79 High Glucose Induces Adipogenic Differentiation of Muscle‐Derived Stem Cells ____________ 80A
A
b
b
s
s
t
t
r
r
a
a
c
c
t
t
Regeneration of mesenchymal tissues depends on a resident stem cell population, which in most cases remains elusive in terms of cellular identity and differentiation signals. We here show that primary cell cultures derived from adipose tissue or skeletal muscle differentiate into adipocytes when cultured in high glucose. High glucose induces ROS production and PKCβ activation. These two events appear crucial steps in this differentiation process that can be directly induced by oxidizing agents and inhibited by PKCβ siRNA silencing. The differentiated adipocytes, when implanted in vivo, form viable and vascularized adipose tissue.
Overall, the data highlight a previously uncharacterized differentiation route triggered by high glucose that drives not only resident stem cells of the adipose tissue but also uncommitted precursors present in muscle cells to form adipose depots. This process may represent a feed‐forward cycle between the regional increase in adiposity and insulin resistance that plays a key role in the pathogenesis of diabetes mellitus.
I
I
n
n
t
t
r
r
o
o
d
d
u
u
c
c
t
t
i
i
o
o
n
n
A
A
d
d
i
i
p
p
o
o
s
s
e
e
T
T
i
i
s
s
s
s
u
u
e
e
Adipose tissue is a specialized connective tissue and represents, in humans, the body’s largest energy store. When energy intake exceeds energy expenditure, energy is stored in the form of triglycerides, which during starvation are mobilized through lipolysis process to provide fuel to other organs and to deliver glycerol to liver for gluconeogenesis and free fatty acids to lipoprotein synthesis.
Adipose tissue is a heterogeneous organ constituted by many fat depots differently located in the body. Mechanical support is given by fat pads located in the heels, in the fingers, in the toes and in the periorbital region. Adipocytes are found also in the subcutaneous layers between the muscle and dermis, commonly known as subcutaneous adipose tissue (SAT), while some adipose depots are within the body cavity, around the heart, kidneys, and other internal organs, associated with the mesentery or in the retroperitoneum and represent the visceral fat (VAT) [1]. VAT comprises omental and mesenteric deposits and represents 10–20% of total body fat in thin and obese men, and 5– 10% of total body fat in women, while SAT represents 80% of a healthy individual’s total fat mass. In addition, a further distinction can be made between brown and white adipocytes, constituting functional and morphologically different tissues, Brown Adipose Tissue (BAT) and White Adipose Tissue (WAT), respectively. Brown adipocytes are found only in mammals, and are multilocular and contain less overall lipid than white adipocytes, and are particularly rich in mitochondria. Furthermore, brown adipocytes differ from white adipocytes because they express uncoupling protein‐1 (UCP1), which dissipates the proton gradient across the inner mitochondrial membrane, to generate heat.
While rodents have a distinct brown fat pad, which lies in the interscapular region, in humans brown adipose tissue surrounds the heart and great vessels in infancy but disappears during growth until only scattered cells can be found within white fat pads.
Adipose tissue has been considered an energy storage depot with few interesting attributes. The past two decades, however, have seen an increasing scientific interest in this tissue, triggered by evidences about its strong correlation with Obesity and Metabolic Syndrome, and also by the recognition that, further than the key role in controlling the energy metabolism homeostasis, adipose tissue integrates many homeostatic processes, such as immune response, blood pressure, bone mass, haemostasis, and reproductive function [2]. These processes are coordinated mainly through the synthesis and release of peptide hormones by adipocytes.
Obesity is now recognized as a major health problem, since it represents the most important independent risk factor for insulin resistance, Type II Diabetes, dyslipidaemia, high blood pressure and thrombosis. Increased fat storage in fully differentiated adipocytes, resulting in enlarged fat cells, is well documented and is thought to be the most important mechanism whereby fat depots increase in adults [3]. Nevertheless, the development of Obesity is prevalently due to an increase in the number of adipocytes. Thus, actually the most int
A
A
d
d
i
i
p
p
o
o
c
c
y
y
t
t
e
e
D
D
i
i
f
f
f
f
e
e
r
r
e
e
n
n
t
t
i
i
a
a
t
t
i
i
o
o
n
n
The adipose cells arise from mesoderm, and white adipose tissue formation begins before birth and proceeds after birth, because of increased size of existing fat cells and proliferation of pre‐adipocyte cells. It has been demonstrated that fat cell number can increase when rats are fed a high‐carbohydrate or high‐fat diet [4, 5], or in the obese state; thus the potential to generate new fat cells is maintained throughout life, and is in function of environmental factors, such as nutritional status [6]. Although the complete knowledge about the developmental origin of fat cells still lacks, it is now clarified that the adipocyte lineage derives from a mesenchymal multipotent precursor, able to differentiate in adipocyte, chondrocyte, osteoblast, fibroblast and myocyte. Although the attempts to identify the cellular intermediates between the mesenchymal stem cell and the mature adipocyte, such intermediates have been difficult to characterize at the molecular level. Nonetheless, adipogenesis can be described in two phases, as described in figure 1.
The first phase is known as determination, and results in the conversion of the stem cell to a mesenchymal multipotent intermediate, which can originate a pre‐adipocyte, that is morphologically indiscernible from its precursor but has lost the potential to differentiate into other cell types. In the second phase, the so‐called terminal differentiation, the pre‐ adipocyte acquires the machinery necessary for lipid transport and synthesis, insulin sensitivity and secretion of adipokines.
In vitro model of differentiation and studies in transgenic mice are widely used to get some insight in the molecular mechanisms and signals transduction pathways involved, and terminal differentiation is more extensively characterized than determination, because most studies used cell lines with a differentiation potential restricted to adipogenic lineage. The most employed preadipose cell lines are 3T3‐L1 and 3T3‐F442A, cloned from heterogeneous Swiss 3T3 cells, that had been derived from dissociated near term mouse
Figure 1 Adipocyte Differentiation A pluripotent stem cell precursor gives rise to a mesenchymal precursor cell with the potential to differentiate along mesodermal lineages of myoblast, chondroblast, osteoblast, and adipocyte. Given appropriate environmental stimuli, preadipocytes undergo clonal expansion and subsequent terminal differentiation [7]. For more details about the molecular factors involved see the next section.
embryos [8, 9], and the Ob17 cell line, derived from epididymal fat pads of genetically obese (ob/ob) adult mice [10]. Following seeding, cells display an exponential growth phase until reaching confluence. In preadipose cell lines as well as in primary preadipocytes, growth arrest and not cell confluence or cell‐cell contact per se appears to be required for adipocyte differentiation.
During the growth phase, cells of preadipocyte lines as well as primary preadipocytes are morphologically similar to fibroblasts. Confluent 3T3‐L1 preadipocytes differentiate upon exposure to the adipogenic inducers fetal bovine serum (FBS), dexamethasone, isobutylmethylxanthine (IBMX), and insulin. This cocktail activates an adipogenic program, which occurs in two well‐defined phases. The stimulated cells immediately
STEM CELL (Pluripotent) MESENCHYMAL PRECURSOR (Multipotent) PREADIPOCYTE ADIPOCYTE C/EBPα C/EBPβ PPARγ SREBP1c
reenter the cell cycle and progress through at least two cell‐cycle divisions, a phase often referred to as clonal expansion. During this time, the cells express specific adipogenic transcription factors as well as cell cycle regulators that together facilitate expression of PPARγ and C/EBPα. Following this event, the committed cells undergo terminal differentiation manifested by production of lipid droplets as well as expression of multiple metabolic programs characteristic of mature fat cells. The validity of this 3T3‐L1 system as an appropriate model of adipocyte formation in the animal has been supported by many studies performed in both mouse and human tissue.
T
T
r
r
a
a
n
n
s
s
c
c
r
r
i
i
p
p
t
t
i
i
o
o
n
n
a
a
l
l
r
r
e
e
g
g
u
u
l
l
a
a
t
t
i
i
o
o
n
n
o
o
f
f
a
a
d
d
i
i
p
p
o
o
c
c
y
y
t
t
e
e
d
d
i
i
f
f
f
f
e
e
r
r
e
e
n
n
t
t
i
i
a
a
t
t
i
i
o
o
n
n
Adipogenesis in vitro follows a highly ordered and well characterized temporal sequence. The first step is the growth arrest of proliferating preadipocytes, achieved in cultured cell lines after contact inhibition, although cell–cell contact is not absolutely required for growth arrest to occur [7, 11]. In cultured preadipocyte cell lines, treatment with adipogenic hormone induces growth arrest and is followed by one or two additional rounds of cell division, known as clonal expansion.
Below is presented an overview on factors and pathways involved in transcriptional regulation of adipocyte differentiation, as extensively reviewed in [7, 12‐17].
Adipocyte differentiation is regulated by a network of transcriptional factors managing the expression of hundreds of proteins responsible for establishing the mature fat‐cell phenotype. This process is mainly regulated by three principal adipogenic factors, the key transcription factors peroxisome proliferator‐ activated receptor γ (PPARγ), the CCAAT/enhancer binding protein α(C/EBPα) and the sterol regulatory element binding protein 1(SREBP1).
PPARγ is a member of the peroxisome proliferator activated receptors (PPAR) subfamily of nuclear hormone receptors and was cloned independently by several groups. Three groups found two homologues to PPARα (then simply called PPAR) in Xenopus and mice, shown to activate the acyl CoA oxidase promoter in response to a variety of xenobiotic and hypolipidemic agents, and called them PPARβ (also called PPARδ, NUC‐1, and FAAR) and PPARγ. Looking for transcription factors promoting fat cell development, Spiegelman identified an adipose cell‐selective fatty acid binding protein aP2 enhancer and discovered that this enhancer is sufficient to direct gene expression and differentiation to fat cells in culture and in transgenic mice. Furthermore, Spiegelman was the first to highlight the key role of an adipocyte‐specific transcription factor primarily called ARF6,
and then discovered to be a heterodimeric complex of PPARγ and the retinoid X receptor (RXR).
PPARγ is the master regulator of adipogenesis; without it, precursor cells are incapable of developing the adipocyte phenotype, and alone it can initiate the entire adipogenic program. In fact, most pro‐adipogenic factors seem to function at least in part by activating PPARγ expression or activity. PPARγ exists as two isoforms, PPARγ1 and PPARγ2, generated by alternative promoter usage of the same gene, and the two forms differ in that PPARγ2 has an NH2‐terminal extension of 30 amino acids. Both isoforms are induced during adipogenesis, but PPARγ2 is found selectively in adipocytes, whereas γ1 is expressed at low level in many tissues, such as colonic epithelium, macrophages, liver and heart.
Nuclear hormone receptor superfamily members are ligand‐activated transcription factors, and PPARγ is not an exception. PPARγ can be activated by synthetic compounds called thiazolidinediones (TZDs), which are used clinically as antidiabetic agents treating hyperlipidemia and insulin resistance. Treatment of preadipocytes with TZDs increases both the extent and the rate of adipogenesis and this occurs in vivo as well as in vitro, although it is not clear if the adipogenic potential of these agents is related to their antidiabetic actions. Despite the utility of TZDs as investigative and therapeutic tools, no endogenous PPARγ ligand has been fully elucidated yet. The search for such a compound has identified some natural ligands, including 15 deoxy‐D12,14 prostaglandin J2, 15dPGJ2 are able to bind to and activate PPARγ, and eventually promote adipogenesis when added to cultured fibroblasts. Moreover, some findings indicate that ligand activation of PPARγ is required to induce adipogenesis but not to maintain PPARγ ‐dependent gene expression in mature adipocytes.
Since PPARγ is involved in formation of the trophoblast, attempts to develop PPARγ gene knockout result in embryonic lethality; thus, evidences about PPARγ involvement in adipogenic transcriptional program were given by experiments on chimeric mice derived from homozygote embryonic stem cells. The experiments demonstrated that, while wild‐
type cells can differentiate in mature adipocytes, knockout cells were unable to develop into adipocytes. Consequently, it was difficult to assess what impact the absence of PPARγ has on adipose tissue function, but other experiments demonstrated that effectively PPARγ deficiency resulted in failure to form adipose tissue, and the establishment of white adipose tissue (WAT)‐hypomorphic PPARγ knockdown mice resulted in animals that were severely lipodystrophic; these data authenticate PPARγ as the master regulator of adipogenesis.
PPARγ interacts with other transcription factors, such as C/EBPα. The C/EBPs belong to the basic‐leucine zipper class of transcription factors. Six isoforms have been described, all acting as homo‐ and/or heterodimers formed via a highly conserved bZIP domain, and some of them, C/EBPα, C/EBPβ, C/EBPγ, C/EBPδ and CHOP (transcription factor homologous to CCAT‐enhancer binding protein) are expressed in adipocytes. Their tissue distribution is not restricted to fat cells, since C/EBP proteins are also involved in the terminal differentiation of granulocytes and hepatocytes; in resistance to infection and the tissue response to injury in addition to transactivating a wide variety of target genes. Regulated expression is seen for several C/EBP family members during adipogenesis, and recent gain‐ and loss of‐function studies indicate that these proteins have a profound impact on fat cell development. In particular, C/EBPα is induced in adipogenesis and experiments of C/EBPα expression in fibroblasts at levels equivalent to those seen in fat demonstrate that it can cooperate powerfully with PPARγ triggering adipogenesis even if in absence of PPARγ ligands. This ability of PPARγ and C/EBPα to promote differentiation is not limited to fibroblasts, but can cause also the in vitro “transdifferentiation” of myoblasts to adipocytes. Moreover, C/EBPα has itself adipogenic action when expressed at high level since its overexpression in 3T3‐L1 preadipocytes induces differentiation.
Thus, C/EBPα and PPARγ participate in a common pathway of adipogenesis, in which PPARγ is the dominant factor, since experiments in C /EBPα‐deficient MEFs PPARγ can induce alone adipogenesis, whereas C/EBPα is incapable of driving the adipogenic program in the absence of PPARγ.
Studies about the temporal expression of the C/EBP family members indicate a cascade whereby early induction of C/EBPβ and C/EBPδ are expressed earlier than C/EBPα during adipogenesis leads to induction of C/EBPα. These factors appear to be very important in the induction of PPARγ in adipocyte differentiation, and some data show that conditional expression of C/EBPβ and C/EBPδ yield expression levels of PPARγ equivalent to those seen in adipocytes, indicating that the expression of PPARγ is depend on C/EBPβ and δ expression.
Another factor that can co‐work with PPARγ is the adipocyte determination and differentiation factor 1/sterol response element binding protein 1(ADD1/SREBP1), a member of the basic helix‐loop–helix (bHLH) family of transcription factors. This family has been implicated in tissue‐specific gene regulation, particularly in muscle, and SREBP1 was independently identified as a potent regulator of adipogenesis and fatty acid metabolism and as a key factor in cholesterol homeostasis. The human SREBP‐1c isoform, which predominates in animal tissues, is the most studied, and co‐expression of SREBP‐1c with PPARγ increases the transcriptional activity of PPARγ, even in absence of its ligands. Since SREBP‐1c is involved in the expression of key genes in fatty acid metabolism, such as Fatty acid Synthetase (FAS) or Lipoprotein Lipase (LPL), and SREBP1c alone had little effect, one interpretation is that SREBP1c is responsible for generating some factor that enhances PPARγ activity, i.e. its endogenous ligand.
The body of knowledge concerning all the events occurring during adipocyte differentiation has led to a model for a transcriptional network (described in figure 2) but the scheme have to be completed by a group of protein, called nuclear cofactors, such as the p160/CBP/p300 complex, the DRIP/TRAP complex and PPARγ coactivator‐1 and ‐2 (PGC1 and PGC2), operates to open up tightly wound chromatin structures and recruit elements of the basal transcription apparatus, in order for transcription factors to activate gene expression. The interaction of multiple coactivators with transcription factors in different temporal and spatial contexts provides another possible level of regulation to gene expression.
Figure 2 Transcriptional Regulation of Adipocyte Differentiation PPARγ and C/EBP family interact to control adipose differentiation; one major function of C/EBPβ and C/EBPδ is to induce the expression of PPARγ, which in turn activates C/EBPα. C/EBPα exerts positive feedback on PPARγ to maintain the differentiated state. SREBP1 can activate PPARγ by inducing its expression as well as by promoting the production of an endogenous PPARγ ligand. Activation of the transcription factors involved ca be achieved by exposure of preadipocytes to a cocktail of adipogenic inducers comprised of insulin, glucocorticoids, IBMX, and fetal bovine serum [13].
O
O
b
b
e
e
s
s
i
i
t
t
y
y
Obesity occurs when caloric intake exceeds caloric expenditure, defined in medicine as an excess of body fat and it is now considered a public health problem in most economically advanced countries. The prevalence of the disorder in the United States comprises ∼1 in 3 adults [18]. The Obesity epidemic has developed with considerable rapidity over the past 2 decades, with the incidence rising 3‐fold in the U.K., for example, since the early 1980s [19]and the problem is not limited to adults, a marked increase in Obesity is found among children [20]. Obesity is associated with a reduction in life span of ∼8 years, as well as with an increased risk of several major diseases, including Type II Diabetes, coronary heart disease, and certain cancers (such as breast and colon). In the case of Type II Diabetes, the risk is particularly marked because being obese increases the likelihood of developing the disease by ∼10‐fold once a BMI of 30 kg/m2 is reached.
Furthermore, the greater is the degree of Obesity, the higher is the relative risk.
The human classification of Obesity is based on the Body Mass Index (BMI): a BMI between 20 to 30 kg/(m2) represents an overweight state, while Obesity is defined as a BMI
value above 30 kg/(m2).
In many countries Obesity has reached epidemic proportions and it is more prevalent in certain ethnic groups, but in general Obesity increases with age, it is higher in women and those from lower socio‐economic strata in Western countries; the distribution of fat is sexually dimorphic: in general more subcutaneous fat is found in women (gynecoid distribution), while an increase in intra‐abdominal fat (android distribution) is found in men. These two types of adipose tissue present metabolically differently behaviors, since android Obesity is strongly associated with insulin resistance and increased cardiovascular morbidity and mortality (i.e. risk of heart attacks).
The primary role of adipose tissue is the control of energy intake through fatty acid deposition (as triacylglycerols) and release, and the apparent simplicity of both white
adipocytes and of WAT itself, histologically and metabolically, are the key reasons why the organ has been relatively ignored until recently. However, this has changed radically over the past few years with the tissue becoming a focus of intense research activity, given that Obesity is defined by the expansion of the tissue. White adipose tissue (WAT) is a now recognized as major secretory organ, particularly through the release of free fatty acids (FFA) during fasting. In addition to FFA, adipose tissue also releases other lipid moieties, such as cholesterol, retinol, steroid hormones, and prostaglandins [21]. Cholesterol and retinol are not synthesized by WAT, but rather are taken up and stored within the tissue, and steroid hormone conversions can take place in white adipocytes [22]. Moreover, the enzyme lipoprotein lipase (LPL) is released from adipocytes for the breakdown of circulating triacylglycerols to FFA, which are subsequently stored within fat cells.
Moreover, WAT is the primary site of the production of key hormones involved not only in energy balance, but also involved in a range of metabolic and physiological processes; some of these factors, termed adipokines, are implicated in the pathologies associated with Obesity, particularly insulin resistance and the Metabolic Syndrome [21, 23, 24].
E
E
t
t
i
i
o
o
l
l
o
o
g
g
y
y
o
o
f
f
O
O
b
b
e
e
s
s
i
i
t
t
y
y
Obesity takes place when food intake exceeds energy expenditure. In a sedentary adult with as standard average daily intake, total energy expenditure is given by basal (resting) metabolic rate (60–70%) plus obligatory thermogenesis (5–15%), and physical activity (spontaneous activity: 20–30%, physical work and exercise will need additional energy). The factors that control food intake are complex and not only involve physiological control mechanisms but also social, cultural aspects about meals as well as about physical activity. While Western industrialized nations become progressively more sedentary, food
industries and food technology provide cheap and highly palatable food, which is rich in fat as this is one of the mechanisms generating palatability, but fat is also energy dense at 9 kcal/g compared with carbohydrate or protein at 4 kcal/g.
About basal metabolic rate, there is no evidence that the obese have a low resting metabolic rate; indeed an obese person has a higher rate than a lean person of the same height, since as the total body mass increases, resting metabolic rate increases.
It is now well recognized that, for about 80% of the effect, the development of Obesity is given by a genetic component, described first by experimental rodent models of Obesity and defects found in human, including: the loss of function mutation in leptin gene (ob/ob mouse); the loss of function mutation in leptin receptor (db/db mouse); the melanocortin 4 receptor defects; Pro‐opiomelanocortin cleavage defect leading to loss of the Melanocyte Stimulating Hormone (MSH). In addition, there are a number of other rare disorders associated with Obesity such as Prader‐Willi or Bardet‐Biedl syndromes. For the most part, the exact genes involved in development of Obesity remain to be elucidated.
A
A
d
d
i
i
p
p
o
o
s
s
e
e
T
T
i
i
s
s
s
s
u
u
e
e
a
a
s
s
a
a
s
s
e
e
c
c
r
r
e
e
t
t
o
o
r
r
y
y
o
o
r
r
g
g
a
a
n
n
The pivotal change in perspective on the role of WAT as a secretory organ came with the identification of the hormone leptin in 1994, which followed the search for the Ob gene, a mutation in which is responsible for the Obesity of the ob/ob mouse [25]. Leptin, a 16 kDa cytokine‐like protein, is a critical hormonal signal from adipocytes in the regulation of appetite and energy balance [26, 27], interacting with several hypothalamic orexigenic and anorexigenic pathways.
The diversity of the adipokines (described below) secreted by the adipose tissue in addition to leptin, is considerable, in terms of both protein structure and function. The adipokines (figure 3) include classical cytokines (e.g., TNFα, IL6), chemokines (monocyte chemoattractant protein‐1 (MCP1)), proteins of the alternative complement system (adipsin), and proteins involved in vascular hemostasis (plasminogen activator inhibitor‐1 (PAI1)), the regulation of blood pressure (angiotensinogen), lipid metabolism (cholesteryl ester transfer protein, retinol binding protein‐4), glucose homeostasis (adiponectin), and angiogenesis (vascular endothelial growth factor (VEGF)).
From the wide range of adipokines identified over the past few years, it is apparent that white fat is a secretory organ of considerable complexity communicating extensively with other organs and closely integrated into overall physiological and metabolic control.
Figure 3 Adipokines Adipokines produced and secreted by adipocytes and their role in Type II Diabetes and in the Metabolic Syndrome [28].
L
L
e
e
p
p
t
t
i
i
n
n
An endocrine role for WAT in the regulation of energy balance and other physiological processes has been established through the identification of leptin, the hormone being secreted principally from adipocytes, with actions both centrally (particularly in the hypothalamus) and in peripheral organs.
Leptin (called the Adipocyte Hormone) is the most important protein factor secreted by differentiated mature white adipocytes [29] discovered in 1994 by Friedman and colleagues [25], with the identification of the mutant gene which underlies the development of the Obesity of the ob/ob mouse.
The leptin gene (ob) encodes an 18 kDa protein containing a signal sequence cleaved to produce the mature hormone of molecular weight 16 kDa [25]. Since initial studies indicates white adipose tissue as the unique site of leptin synthesis, it is now recognized that it can be secreted also by brown adipose tissue, the stomach, placenta, mammary gland, ovarian follicles and fetal heart and bone or cartilage, and perhaps even the brain [21, 30]. Anyway, WAT is the main site of leptin production and the major determinant of the level of the circulating hormone; as the amount of body fat increases, the plasma leptin
does and both circulating levels and adipose tissue mRNA expression of leptin [31] are strongly associated with BMI and fat mass in Obesity; conversely, transgenic mice have very low circulating leptin levels [32]. Thus the circulating hormone level is a marker of total body fat mass [33, 34], where the subcutaneous fraction represents about 80% of total fat.
Leptin production in adipose tissue presents differences given by species and developmental stage; in rodents the levels of ob gene expression are highest in the gonadal and perirenal adipose tissue of the mature animal, and lowest in the subcutaneous depots [35], while in humans the subcutaneous tissue exhibits higher levels of ob mRNA than omental fat [36]. Nutritional state influences leptin synthesis in adipose tissue [30]: in fact, ob gene expression is suppressed by fasting (effect reversed on refeeding), such as acute exposure to cold [37] and neurotransmitters as catecholamines, both noradrenaline and adrenaline [30]. On the contrary, several hormones stimulate leptin production: insulin, glucocorticoids and oestrogens and cytokines as TNFα [30].
The hormone has an autocrine and paracrine function in adipose tissue because of the presence of one or more leptin receptor isoforms are found in WAT and in many other tissues [38].
The most important receptor isoform in leptin signaling is found in regions of the brain that represent the major target for leptin: the arcuate nucleus and paraventricular nucleus of the hypothalamus [39, 40] which are associated with the central control of food intake and energy balance.
The main role of leptin is the regulation of energy homeostasis [41] through its interaction with several central neuroendocrine systems, including suppression of neuropeptide Y secretion [42], leading to the inhibition of food intake [43, 44]. Other key effects of the hormone are involved in energy expenditure, in angiogenesis, in the immune system and in sexual maturation in females [45‐48], or in many metabolic processes, such as inhibition of insulin secretion by pancreatic β‐cells, stimulation of glucose transport or coagulation [49‐51].
In addition to its well‐described role in energy balance, the anti‐hyperglycemic actions of leptin are mediated through several different organs. In muscle, leptin improves insulin sensitivity and reduces intra‐myocellular lipid levels through a combination of direct activation of AMP‐activated protein kinase (AMPK) and indirect actions mediated through central neural pathways [52]. As in muscle, leptin also improves insulin sensitivity in the liver, and reduces hepatic intracellular triacylglycerol levels [53].
A
A
d
d
i
i
p
p
o
o
n
n
e
e
c
c
t
t
i
i
n
n
Adiponectin is a 30‐kDa protein highly expressed in adipose tissue, but in contrast to other adipose‐ derived factors, adiponectin acts as an insulin sensitizer hormone toward insulin sensitive tissues. It was identified by several different groups and given various names (apM1, GBP28, AdipoQ and ACRP30) [54] and circulates at great high concentrations (5–10 μg/ml), accounting for 0.01% of all plasma protein, and its blood levels are inversely correlated with body mass. In fact, adiponectin is underexpressed in obese patients with insulin resistance, Type II Diabetes, and in patients with coronary heart disease, and presents an insulin‐sensitizing effect like leptin, stimulating fatty acid oxidation in an AMPK and PPARα ‐dependent manner [55, 56]; adiponectin is involved in the regulation of glucose homeostasis since it ameliorates hyperglycemia reducing hepatic glucose production, by decreasing the expression of two essential gluconeogenesis enzymes: phosphoenolpyruvate carboxykinase (PEPK); and glucose‐6‐phosphatase (G6P) [57].
In addition, adiponectin has a vascular‐protective effect in the atherogenesis process, and could reduce the inflammatory response induced by TNFα [29, 58, 59].
R
R
e
e
t
t
i
i
n
n
o
o
l
l
B
B
i
i
n
n
d
d
i
i
n
n
g
g
P
P
r
r
o
o
t
t
e
e
i
i
n
n
4
4
The Retinol Binding Protein 4 (RBP4) is the only known specific transporter protein for retinol (vitamin A) in the circulation, and its only known function was to deliver retinol to tissues, but Yang et al. in 2005 reported RBP4 is the link between Obesity and insulin resistance and defined its role in impairing insulin sensitivity in insulin‐sensible tissues, such as skeletal muscle and liver [60]. Yang and colleagues generated mice with an adipose‐specific reduction of GLUT4 (adipose GLUT4−/− knockout mice), which develop
liver and skeletal muscle insulin resistance. In this model, plasma levels of insulin and adipokines known to influence insulin sensitivity remain normal, thus suggesting that a circulating factor secreted by adipocytes causes insulin resistance in these mice. RBP4 serum levels are elevated in insulin‐resistant rodents, and in obese or type II diabetic humans; this confirmed that RBP4 was the factor secreted by adipocytes which reduces phosphatidylinositol‐3‐OH kinase (PI3K) signaling in muscle and enhances expression of the gluconeogenic enzyme PEPCK in the liver through a retinol‐dependent mechanism, and thus participating in Type II Diabetes pathophysiology.
F
F
r
r
e
e
e
e
f
f
a
a
t
t
t
t
y
y
a
a
c
c
i
i
d
d
s
s
The most important adipose secreted products are the FFA, the nutrient source released during fasting for the rest of the body. To this aim, the whole effect of circulating FFA is to promote lipid burning as an energy source in most tissues sparing carbohydrate for neurons and red blood cells, which depend on glucose, and thus they are able to regulate glucose homeostasis, reducing adipocyte and muscle glucose uptake and promoting hepatic glucose production [61].
I
I
n
n
f
f
l
l
a
a
m
m
m
m
a
a
t
t
i
i
o
o
n
n
a
a
n
n
d
d
O
O
b
b
e
e
s
s
i
i
t
t
y
y
A recent and striking discovery is that Obesity is associated with a chronic inflammatory response in adipose tissue, characterized by abnormal adipokine production and activation of some pro‐inflammatory signaling pathways, resulting in the induction of several biological markers of inflammation [62]. Conversely, a reduction in body weight is accompanied by a decrease or even a normalization of these biological parameters [63]. The role of fat cells in metabolic dysfunctions has long been considered, but their potential role in an inflammatory process is a new concept and several animal models suggest that these inflammatory processes have a causal relationship with Obesity and insulin resistance, Type II Diabetes and cardio vascular diseases. Several findings have converged to indicate that adipocytes share with immune cells certain properties such as complement activation [64] and pro‐inflammatory cytokine production [65]. Moreover, preadipocytes have the capacity for phagocytosis in response to several stimuli [66] and numerous genes that code for transcription factors, cytokines, inflammatory signaling molecules, and fatty acid transporters essential for adipocyte biology, are also expressed and functional in macrophages [67]. In Obesity, the inflammatory state involves not only adipose tissue, but altered levels of several circulating factors such as an increase in the plasma levels of C‐ reactive protein (CRP), TNFα, IL‐6, and other biological markers of inflammation, suggest an overall inflammatory state [68]. Other adipose‐specific molecules that are involved in the control of energy metabolism also regulate immune responses. Several studies have shown that adipokine production is altered in Obesity, type II Diabetes and Metabolic Syndrome. This is observed for leptin, TNFα, IL‐6, adiponectin and resistin, angiotensinogen, PAI‐1 or visfatin.
T
T
u
u
m
m
o
o
r
r
N
N
e
e
c
c
r
r
o
o
s
s
i
i
s
s
F
F
a
a
c
c
t
t
o
o
r
r
α
α
A major step forward in the recognition of the secretory role of WAT occurred in the early 1990s with the discovery that the proinflammatory cytokine tumor necrosis factor‐α (TNFα) is synthesized and released by adipocytes in rodents and in humans [65]. TNFα expression increases in Obesity, and this cytokine plays an important role in the pathophysiology of insulin resistance (see Introduction‐Insulin Resistance and Type II Diabetes). Moreover, TNFα was shown to have extensive metabolic effects in adipose tissue, including the stimulation of lipolysis and apoptosis [69, 70].
I
I
n
n
t
t
e
e
r
r
l
l
e
e
u
u
k
k
i
i
n
n
6
6
Another classical cytokine expressed by adipose tissue is Interleukin‐6 (IL6), produced by fibroblasts, endothelial cells, monocytes and adipocytes. In Obesity, its production by adipocytes is increased [24] even if in the absence of an acute inflammatory process [71]. Secretion of IL6 from adipose tissue is higher in visceral than in subcutaneous depots (three times more), underlining the fundamental role of central Obesity in cardiovascular diseases. Moreover, IL6 production derives mainly from the stromal vascular fraction (endothelial cells, monocytes/macrophages) rather than from adipocytes themselves [72].
Deleterious effects given by IL6 secretion are due to its diverse target tissues and function. First of all, IL6 controls the hepatic production of inflammatory proteins such as CRP, important cardiovascular risk factor [73]. Moreover, IL6 produced by visceral adipose tissue directly contributes to hypertriglyceridemia by stimulating hepatic secretion of very low‐density lipoproteins (VLDL) [74].
R
R
e
e
s
s
i
i
s
s
t
t
i
i
n
n
Resistin (FIZZ3) is an inflammatory molecule with hyperglycemic action belonging to the family of cysteinerich resistin‐like molecules (RELMs); it was discovered as a secreted product of mouse adipocytes that was repressed by thiazolidinediones [75].
While levels of resistin are elevated in many murine models of Obesity, the role of resistin in humans remain controversial; data suggest that it could be the product of macrophages or other stromal cells within the fat pad [76] and might be involved in reducing glucose uptake by muscles and fat, but poor is known about its effect on the liver. Leptin, in addition to its key role in food intake and energy expenditure also regulates immune processes; although leptin acts mainly at the level of the central nervous system regulating food intake and energy expenditure, there is a relationship between leptin and the lowgrade inflammatory state in Obesity, suggesting that leptin could exert peripheral biological effects [77]. Indeed, leptin is able to control TNFα production and activation by macrophages [78], but the underlying mechanisms have not been clearly identified, and leptin‐deficient mice or humans display an altered immune status [79].
O
O
b
b
e
e
s
s
i
i
t
t
y
y
‐
‐
i
i
n
n
d
d
u
u
c
c
e
e
d
d
I
I
n
n
s
s
u
u
l
l
i
i
n
n
R
R
e
e
s
s
i
i
s
s
t
t
a
a
n
n
c
c
e
e
a
a
n
n
d
d
T
T
y
y
p
p
e
e
I
I
I
I
D
D
i
i
a
a
b
b
e
e
t
t
e
e
s
s
Obesity has been identified as a major causative factor for the insulin resistance and hyperglycemia associated with Diabetes [80], and Obesity‐induced Diabetes is emerging as a global health‐care problem reaching epidemic proportions in the industrialized countries and also increasing in developing nations. Along with Diabetes, there has been a concomitant increase of the incidence of an Obesity‐linked condition, called the Metabolic Syndrome. The Metabolic Syndrome is defined as a clustering of diseases, such as abdominal Obesity, insulin resistance, dyslipidemia, and elevated blood pressure, reflecting overnutrition and sedentary lifestyles [81], associated with a doubling of cardiovascular disease risk and a 5‐fold increased risk for incident Type II Diabetes. Many conditions are directly associated with the Metabolic Syndrome, mainly because of the excess in adiposity and the insulin resistance: Nonalcoholic fatty liver disease, Polycystic ovarian syndrome, Obstructive sleep apnea, Hypogonadism, Lipodystrophy and Microvascular disease.
The most critical factor in the emergence of metabolic diseases is Obesity, since it is responsible for the risk factor common to all the pathologies of the Metabolic Syndrome: the insulin resistance [81].
I
I
n
n
s
s
u
u
l
l
i
i
n
n
R
R
e
e
s
s
i
i
s
s
t
t
a
a
n
n
c
c
e
e
a
a
n
n
d
d
T
T
y
y
p
p
e
e
I
I
I
I
D
D
i
i
a
a
b
b
e
e
t
t
e
e
s
s
Insulin is the principal hormone of glucose homeostasis; it stimulates glucose influx into muscle, glycogen synthesis in the liver and muscle, and fat deposition in adipocytes [82]. Other important actions of insulin include the enhancement of protein synthesis, cell survival and growth, prevention of protein catabolism, and anti‐inflammatory effects [83‐ 86].
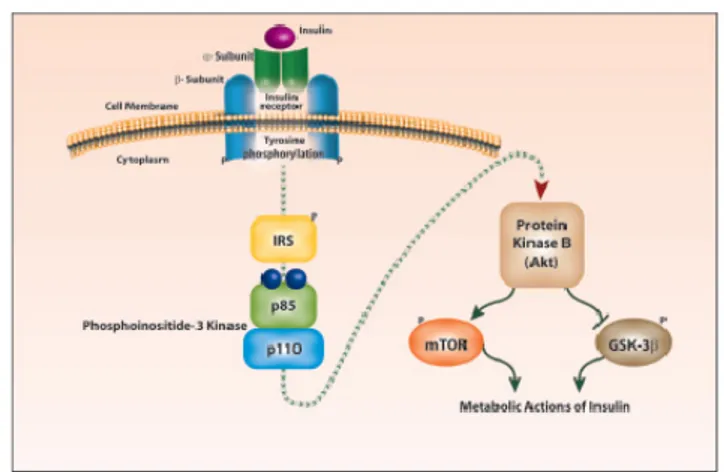
The intracellular insulin signal transduction pathway is summarized in figure 4. The binding of insulin to the α‐subunit of the insulin receptor (IR) molecule induces rapid autophosphorylation of the β subunit, which turns on its tyrosine kinase activity [82]. This gives IR the ability to phosphorylate various tyrosine residues of other cytosolic moieties, including insulin receptor substrates (IRS) 1 and 2. The tyrosine phosphorylation of IRS proteins leads to the second intracellular step of insulin action, the association of phosphorylated IRS1 or IRS2 with the enzyme phosphoinositide‐3‐kinase (PI3K). The IRS‐ activated PI3K in turn affects several downstream signaling pathways through the generation of a lipid second messenger, phosphatidyl‐inositol‐3,4,5‐triphosphosphate, and through the phosphorylation of its critical target, the serine–threonine kinase B (Akt/PKB) [87]. Akt/PKB is the major effector of the IR–IRS‐1–PI3K pathway and drives the metabolic actions of insulin, including glucose transport, glycogen synthesis, fat deposition, and protein synthesis, and also cell growth and cell survival [88].
Fig. 4 Intracellular Insulin Signal Transduction. Insulin binding to the insulin receptor triggers its autophosphorylation and catalyzes the tyrosine phosphorylation of IRS1 and 2. These IRS proteins interact with diverse signaling molecules, including PI3K which in turn activate Akt/PKB. The downstream proteins controlled by Akt/PKB include mTOR) and GSK‐3. The actions of insulin include glucose metabolism, glycogen–lipid–protein synthesis, cell growth and survival [89].
A defect in insulin release by the β‐cell is crucial to the pathogenesis of Type II Diabetes and how insulin resistance causes the onset Type I Diabetes through β‐cell dysfunction and glucotoxicity is actually mainly known. β‐cells are responsible for sensing and secreting the appropriate amount of insulin in response to a glucose stimulus. In healthy individuals, there is a feedback loop between the insulin‐sensitive tissues and the β‐cells, with β‐cells increasing insulin supply in response to demand by the liver, muscles and adipose tissue [90]. In the early stages of Type II Diabetes, euglycemia is maintained and insulin resistance is countered by the continuous insulin production in the pancreas. Progressively, β‐cells fail to respond adequately to blood glucose stimulation, and this importantly contributes to reduce insulin release. As a result of β‐cell dysfunction, decreased insulin secretion determinates disordered regulation of glucose levels by decreasing suppression of hepatic glucose production and reducing the efficiency of glucose uptake in insulin‐sensitive tissues. Decreased insulin output could also impair adipocyte metabolism, resulting in increased lipolysis and elevated FFA levels. Chronic exposure to FFA causes a decrease in insulin secretion and this effect is mediated mainly by lipotoxicity induced apoptosis of islet cells [91]. Moreover, the extremely elevated blood glucose levels observed in diabetes contribute to further disease progression through glucotoxic effects on the β‐cell. Impairments of insulin release may have central effects on metabolic homeostasis: insulin acts in the hypothalamus to regulate body weight, and impaired insulin signaling is associated with changes in food intake and body weight [92]. Thus, β‐cell dysfunction resulting in a relative reduction in insulin release would be expected to result in decreased insulin action in this crucial brain region and be associated with weight gain and an aggravation of insulin resistance.
P
P
a
a
t
t
h
h
o
o
g
g
e
e
n
n
e
e
s
s
i
i
s
s
o
o
f
f
I
I
n
n
s
s
u
u
l
l
i
i
n
n
R
R
e
e
s
s
i
i
s
s
t
t
a
a
n
n
c
c
e
e
Although many is known about the onset of Type II Diabetes starting from an insulin resistant condition, the pathogenesis of Obesity‐induced insulin resistance itself has not been fully elucidated.
As a person gains weight, adipose tissue becomes morphologically and metabolically dysfunctional, with visceral adipocytes particularly affected [93‐95]. These changes contribute to aberrant endocrine function, with multiple potential consequences in terms of metabolic dysfunction, insulin resistance, and cardiovascular disease risk [96]. Central appear to be some of the derangements in insulin signaling caused by the adipose tissue release of FFA, hormones and proinflammatory cytokines [80, 97] which are overproducted in Obesity, but a further fundamental role is attributed to the fat depots distribution, to polymorphism of some key genes and to the marked infiltration of adipose tissue by macrophages associated with Obesity [98, 99].
In an expanded adipose tissue the turnover of FFA is increased, as the process of FFA mobilization (lipolysis) from stores is accelerated [100]. Under normal conditions, insulin inhibits adipose tissue lipolysis; however, in the setting of insulin resistance, insulin is unable to properly suppress lipolysis, resulting in increased circulating FFA levels [101]. Not only insulin resistance appears to cause circulating FFA increase, but the release of FFA may be a critical factor in modulating insulin sensitivity, and many evidences suggest that the visceral adipose depot mainly contributes to increased FFA turnover and insulin resistance [102].
Increased intracellular FFA in peripheral tissues might result in competition with glucose for substrate oxidation, leading to the serial inhibition of three key enzymes of the glucose fatty‐acids cycle[103], and in an increase in the intracellular content of fatty acid metabolites such as diacylglycerol (DAG), fatty acyl‐coenzyme A (fatty acyl‐CoA), and ceramides, which cause serine/threonine phosphorylation of IRS1and IRS‐2, and a reduced
ability of these molecules to activate PI3K [104]. Moreover, the increase in circulating levels of FFA enhances skeletal muscle lipid accumulation, and this has been implicated in the induction of Obesity‐related insulin resistance [105]. In fact, increased lipid accumulation results in activation of protein kinase C θ and the JNK/SAPK pathway, in part through the elevated production of ceramide, which mediates impaired insulin signal transduction in muscle [106, 107].
Among the various adipokines secreted by adipose tissue influencing the insulin signaling, the most important seems to be the RBP4; it induces insulin resistance interfering with the intracellular insulin signaling pathway in muscle, through reduced PI3K signaling, and enhanced expression of the gluconeogenic enzyme Phosphoenolpyruvate Carboxykinase (PEPCK) in the liver through a retinol‐dependent mechanism [60].
Another manner in which adipose tissue contributes to the pathophysiology of insulin resistance is through the excessive release of proinflammatory cytokines. In Obesity, the classic features of acute inflammation tumor, rubor, dolor, calor (swelling, redness, pain, and fever are absent, but chronic inflammation and release of inflammatory cytokines, including TNFα, IL6 and interleukin‐1β (IL1β), is observed. The source of these cytokines in adipose tissue is debated. A report by Ferrante and colleagues [98] suggested the primary role of macrophages infiltration in adipose tissue; adipocyte cell death typical of Obesity is the primary event underlying insulin insensitivity, because it triggers the release of macrophage chemoattractant protein‐1(MCP1) by the adipocyte and recruitment of macrophages in the tissue for clearance purposes; the subsequent macrophages infiltration appears to explain the presence of chronic inflammation [108]. The infiltrating macrophages are implicated in cytokine production, but the role of adipocytes in adipose tissue inflammation development in Obesity has been revalued, since it is now clear that larger fat cells also produce more cytokines [109].
Not only are circulating cytokines from adipose tissue important to insulin action in other tissues such as the liver or skeletal muscle, but paracrine effects of the cytokines may also modify insulin action locally in adipose tissue [110].
In general, factors that negatively influence the intracellular insulin signal transduction act through serine/threonine phosphorylation of IRS1, and this process has two major effects. First, serine/threonine phosphorylated IRS molecules are less able to associate with the insulin receptor and downstream target molecules, especially PI3K (Evans et al. 2005), resulting in impaired insulin action and Akt/PKB activation. Secondly, the serine/threonine phosphorylated forms of IRS molecules are more susceptible to proteasome mediated degradation [111]. Inflammatory cytokines work at the same level. TNFα, through the serine‐phosphorylation of the IRS1, prevents its interaction with the insulin receptor β subunit, and stops the insulin signaling pathway [65]. Subsequently, events downstream of insulin‐receptor signaling are diminished. Moreover, TNF‐α and IL‐6 act through classical receptor‐mediated processes to stimulate both the c‐Jun aminoterminal kinase (JNK) and the IκB kinase‐β (IKK‐β)/nuclear factor‐κB (NF‐κB) pathways, resulting in upregulation of potential mediators of inflammation that can lead to insulin resistance.
The anatomical distribution of fat depots is a critical determinant of insulin. Abdominal obese patients, which have a predominant accumulation of fat in the upper part of the body have also more extensive visceral adipose depots (VAT), and this raises the risk of insulin resistance, Type II Diabetes, and further risk factors of metabolic and cardiovascular diseases [112], given that visceral abdominal adipocytes are more endocrinologically active than subcutaneous adipocytes [95]. Excess of VAT is characterized by anomalies of blood‐glucose homoeostasis, elevated plasma triglycerides and low levels of high‐density lipoprotein (HDL) cholesterol. These disorders are often associated with a prothrombotic and proinflammatory state that contributes to the later appearance of cardiovascular complications.