ScienceDirect
Available online at Available online at www.sciencedirect.comwww.sciencedirect.com
ScienceDirect
Energy Procedia 00 (2017) 000–000
www.elsevier.com/locate/procedia
1876-6102 © 2017 The Authors. Published by Elsevier Ltd.
Peer-review under responsibility of the Scientific Committee of The 15th International Symposium on District Heating and Cooling.
The 15th International Symposium on District Heating and Cooling
Assessing the feasibility of using the heat demand-outdoor
temperature function for a long-term district heat demand forecast
I. Andrić
a,b,c*, A. Pina
a, P. Ferrão
a, J. Fournier
b., B. Lacarrière
c, O. Le Corre
caIN+ Center for Innovation, Technology and Policy Research - Instituto Superior Técnico, Av. Rovisco Pais 1, 1049-001 Lisbon, Portugal bVeolia Recherche & Innovation, 291 Avenue Dreyfous Daniel, 78520 Limay, France
cDépartement Systèmes Énergétiques et Environnement - IMT Atlantique, 4 rue Alfred Kastler, 44300 Nantes, France
Abstract
District heating networks are commonly addressed in the literature as one of the most effective solutions for decreasing the greenhouse gas emissions from the building sector. These systems require high investments which are returned through the heat sales. Due to the changed climate conditions and building renovation policies, heat demand in the future could decrease, prolonging the investment return period.
The main scope of this paper is to assess the feasibility of using the heat demand – outdoor temperature function for heat demand forecast. The district of Alvalade, located in Lisbon (Portugal), was used as a case study. The district is consisted of 665 buildings that vary in both construction period and typology. Three weather scenarios (low, medium, high) and three district renovation scenarios were developed (shallow, intermediate, deep). To estimate the error, obtained heat demand values were compared with results from a dynamic heat demand model, previously developed and validated by the authors.
The results showed that when only weather change is considered, the margin of error could be acceptable for some applications (the error in annual demand was lower than 20% for all weather scenarios considered). However, after introducing renovation scenarios, the error value increased up to 59.5% (depending on the weather and renovation scenarios combination considered). The value of slope coefficient increased on average within the range of 3.8% up to 8% per decade, that corresponds to the decrease in the number of heating hours of 22-139h during the heating season (depending on the combination of weather and renovation scenarios considered). On the other hand, function intercept increased for 7.8-12.7% per decade (depending on the coupled scenarios). The values suggested could be used to modify the function parameters for the scenarios considered, and improve the accuracy of heat demand estimations.
© 2017 The Authors. Published by Elsevier Ltd.
Peer-review under responsibility of the Scientific Committee of The 15th International Symposium on District Heating and Cooling.
Keywords: Heat demand; Forecast; Climate change
Energy Procedia 126 (201709) 282–288
1876-6102 © 2017 The Authors. Published by Elsevier Ltd.
Peer-review under responsibility of the scientific committee of the 72nd Conference of the Italian Thermal Machines Engineering Association
10.1016/j.egypro.2017.08.155
10.1016/j.egypro.2017.08.155 1876-6102
© 2017 The Authors. Published by Elsevier Ltd.
Peer-review under responsibility of the scientific committee of the 72nd Conference of the Italian Thermal Machines Engineering
Association
Available online atwww.sciencedirect.com
ScienceDirect
Energy Procedia 00 (2017) 000–000
www.elsevier.com/locate/procedia
1876-6102 © 2017 The Authors. Published by Elsevier Ltd.
Peer-review under responsibility of the scientific committee of the 72nd Conference of the Italian Thermal Machines Engineering
Association.
72
ndConference of the Italian Thermal Machines Engineering Association, ATI2017, 6-8
September 2017, Lecce, Italy
Development and testing of a platform aimed at pervasive
monitoring of indoor environment and building energy
Massimiliano Scarpa
a*, Rocco Ravagnin
a, Luigi Schibuola
a, Chiara Tambani
aaUniversity IUAV of Venice, Dorsoduro 2206, Venice – 35136, Italy
Abstract
The interest of the building energy sector is leaning towards the measurement of building actual performance, as regards both indoor environment quality and energy consumption. Sensors and central elaboration units aimed at monitoring indoor environment and HVAC system parameters can also provide the basic infrastructure for further applications such as predictive and neuro-fuzzy controls. However, the cost of such systems is high, so they are mainly used in large buildings. This paper describes the main features and expected applications for a low-budget monitoring platform currently under development and tuning. In particular, the monitoring system was developed based on electronic prototyping platform Arduino and on sensors and devices usually available in the retail market of electronics. The monitoring platform has been designed with the following characteristics in mind: replicability, full remote control, portability, versatility, reliability and affordability.
© 2017 The Authors. Published by Elsevier Ltd.
Peer-review under responsibility of the scientific committee of the 72nd Conference of the Italian Thermal Machines Engineering
Association.
Keywords: Monitoring devices; Pervasive monitoring; Internet of Things. 1. Introduction
The rapid development of domotics and building management systems (BMSs) in the building energy sector is stimulating interesting perspectives about the chance to record data from a large amount of buildings, besides usual indoor environment and HVAC system monitoring. Moreover, additional applications might consist in the collection of large quantities of data from which statistical figures about the indoor environment management and energy
* Corresponding author. Tel.: +39-041257-1303
E-mail address: [email protected]
2 Author name / Energy Procedia 00 (2017) 000–000
consumption in buildings could be inferred. For instance, such data might be used to derive building energy evaluation models based on actual energy consumption measurements. However, such applications would require an even higher number of buildings for the achievement of reliable figures and related correlations and that would require long time because of the limited amount of (usually expensive) BMSs installed and because of the difficult synthesis of different data formats resulting from BMSs developed by different manufacturers.
In the frame of this research activity, a low-cost wireless measurement platform is being developed, together with the instructions and schemes aimed at hardware construction and software implementation, in order to aid researchers, professionals and technicians in the replication of this platform.
The hardware developed in this research consists of: · Monitoring Hubs (MHs)
· Monitoring Units (MUs)
Each MH coordinates measurements, supplies energy to up to three MUs, logs measured values on SD cards and uploads/downloads data and settings through Wi-Fi connection. Each MU is managed by the hosting MH and contains all the circuitry needed for measuring a specific parameter. MHs are developed in order to manage many different kinds of MUs and their settings and management behaviour will be defined by the user through a web interface.
Of course, some projects aimed at the development of low cost monitoring platforms already exist. For instance, Open Energy Monitor [1] is a project aimed at the development of open-source energy monitoring tools in the field of energy use and monitoring. Furthermore, WiSensys [2] is a wireless, easy-to-install and ready-to-use sensing system with data logging capability, designed for a variety of sensors, such as temperature, humidity, CO₂ and energy sensors. Also Shah and Mishra [3] developed a customized Internet of Things (IoT) enabled sensing and monitoring platform to monitor temperature, relative humidity and light in the context of building automation. Harfield and Rattanongphisat [4] propose a monitoring platform empowering users to make intelligent decisions about energy efficiency, by sensing temperature, humidity, power and occupancy information about a room and providing services aimed at energy saving and comfort maximization. In the same field but focusing more to energy awareness, Bouhafs and Rajabi [5] present an energy monitoring system offering consumers the possibility to monitor the energy utilization of their appliances and built over a sensor network’s open platform.
Another relevant context for the development of such platforms consists in the monitoring of environmental conditions. For instance, Smart Citizen Platform [6] is a platform aimed at promoting the participation of people by sharing measurements of temperature, humidity, light, sound, CO, NO₂. In the same context, AirSensEUR [7] is an open source platform developed by the Joint Research Centre and a SME specialized in IoT, for monitoring ambient air quality using low-cost sensors. Schima et al. [8] describe the development of a monitoring system covering data collection, data processing and data integration as well as data provision within one infrastructure able to acquire temperature and humidity in space (GPS) and time (real-time clock) as a built in function.
More monitoring platforms have been developed for other contexts, such as civil infrastructure, as shown in [9] and [10], and gardening, with the Open Garden platform [11], allowing the control of the state of the plants by sensing several parameters. Finally, general purpose IoT platforms [12] and health-related IoT platforms are increasingly spreading.
However, most of these sensor platforms are mainly targeted to customers as final users. For this reason, they are mainly marketed through a corresponding web shop and may include customers-oriented services. The measurement platform under development, instead, is mainly aimed at researchers, professionals and technicians in the field of building management and conservation, with the aim to provide very detailed information for the development of basic wireless and web-managed measurement platforms. For this purpose, there is no need to provide web shops or products, but the project will mainly consist in a blog containing detailed instructions and drawings for MHs and MUs development and installation. Measurement networks aimed at research activities are usually designed for the specific scope, with no further extension to other fields. Only Ali et al. [13] are working in this perspective. However, wireless capabilities are in progress in their sensor network, whereas this research activity has been planned since the very beginning with wireless networking in mind.
The measurement platform under development is the subject of this paper. In particular, Section 2 summarizes the main characteristics of the measurement platform under development and Section 3 shows an illustrative measurement taken by means of the first MH and MU developed in the frame of this research activity.
Massimiliano Scarpa et al. / Energy Procedia 126 (201709) 282–288 283
ScienceDirect
Energy Procedia 00 (2017) 000–000
www.elsevier.com/locate/procedia
1876-6102 © 2017 The Authors. Published by Elsevier Ltd.
Peer-review under responsibility of the scientific committee of the 72nd Conference of the Italian Thermal Machines Engineering
Association.
72
ndConference of the Italian Thermal Machines Engineering Association, ATI2017, 6-8
September 2017, Lecce, Italy
Development and testing of a platform aimed at pervasive
monitoring of indoor environment and building energy
Massimiliano Scarpa
a*, Rocco Ravagnin
a, Luigi Schibuola
a, Chiara Tambani
aaUniversity IUAV of Venice, Dorsoduro 2206, Venice – 35136, Italy
Abstract
The interest of the building energy sector is leaning towards the measurement of building actual performance, as regards both indoor environment quality and energy consumption. Sensors and central elaboration units aimed at monitoring indoor environment and HVAC system parameters can also provide the basic infrastructure for further applications such as predictive and neuro-fuzzy controls. However, the cost of such systems is high, so they are mainly used in large buildings. This paper describes the main features and expected applications for a low-budget monitoring platform currently under development and tuning. In particular, the monitoring system was developed based on electronic prototyping platform Arduino and on sensors and devices usually available in the retail market of electronics. The monitoring platform has been designed with the following characteristics in mind: replicability, full remote control, portability, versatility, reliability and affordability.
© 2017 The Authors. Published by Elsevier Ltd.
Peer-review under responsibility of the scientific committee of the 72nd Conference of the Italian Thermal Machines Engineering
Association.
Keywords: Monitoring devices; Pervasive monitoring; Internet of Things. 1. Introduction
The rapid development of domotics and building management systems (BMSs) in the building energy sector is stimulating interesting perspectives about the chance to record data from a large amount of buildings, besides usual indoor environment and HVAC system monitoring. Moreover, additional applications might consist in the collection of large quantities of data from which statistical figures about the indoor environment management and energy
* Corresponding author. Tel.: +39-041257-1303
E-mail address: [email protected]
Available online atwww.sciencedirect.com
ScienceDirect
Energy Procedia 00 (2017) 000–000
www.elsevier.com/locate/procedia
1876-6102 © 2017 The Authors. Published by Elsevier Ltd.
Peer-review under responsibility of the scientific committee of the 72nd Conference of the Italian Thermal Machines Engineering
Association.
72
ndConference of the Italian Thermal Machines Engineering Association, ATI2017, 6-8
September 2017, Lecce, Italy
Development and testing of a platform aimed at pervasive
monitoring of indoor environment and building energy
Massimiliano Scarpa
a*, Rocco Ravagnin
a, Luigi Schibuola
a, Chiara Tambani
aaUniversity IUAV of Venice, Dorsoduro 2206, Venice – 35136, Italy
Abstract
The interest of the building energy sector is leaning towards the measurement of building actual performance, as regards both indoor environment quality and energy consumption. Sensors and central elaboration units aimed at monitoring indoor environment and HVAC system parameters can also provide the basic infrastructure for further applications such as predictive and neuro-fuzzy controls. However, the cost of such systems is high, so they are mainly used in large buildings. This paper describes the main features and expected applications for a low-budget monitoring platform currently under development and tuning. In particular, the monitoring system was developed based on electronic prototyping platform Arduino and on sensors and devices usually available in the retail market of electronics. The monitoring platform has been designed with the following characteristics in mind: replicability, full remote control, portability, versatility, reliability and affordability.
© 2017 The Authors. Published by Elsevier Ltd.
Peer-review under responsibility of the scientific committee of the 72nd Conference of the Italian Thermal Machines Engineering
Association.
Keywords: Monitoring devices; Pervasive monitoring; Internet of Things. 1. Introduction
The rapid development of domotics and building management systems (BMSs) in the building energy sector is stimulating interesting perspectives about the chance to record data from a large amount of buildings, besides usual indoor environment and HVAC system monitoring. Moreover, additional applications might consist in the collection of large quantities of data from which statistical figures about the indoor environment management and energy
* Corresponding author. Tel.: +39-041257-1303
E-mail address: [email protected]
2 Author name / Energy Procedia 00 (2017) 000–000
consumption in buildings could be inferred. For instance, such data might be used to derive building energy evaluation models based on actual energy consumption measurements. However, such applications would require an even higher number of buildings for the achievement of reliable figures and related correlations and that would require long time because of the limited amount of (usually expensive) BMSs installed and because of the difficult synthesis of different data formats resulting from BMSs developed by different manufacturers.
In the frame of this research activity, a low-cost wireless measurement platform is being developed, together with the instructions and schemes aimed at hardware construction and software implementation, in order to aid researchers, professionals and technicians in the replication of this platform.
The hardware developed in this research consists of: · Monitoring Hubs (MHs)
· Monitoring Units (MUs)
Each MH coordinates measurements, supplies energy to up to three MUs, logs measured values on SD cards and uploads/downloads data and settings through Wi-Fi connection. Each MU is managed by the hosting MH and contains all the circuitry needed for measuring a specific parameter. MHs are developed in order to manage many different kinds of MUs and their settings and management behaviour will be defined by the user through a web interface.
Of course, some projects aimed at the development of low cost monitoring platforms already exist. For instance, Open Energy Monitor [1] is a project aimed at the development of open-source energy monitoring tools in the field of energy use and monitoring. Furthermore, WiSensys [2] is a wireless, easy-to-install and ready-to-use sensing system with data logging capability, designed for a variety of sensors, such as temperature, humidity, CO₂ and energy sensors. Also Shah and Mishra [3] developed a customized Internet of Things (IoT) enabled sensing and monitoring platform to monitor temperature, relative humidity and light in the context of building automation. Harfield and Rattanongphisat [4] propose a monitoring platform empowering users to make intelligent decisions about energy efficiency, by sensing temperature, humidity, power and occupancy information about a room and providing services aimed at energy saving and comfort maximization. In the same field but focusing more to energy awareness, Bouhafs and Rajabi [5] present an energy monitoring system offering consumers the possibility to monitor the energy utilization of their appliances and built over a sensor network’s open platform.
Another relevant context for the development of such platforms consists in the monitoring of environmental conditions. For instance, Smart Citizen Platform [6] is a platform aimed at promoting the participation of people by sharing measurements of temperature, humidity, light, sound, CO, NO₂. In the same context, AirSensEUR [7] is an open source platform developed by the Joint Research Centre and a SME specialized in IoT, for monitoring ambient air quality using low-cost sensors. Schima et al. [8] describe the development of a monitoring system covering data collection, data processing and data integration as well as data provision within one infrastructure able to acquire temperature and humidity in space (GPS) and time (real-time clock) as a built in function.
More monitoring platforms have been developed for other contexts, such as civil infrastructure, as shown in [9] and [10], and gardening, with the Open Garden platform [11], allowing the control of the state of the plants by sensing several parameters. Finally, general purpose IoT platforms [12] and health-related IoT platforms are increasingly spreading.
However, most of these sensor platforms are mainly targeted to customers as final users. For this reason, they are mainly marketed through a corresponding web shop and may include customers-oriented services. The measurement platform under development, instead, is mainly aimed at researchers, professionals and technicians in the field of building management and conservation, with the aim to provide very detailed information for the development of basic wireless and web-managed measurement platforms. For this purpose, there is no need to provide web shops or products, but the project will mainly consist in a blog containing detailed instructions and drawings for MHs and MUs development and installation. Measurement networks aimed at research activities are usually designed for the specific scope, with no further extension to other fields. Only Ali et al. [13] are working in this perspective. However, wireless capabilities are in progress in their sensor network, whereas this research activity has been planned since the very beginning with wireless networking in mind.
The measurement platform under development is the subject of this paper. In particular, Section 2 summarizes the main characteristics of the measurement platform under development and Section 3 shows an illustrative measurement taken by means of the first MH and MU developed in the frame of this research activity.
284 Massimiliano Scarpa et al. / Energy Procedia 126 (201709) 282–288Author name / Energy Procedia 00 (2017) 000–000 3
2. Methods
The monitoring platform is being designed with the following characteristics in mind:
- Replicability, achieved by the use of components easily available on the market of electronics as well as by the open source approach, implying a source code repository and the development of detailed documentation to illustrate each phase of hardware construction;
- Full remote control, achieved by the implementation of data upload and device control through Wi-Fi network;
- Versatility, achieved by the development of hardware (and corresponding software) modules able to expand the number of parameters that may be measured;
- Reliability, achieved through easy-to-use connection sockets as well as through circuitry and devices limiting the measurement uncertainty;
- Affordability, achieved by the selection of low cost hardware components and the avoidance of commercial and side costs;
- Portability, achieved by software strategies and hardware aimed at increasing battery life.
The hardware under development in the frame of this research consists of monitoring hubs (MHs) and monitoring units (MUs). Each MH consists of the following main parts:
- 1 microcontroller unit consisting in a very common microcontroller, named ATmega328P and currently used in Arduino Uno Rev. 3;
- 1 energy supply unit (battery and voltage regulator); - 1 SD card reader/writer;
- 1 Wi-Fi module consisting in a cheap and diffuse ESPRESSIF module, named ESP-8266, connecting with the Wi-Fi network, at user-defined time intervals, to upload the measurements logged in the SD card mentioned above and to download the measurement settings defined by the user through a basic RESTful service;
- Circuitry needed for the management and energy supply of (up to three) Mus.
Moreover, the next release of MHs will be integrated with LM4040 voltage reference and 24 bit Analog-Digital Converter (ADC) TI-ADS1252 for accurate reading of low value analog signals.
As mentioned above, MHs are developed in order to manage many different kinds of MUs and their settings and behavior will be user-defined from the web. In fact, in the frame of this research activity, not only the software needed for a proper management of the MHs and MUs is under development, but also basic RESTful services able to log recorded data and transmit user-defined settings to the MHs. Currently, the RESTful service is written in Python and is hosted on a PC operating as a server. The RESTful service will manage the following databases:
- Database of MHs: Each MH will be characterized by a set of characteristics, here included a unique identification code, dates of relevant modifications and general technical specifications;
- Database of MUs: Each MU will be characterized by a set of characteristics, here included a unique identification code, dates of relevant modifications, calibration curves and other general technical specifications;
- Database of settings: The database of settings includes the main data to be exchanged with the MHs for their convenient operation, in particular:
o For each channel of the MH:
§ Unique identification code of the connected MU; § Relevant measurement options, i.e.:
· Time interval of each measurement;
· Sensor warm-up time, to be used for detectors relying on sensor warming up; · Number of readings per measurement;
o State of charge of the MH onboard battery; o Level of MH Wi-Fi signal;
o Time interval for Wi-Fi connection, in order to save battery by limiting the use of the Wi-Fi module. - Database of measures. This database receives and stores the measurements from each MH and includes
simple post-processing, e.g. the use of calibration curves.
4 Author name / Energy Procedia 00 (2017) 000–000
The limited amount of memory available on the microcontroller and the long-run battery target made it necessary to limit the code and actions to be performed by the microcontroller, preferring, where available, the measurement of the sole raw data, which are going to be post-processed by the RESTful service.
Due to the high number of soldering consequent to such a versatile MH architecture and in order to increase the reliability of the platform, printed circuit boards (PCBs) are currently under development, as shown in Fig. 1, where the main components of the master board consist of ATMEGA328 microcontroller (J30), microSD unit (SD), connectors for connections with slave boards, with reference to both shared circuits (U1_PC, U2_PC and U3_PC) and to specific connections (U1_PS, U2_PS and U3_PS), whereas RX_TX, J85, “cer”, “Crys” and “power” provide alimentation and proper operation of the microcontroller.
Fig. 1. Scheme of the Monitoring Hub.
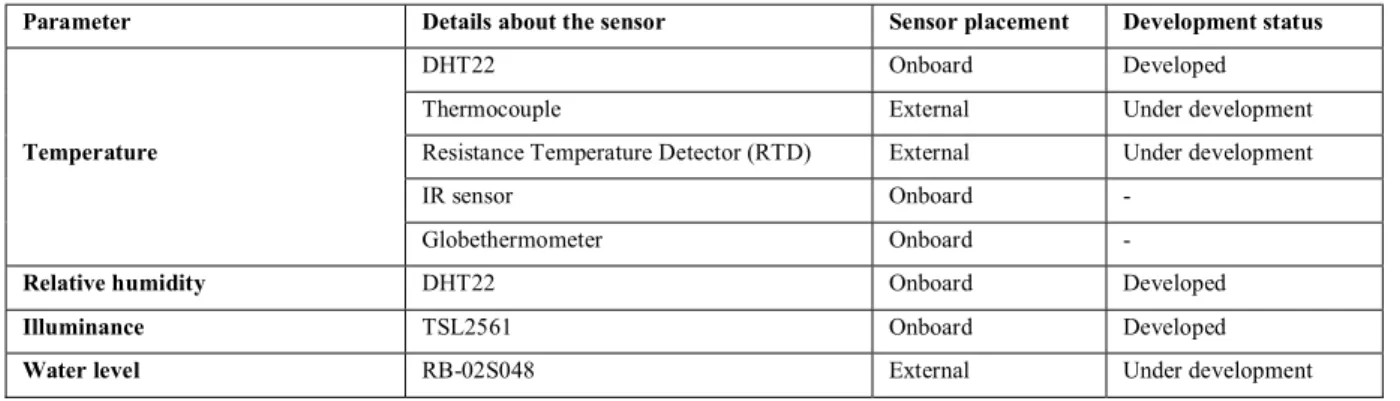
On the other side, each MU is fed and managed by the hosting MH and contains all the circuitry and devices needed for measuring a specific parameter. In particular, the MUs listed in Table 1 are programmed for development in the frame of the present research activity, classified with the current development status level (“Developed”/”Under Development”).
Table 1. MUs programmed and current development.
Parameter Details about the sensor Sensor placement Development status
Temperature
DHT22 Onboard Developed
Thermocouple External Under development
Resistance Temperature Detector (RTD) External Under development
IR sensor Onboard
-Globethermometer Onboard
-Relative humidity DHT22 Onboard Developed
Illuminance TSL2561 Onboard Developed
2. Methods
The monitoring platform is being designed with the following characteristics in mind:
- Replicability, achieved by the use of components easily available on the market of electronics as well as by the open source approach, implying a source code repository and the development of detailed documentation to illustrate each phase of hardware construction;
- Full remote control, achieved by the implementation of data upload and device control through Wi-Fi network;
- Versatility, achieved by the development of hardware (and corresponding software) modules able to expand the number of parameters that may be measured;
- Reliability, achieved through easy-to-use connection sockets as well as through circuitry and devices limiting the measurement uncertainty;
- Affordability, achieved by the selection of low cost hardware components and the avoidance of commercial and side costs;
- Portability, achieved by software strategies and hardware aimed at increasing battery life.
The hardware under development in the frame of this research consists of monitoring hubs (MHs) and monitoring units (MUs). Each MH consists of the following main parts:
- 1 microcontroller unit consisting in a very common microcontroller, named ATmega328P and currently used in Arduino Uno Rev. 3;
- 1 energy supply unit (battery and voltage regulator); - 1 SD card reader/writer;
- 1 Wi-Fi module consisting in a cheap and diffuse ESPRESSIF module, named ESP-8266, connecting with the Wi-Fi network, at user-defined time intervals, to upload the measurements logged in the SD card mentioned above and to download the measurement settings defined by the user through a basic RESTful service;
- Circuitry needed for the management and energy supply of (up to three) Mus.
Moreover, the next release of MHs will be integrated with LM4040 voltage reference and 24 bit Analog-Digital Converter (ADC) TI-ADS1252 for accurate reading of low value analog signals.
As mentioned above, MHs are developed in order to manage many different kinds of MUs and their settings and behavior will be user-defined from the web. In fact, in the frame of this research activity, not only the software needed for a proper management of the MHs and MUs is under development, but also basic RESTful services able to log recorded data and transmit user-defined settings to the MHs. Currently, the RESTful service is written in Python and is hosted on a PC operating as a server. The RESTful service will manage the following databases:
- Database of MHs: Each MH will be characterized by a set of characteristics, here included a unique identification code, dates of relevant modifications and general technical specifications;
- Database of MUs: Each MU will be characterized by a set of characteristics, here included a unique identification code, dates of relevant modifications, calibration curves and other general technical specifications;
- Database of settings: The database of settings includes the main data to be exchanged with the MHs for their convenient operation, in particular:
o For each channel of the MH:
§ Unique identification code of the connected MU; § Relevant measurement options, i.e.:
· Time interval of each measurement;
· Sensor warm-up time, to be used for detectors relying on sensor warming up; · Number of readings per measurement;
o State of charge of the MH onboard battery; o Level of MH Wi-Fi signal;
o Time interval for Wi-Fi connection, in order to save battery by limiting the use of the Wi-Fi module. - Database of measures. This database receives and stores the measurements from each MH and includes
simple post-processing, e.g. the use of calibration curves.
The limited amount of memory available on the microcontroller and the long-run battery target made it necessary to limit the code and actions to be performed by the microcontroller, preferring, where available, the measurement of the sole raw data, which are going to be post-processed by the RESTful service.
Due to the high number of soldering consequent to such a versatile MH architecture and in order to increase the reliability of the platform, printed circuit boards (PCBs) are currently under development, as shown in Fig. 1, where the main components of the master board consist of ATMEGA328 microcontroller (J30), microSD unit (SD), connectors for connections with slave boards, with reference to both shared circuits (U1_PC, U2_PC and U3_PC) and to specific connections (U1_PS, U2_PS and U3_PS), whereas RX_TX, J85, “cer”, “Crys” and “power” provide alimentation and proper operation of the microcontroller.
Fig. 1. Scheme of the Monitoring Hub.
On the other side, each MU is fed and managed by the hosting MH and contains all the circuitry and devices needed for measuring a specific parameter. In particular, the MUs listed in Table 1 are programmed for development in the frame of the present research activity, classified with the current development status level (“Developed”/”Under Development”).
Table 1. MUs programmed and current development.
Parameter Details about the sensor Sensor placement Development status
Temperature
DHT22 Onboard Developed
Thermocouple External Under development
Resistance Temperature Detector (RTD) External Under development
IR sensor Onboard
-Globethermometer Onboard
-Relative humidity DHT22 Onboard Developed
Illuminance TSL2561 Onboard Developed
286 Massimiliano Scarpa et al. / Energy Procedia 126 (201709) 282–288
Author name / Energy Procedia 00 (2017) 000–000 5
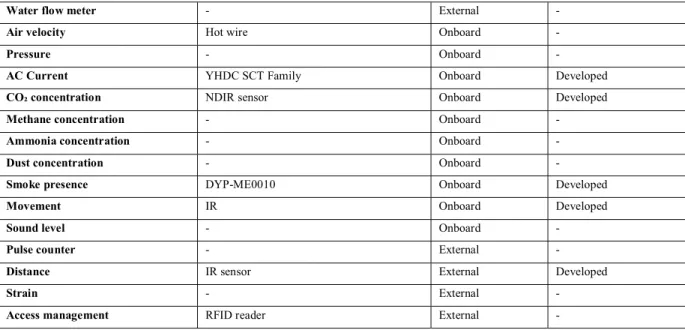
Water flow meter - External
-Air velocity Hot wire Onboard
-Pressure - Onboard
-AC Current YHDC SCT Family Onboard Developed
CO₂ concentration NDIR sensor Onboard Developed
Methane concentration - Onboard
-Ammonia concentration - Onboard
-Dust concentration - Onboard
-Smoke presence DYP-ME0010 Onboard Developed
Movement IR Onboard Developed
Sound level - Onboard
-Pulse counter - External
-Distance IR sensor External Developed
Strain - External
-Access management RFID reader External
-Up to three MUs can be connected with the hosting MH, by means of DA-15 connectors. Each connector is provided with 16 pins (including the connection to ground), which are used for enabling any MU to fully connect and be powered by the connected MH, as follows:
I. Power supply through:
a. Power supply connection at 5V (Pin 01)
b. Onboard MOSFET (Metal-Oxide-Semiconductor Field-Effect Transistor) c. Digital signal for MOSFET activation (Pin 10)
d. Possible 5V-to-3.3V step-down voltage regulator, depending on the sensor voltage requirement e. Connection to ground (Pin 02)
II. Data connection through:
a. Serial Peripheral Interface (SPI): Master Output Slave Input (MOSI, Pin 03), Master Input Slave Output (MISO, Pin 04), Serial Clock (SC, Pin 05) and Slave Select (SS, Pin 11)
b. Inter Integrated Circuit (I2C): Serial Data (SDA, Pin 06) and Serial Clock (SCL, Pin 07) c. Analog channel (Pin 12)
d. Digital channel (Pin 13)
In particular, pins in common among the MUs are grouped between pin 01 and pin 07, while the pins specific for each MU are grouped between pin 10 and pin 13.
This way, each MU port is compatible with any kind of sensor, while the specific MU circuitry and the MH source code enable specific behaviors for each MU sensor kind. In particular, the activation of the convenient source code for the specific MU parameter reading takes place based on the user’s specifications communicated through the RESTful service. This way, the user may select the specific device code, so the corresponding calibration curves and measurement settings will be used. That enables both complete remote control and no cost for the onboard control panel, thus lowering the cost for the platform development.
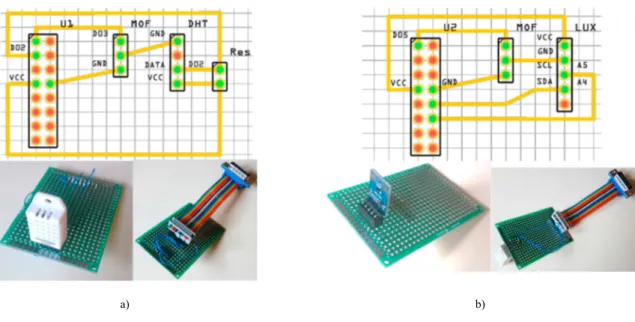
Also for MUs, corresponding PCBs are developed, as illustratively shown in Fig. 2, where the DA-15 connector used as an interface between the MUs and the hosting MH is named U1 and U2.
6 Author name / Energy Procedia 00 (2017) 000–000
a) b)
Fig. 2. Schemes of two illustrative Monitoring Units: DHT22 temperature and relative humidity unit (a) and illuminance unit (b). 3. Results
As a first demonstration of monitoring campaigns performed by means of the measurement platform under development, the profile of CO₂ concentration resulting from a short-term campaign is shown in Fig. 3. This is just the first attempt of monitoring campaign, but two MHs are going to be installed in a historical building, for the monitoring of temperature and relative humidity, aimed at preservation purposes. In this case, the platform will be tested as regards battery life and reliability on the long-term.
Fig. 3. Illustrative profile of CO₂ concentration measured during a short term monitoring campaign. 4. Conclusions
The present paper shows the status of a research activity aimed at the development of budget measurement platforms, presenting its background architecture. Even if the tests currently performed are still not sufficient for a complete verification of the design choices taken, the developed platform looks very promising, thanks to its versatile architecture that is enabling the developers to connect the Monitoring Hub (MH) with a number of
0 500 1000 1500 2000 2500 07:0 0: 00 09:0 5: 00 11:1 0: 00 13:1 5: 00 15:2 0: 00 17:2 5: 00 19:3 0: 00 21:3 5: 00 23:4 0: 00 01:4 5: 00 03:5 0: 00 05:5 5: 00 08:0 0: 00 10:0 5: 00 12:1 0: 00 14:1 5: 00 16:2 0: 00 18:2 5: 00 20:3 0: 00 22:3 5: 00 00:4 0: 00 02:4 5: 00 04:5 0: 00 06:5 5: 00 09:0 0: 00 11:0 5: 00 13:1 0: 00 15:1 5: 00 17:2 0: 00 19:2 5: 00 21:3 0: 00 23:3 5: 00 01:4 0: 00 03:4 5: 00 05:5 0: 00 07:5 5: 00 10:0 0: 00 12:0 5: 00 14:1 0: 00 16:1 5: 00 18:2 0: 00 20:2 5: 00 22:3 0: 00 00:3 5: 00 02:4 0: 00 04:4 5: 00 06:5 0: 00 CO2 con ce ntra tio n [P PM ] Time [h]
Water flow meter - External
-Air velocity Hot wire Onboard
-Pressure - Onboard
-AC Current YHDC SCT Family Onboard Developed
CO₂ concentration NDIR sensor Onboard Developed
Methane concentration - Onboard
-Ammonia concentration - Onboard
-Dust concentration - Onboard
-Smoke presence DYP-ME0010 Onboard Developed
Movement IR Onboard Developed
Sound level - Onboard
-Pulse counter - External
-Distance IR sensor External Developed
Strain - External
-Access management RFID reader External
-Up to three MUs can be connected with the hosting MH, by means of DA-15 connectors. Each connector is provided with 16 pins (including the connection to ground), which are used for enabling any MU to fully connect and be powered by the connected MH, as follows:
I. Power supply through:
a. Power supply connection at 5V (Pin 01)
b. Onboard MOSFET (Metal-Oxide-Semiconductor Field-Effect Transistor) c. Digital signal for MOSFET activation (Pin 10)
d. Possible 5V-to-3.3V step-down voltage regulator, depending on the sensor voltage requirement e. Connection to ground (Pin 02)
II. Data connection through:
a. Serial Peripheral Interface (SPI): Master Output Slave Input (MOSI, Pin 03), Master Input Slave Output (MISO, Pin 04), Serial Clock (SC, Pin 05) and Slave Select (SS, Pin 11)
b. Inter Integrated Circuit (I2C): Serial Data (SDA, Pin 06) and Serial Clock (SCL, Pin 07) c. Analog channel (Pin 12)
d. Digital channel (Pin 13)
In particular, pins in common among the MUs are grouped between pin 01 and pin 07, while the pins specific for each MU are grouped between pin 10 and pin 13.
This way, each MU port is compatible with any kind of sensor, while the specific MU circuitry and the MH source code enable specific behaviors for each MU sensor kind. In particular, the activation of the convenient source code for the specific MU parameter reading takes place based on the user’s specifications communicated through the RESTful service. This way, the user may select the specific device code, so the corresponding calibration curves and measurement settings will be used. That enables both complete remote control and no cost for the onboard control panel, thus lowering the cost for the platform development.
Also for MUs, corresponding PCBs are developed, as illustratively shown in Fig. 2, where the DA-15 connector used as an interface between the MUs and the hosting MH is named U1 and U2.
a) b)
Fig. 2. Schemes of two illustrative Monitoring Units: DHT22 temperature and relative humidity unit (a) and illuminance unit (b). 3. Results
As a first demonstration of monitoring campaigns performed by means of the measurement platform under development, the profile of CO₂ concentration resulting from a short-term campaign is shown in Fig. 3. This is just the first attempt of monitoring campaign, but two MHs are going to be installed in a historical building, for the monitoring of temperature and relative humidity, aimed at preservation purposes. In this case, the platform will be tested as regards battery life and reliability on the long-term.
Fig. 3. Illustrative profile of CO₂ concentration measured during a short term monitoring campaign. 4. Conclusions
The present paper shows the status of a research activity aimed at the development of budget measurement platforms, presenting its background architecture. Even if the tests currently performed are still not sufficient for a complete verification of the design choices taken, the developed platform looks very promising, thanks to its versatile architecture that is enabling the developers to connect the Monitoring Hub (MH) with a number of
0 500 1000 1500 2000 2500 07:0 0: 00 09:0 5: 00 11:1 0: 00 13:1 5: 00 15:2 0: 00 17:2 5: 00 19:3 0: 00 21:3 5: 00 23:4 0: 00 01:4 5: 00 03:5 0: 00 05:5 5: 00 08:0 0: 00 10:0 5: 00 12:1 0: 00 14:1 5: 00 16:2 0: 00 18:2 5: 00 20:3 0: 00 22:3 5: 00 00:4 0: 00 02:4 5: 00 04:5 0: 00 06:5 5: 00 09:0 0: 00 11:0 5: 00 13:1 0: 00 15:1 5: 00 17:2 0: 00 19:2 5: 00 21:3 0: 00 23:3 5: 00 01:4 0: 00 03:4 5: 00 05:5 0: 00 07:5 5: 00 10:0 0: 00 12:0 5: 00 14:1 0: 00 16:1 5: 00 18:2 0: 00 20:2 5: 00 22:3 0: 00 00:3 5: 00 02:4 0: 00 04:4 5: 00 06:5 0: 00 CO2 con ce ntra tio n [P PM ] Time [h]
288 Massimiliano Scarpa et al. / Energy Procedia 126 (201709) 282–288
Author name / Energy Procedia 00 (2017) 000–000 7 Monitoring Units (MUs) aimed at very different measurement purposes. However, longer tests are going to be performed, in historical buildings, and that will be the chance for a first test about reliability and battery life under real world conditions. After these tests, the MH and the MUs schemes and source codes will be improved and made available to researchers, professionals and technicians, in order to test the developed platform in other contexts and bring together further improvements.
References
[1] “Open Energy Monitor - Official site.” [Online]. Available: https://guide.openenergymonitor.org/. [2] “WiSensys - Official site.” [Online]. Available: http://wisensys.com/.
[3] J. Shah and B. Mishra, “Customized IoT Enabled Wireless Sensing and Monitoring Platform for Smart Buildings,” Procedia Technol., vol. 23, pp. 256–263, 2016.
[4] W. Harfield, Antony; Rattanongphisat, “Towards an open monitoring platform for improving energy efficiency and thermal comfort in public buildings,” in 9th International Conference on Knowledge and Smart Technology (KST), 2017, pp. 150–155.
[5] F. Bouhafs and D. Rajabi, “Open sensing platform for HomeEnergy monitoring in the Internet of Things,” Int. J. Eng. Sci, 2013. [6] “Smart Citizen Platform - Official site.” [Online]. Available: https://smartcitizen.me/.
[7] M. Gerboles, L. Spinelle, M. Gerboles, and L. Spinelle, AirSensEUR : an open data / software / hardware multi-sensor platform for air
quality monitoring . Part A : sensor shield. 2015.
[8] R. Schima, T. Goblirsch, R. Misterek, C. Salbach, and U. Schlink, “Open Source Based Sensor Platform for Mobile Environmental Monitoring and Data Acquisition,” Geophys. Res. Abstr., vol. 18, no. June 2015, p. 6891, 2016.
[9] G. Nagayama, Tomomori;Ruiz-Sandoval, Manuel; Spencer, Bill F.;Mechitov, Kirill A.; Agha, “Wireless strain sensor development for civil infrastructure,” in Transactions of the Society of Instrument and Control Engineers, 2004, p. vol. E-3, N. 1, 104/109.
[10] N. Barroca, L. M. Borges, F. J. Velez, F. Monteiro, M. Górski, and J. Castro-Gomes, “Wireless sensor networks for temperature and humidity monitoring within concrete structures,” Constr. Build. Mater., vol. 40, pp. 1156–1166, Mar. 2013.
[11] “Open Garden - Official site.” [Online]. Available: https://www.cooking-hacks.com/documentation/tutorials/open-garden-hydroponics-irrigation-system-sensors-plant-monitoring.
[12] “NerveData - Official site.” [Online]. Available: http://www.nervedata.com/.
[13] A. S. Ali, Z. Zanzinger, D. Debose, and B. Stephens, “Open Source Building Science Sensors (OSBSS): A low-cost Arduino-based platform for long-term indoor environmental data collection,” Build. Environ., vol. 100, pp. 114–126, May 2016.