1
ABSTRACT
Nowadays it is increasing the needs to know the quality and safety of the food products. These requirements call for on-line detection techniques which have the advantages of be assembled in the production line and take place under realistic environment, know early detection of possible failures, have permanent monitoring of the conditions and know assessment of conditions at any desired time.
This study evaluated the feasibility of using a spectral scanner VIS-NIR (DV Srl, version 1.4., Italia) with a detector in the region between 400-1000 nm to predict quality and characterize local varieties of artichoke: “Violetto” and “Catanese” located respectively in the area of San Ferdinando di Puglia and Brindisi (Puglia Region, Italy). The samples were harvested during years 2009/10 from 20 plants for each field, randomly-chosen and labelled in order to reduce field variability among different harvest dates.
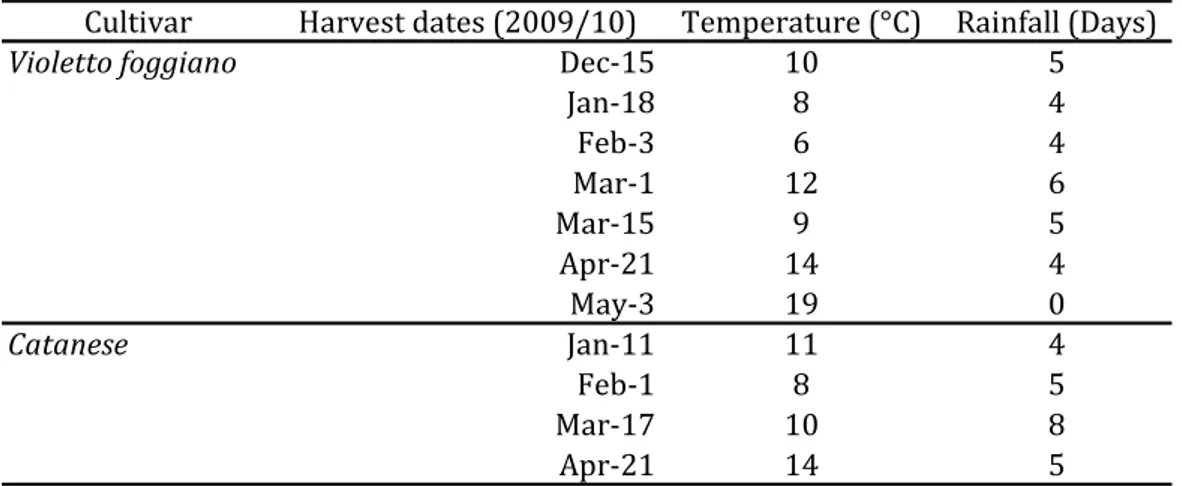
Artichoke heads were harvested from December to May (7 harvest dates) for “Violetto foggiano” and from January to April for “Catanese” (4 harvest dates).
Artichokes were processed and cut into quarters. One quarter for each artichoke was analyzed during storage at day 0, day 2, day 5 and day 7 acquiring hyperspectral images using a hyperspectral imaging system.
Spectral data were analyzed using the Unscrambler packing software version X (CAMO ASA, Oslo, Norway) and PLS toolbox in Matlab (version 2014a). The data set included 736 samples (400 for “Violetto” and 336 for “Catanese”). All the reflectance measurements were firstly transformed to absorbance values using log(1/R) according to the law of Lambert-Beer.
Classification models were built with the aim of discriminate among cultivars, harvest times and day after cut. Two methods were compared: SIMCA (Soft Independent Modelling of Class Analogy) and PLS-DA (Partial least squares discriminant analysis), defining a Training set of 308 samples for “Violetto” and 244 for “Catanese” and a Test set of 92 samples for “Violetto” and 76 for “Catanese”.
In the classification by cultivar (“Violetto” and “Catanese”) the discriminant approach is superior to the class-modeling, mostly because of the two classes have a very similar general profile of the spectrum and one of them (“Violetto”) have an inner variability which encloses the one of the other class (“Catanese”).
Forcing the discrimination, the differences between the two classes are exalted, and the classification is obtained with very interesting results.
For the classification by harvest time, the SIMCA model was developed building individual PCA models for the spectra of each harvest time. Comparing the result coming from the
2
analysis made with SIMCA and PLS model, it is evident how the PLS-DA is the most performing method for this application giving a “non error rate” of 80% on the external test set.
For the classification by days of storage the PLS-DA model has for all the classes high value of specificity, and for some classes low values of sensibility.
The results suggest that is possible to discriminate samples just cut from samples cut and stored for some days, but that is more difficult to exactly separate samples depending on the days of storage. Most likely this is not due to a low efficiency of the model but to the changing proprieties of the samples that are not so dissimilar between 2 and 7 days of storage, but becoming more evident with the passing of the time.
For these analysis “Non Error Rate” values increased reducing the number of classed from 4 to 3: the model performance improved.
Calibration model for phenols content and antioxidant activity was built analyzing for day 0 several pre-treatment (9 for antioxidant activity and 8 for phenols).
Particularly the data of “Harvest Time 1” showed a different behavior compared to the remaining harvest times and for this reason the prediction models were tested on 3 classes: “All Harvest Time”, “Harvest Time 1” and “Other Harvest Time”. The efficiency of the model was always higher when using only sample from “Harvest Time 1”, suggesting that other sources of variation were included in the data set for the following samplings.
The classes “All Harvest Times” and “Other Harvest Times”, for PLS-calibration model, had higher values of R2C and R2CV and low values of RMSEC and RMECV in the wavelength range of 400-1000 nm for both phenols content and antioxidant activity. “Harvest Time 1”, instead, carried out the best value for both (phenols content and antioxidant activity) in the range 650-1000nm (R2pred 0.62 and RMSEP of 72 for phenols, and R2pred 0.67, and RMSEP of 126 for antioxidant activity).
Starting from this considerations and from obtained results it may be interesting to further investigate the effect of the harvest time on the phenolic and antioxidant activity prediction to try to improve prediction results. Moreover also the instrumental setting can be improved, trying to standardize as much as possible the acquisition conditions.
Generally results of this thesis explored new area of research developing tools that may be used to increase the value of local productions, by mean of a better characterization and identification and by providing innovative non destructive-tools to be used online during the minimally processing operations for selecting raw material based also on its internal composition. Key words: Artichoke, SIMCA, PLS-DA, VIS-NIR, phenols, antioxidant activity, classification
3
5
1.1 NUTRITIONAL PROPERTIES OF ARTICHOKES
1.1.1 General information
Artichoke, Cynara cardunculus L. subsp. scolymus (L.) Hayek, (Scientific name: Cynara scolymus L.) is an ancient herbaceous perennial plant (Figure 1.1), originating from the Mediterranean area, which today is widely cultivated all over the world (Bianco, 2005). Artichoke is one of the popular winter season, edible flower bud. It is used as a vegetable and it is well known since ancient times for its medicinal and health benefiting qualities.
The plant grows up to 1.5-2 m tall, with arching, deeply lobed, silvery-green leaves about 0.5 m long. Beautiful light pink flowers develop in a large head from the edible buds.
Each artichoke globe measures about 6-10 cm in diameter and weighs about 150 g. These are not edible anymore if the flower become old, and large in size.
Seed-propagated plants have hypogeous seed germination and produce a conspicuous, thick, fleshy tap-root apparatus. During the vegetative growth, the plant produces a rosette of large, deeply lobed or divided pubescent green-grayish leaves attached to a compressed stem. Leaves differ sensibly among cultivars for their margin, color, shape, length, presence/absence of spines. The base of the stem produces auxiliary buds from which offshoots (suckers) can grow in a variable number, depending both on the variety and on its attitude to the vegetative propagation. Each offshoot produces adventitious roots that initially are mostly fibrous and thick and, during the first year of growth, differentiate fleshy storage organs (rhizomes). In the spring, above the rosette of leaves, an apical or primary bud appears and a floral stem can elongate above 1 m of height. Floral stem induction is influenced both by temperature and photoperiod and the cultivars differ in their requirements of low-temperature and day length. Secondary, tertiary, and higher-order buds develop on branching stems from leaf axis of the primary stem; the primary terminal bud achieves the largest size, this decreasing sequentially for secondary, tertiary and higher-order flower buds. Each vegetative offshoot produces an erect flower-bearing stem (Jacoboni, 1958). The head or capitulum is composed by many florets crowded onto a fleshy receptacle and surrounded by a whorl of multiple rows of bracts, thick and fleshy in basal parts and progressively thinner in upper portions; the outermost bracts are large and fibrous while the inner ones are progressively smaller and tender. The inner tender portions of the receptacle form the ‘heart’ of the globe artichoke (Figure 1.2).
Several cultivars of artichoke grown and are categorized based upon size, color, and presence of the spines.
6
Figure 1.1. Globe artichoke - From http://www.science.howstuffworks.com
Figure 1.2 – Artichoke section.
The number of globe artichoke cultivars grown in the Mediterranean basin and in other parts of the word cannot be easily determined. A cultivar grown in one location is frequently known by other names in other localities (about 14 to indicate “Catanese” globe artichoke) (Bianco, 1990). Therefore, the number of names exceeds that of the actual cultivars. The cultivar composition in Italy, Spain, and France has been extensively studied but it is much less known in other Mediterranean countries. Thirty-seven economically important globe artichoke types have been examinated by Dellacecca et al. (1976). Only 11-12 of them can be considered as being of major
7
commercial importance (Basnizki and Zohary, 1994). The artichoke world collection in Bari (Italy) was subjected to a detailed study of cultivar divergence by multivariate analysis (Porceddu et al., 1976; Vannella et al., 1981), this showed that the majority of the accessions analyzed fall into the following four main groups (Figure 1.3):
A) “Spinoso” (long sharp spines on the bracts and leaves); B) “Violetto” (medium-sized, violet-colored and less spiny heads); C) “Romanesco” (spherical or sub-spherical non-spiny heads);
D)
“Catanese” (small, elongated and non-spiny heads).Figure 1.3 – Typologies of globe artichoke cultivated in Italy (Lo Bianco, 2009)
1.1.2 Nutritional aspects and health benefits of artichoke
Artichoke is widely cultivated for its large immature inflorescences, called capitula or heads, which represent an important component of the Mediterranean diet and is a rich source of health-promoting compounds, mainly bioactive polyphenols, flavonoids and also inulin, fibres and minerals (Lattanzio, 1982; Lattanzio et al., 2005; Lattanzio et al., 2009; Llorach et al., 2002; Orlovskaya et al., 2007).
8
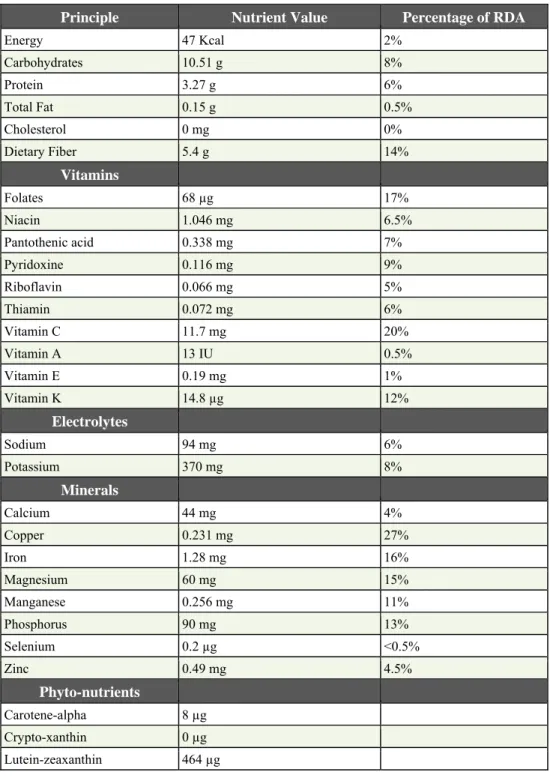
Artichoke is low in calories and fat; 100 g of this flower bud just carries 47 calories. Nonetheless, it is a rich source of dietary fiber and anti-oxidants (Table 1.1.). It provides 5.4 g per 100 g, about 14% of RDA fiber. Dietary-fiber helps control constipation conditions, decreases badly or "LDL" cholesterol levels by binding to it in the intestines and help cut down colon cancer risks by preventing toxic compounds in the food from absorption.
Fresh artichoke is an excellent source of vitamin, folic acid; provides about 68 µg per 100 g (17% of recommended daily allowance). Folic acid acts as a co-factor for enzymes involved in the synthesis of DNA. Scientific studies have proven that adequate levels of folates in the diet during pre-conception period, and during early pregnancy, help prevent neural tube defects in the newborn baby (Kronenberg et al., (2009).
Fresh globes also contain moderate amounts of anti-oxidant vitamin; as-C (about 20% of recommended levels per 100 g). Regular consumption of foods rich in vitamin C helps the body develop resistance against infectious agents and scavenge harmful, pro-inflammatory free radicals from the body.
It is also one of the very good vegetable sources for vitamin K; provide about 12% of DRI. Vitamin K has potential role bone health by promoting osteotrophic (bone formation) activity. Adequate vitamin-K levels in the diet help limiting neuronal damage in the brain; thus, has established role in the treatment of patients suffering from Alzheimer's disease (Parris, 2005).
It is also rich in B-complex group of vitamins such as niacin, vitamin B-6 (pyridoxine), thiamin, and pantothenic acid that are essential for optimum cellular metabolic functions.
Moreover, artichoke is rich source of minerals like copper, calcium, potassium, iron, manganese and phosphorus. Potassium is an important component of cell and body fluids that helps controlling heart rate and blood pressure by countering effects of sodium. Manganese is used by the body as a co-factor for the antioxidant enzyme, superoxide dismutase. Copper is required in the production of red blood cells. Iron is required for red blood cell formation (Horacio et al., 2014).
Additionally, it contains small amounts of antioxidant flavonoid compounds like carotene-beta, lutein, and zea-xanthin.
Depending on the cultivar and harvest time, head weight ranges from 150 to 600 g. The ratio of edible parts to the total weight head is 10–18% for the lower part (receptacle), and about 40% for the core parts (receptacle and inner bracts). Since only the central portion of the capitula is consumed, the ratio of edible fraction/total biomass produced by the plant is very low, being less than 15–20% of total plant biomass. This ratio decreases further if the contribution to the total biomass represented by offshoots, removed from the field by common cultural procedures, is also considered (Marzi and Lattanzio, 1981; Lattanzio, 1982; Lattanzio et al., 2009).
9
Artichokes are a popular winter season vegetables across Europe. Small or baby artichokes can be eaten completely without removing the inside spiny choke.
Table 1.1 – Analysis of nutrients: Artichoke (Cynarascolymus), raw, Nutrition value per 100 g. ORAC value 6552 TE/100 g.
(Source: USDA National Nutrient data base)
Principle Nutrient Value Percentage of RDA
Energy 47 Kcal 2% Carbohydrates 10.51 g 8% Protein 3.27 g 6% Total Fat 0.15 g 0.5% Cholesterol 0 mg 0% Dietary Fiber 5.4 g 14% Vitamins Folates 68 µg 17% Niacin 1.046 mg 6.5% Pantothenic acid 0.338 mg 7% Pyridoxine 0.116 mg 9% Riboflavin 0.066 mg 5% Thiamin 0.072 mg 6% Vitamin C 11.7 mg 20% Vitamin A 13 IU 0.5% Vitamin E 0.19 mg 1% Vitamin K 14.8 µg 12% Electrolytes Sodium 94 mg 6% Potassium 370 mg 8% Minerals Calcium 44 mg 4% Copper 0.231 mg 27% Iron 1.28 mg 16% Magnesium 60 mg 15% Manganese 0.256 mg 11% Phosphorus 90 mg 13% Selenium 0.2 µg <0.5% Zinc 0.49 mg 4.5% Phyto-nutrients Carotene-alpha 8 µg Crypto-xanthin 0 µg Lutein-zeaxanthin 464 µg
10
The edible part is widely consumed raw, boiled, steamed or fried and as a component of many recipes. Within the capitulum only the receptacle is usually considered fully edible, but the bracts, if properly prepared, are edible as well (Lattanzio et al., 2005).
In respect of this chemical composition, the globe artichoke combines good sensory properties with a healthy image, known since Roman times which are linked to their high content of inulin and polyphenolic compounds (Robertfroid, 2005; Holst and Williamson, 2008), which are phytontrients not included in the composition Table 1.1. and that dispite to their minor content are very important for a nutritional point of view.
Inulin is a highly water-soluble carbohydrate, which serves as an alternative storage carbohydrate in the vacuole of approximately 15% of all flowering plant species (Lattanzio et al., 2009). Inulin belongs to a group of fructose-based polysaccharides called fructans, which are not digested in the small intestine because humans lack the enzymes required for hydrolysis of fructans. A reason for the recent interest in inulins is due to the publication of data showing the positive influence on the composition of the gut microflora, and there are indications of beneficial effects on mineral absorption, blood lipid composition, and prevention of colon cancer. In addition, inulin is a low-calorie fiber that has potential for use in the production of low-fat foods (Frehner et al., 1984; Pollock, 1986; Darwen and John, 1989; Pontis, 1990; Carpita et al., 1991; Rapaille et al., 1995; Hellwege et al., 1998; Roberfroid and Delzenne, 1998; Van Loo et al., 1999; Hellwege et al., 2000). Phenolic are heterogeneous group of phytochemicals normally synthesized both during regular plant grown and development and are prominent in fruit and vegetables, where they are important in determining color, appearance, flavor, and taste (Lattanzio, 2003). Polyphenols synthesis and accumulation in plants may be stimulated in response to biotic and abiotic stresses (Beckman, 2000), modifying qualitatively and quantitatively the composition (Falleh et al., 2008). Phenolic compounds form one of the main classes of secondary metabolites, with a large range of structures as shown in Table 1.2: (Harborne, 1980).
Table 1.2 – The major classes of phenolic compounds (from Lattanzio, 2003).
Basic skeleton Class
C6 Simple phenols, Benzoquinones
C6-C1 Phenolic acids
C6-C2 Acetophenones, Phenilacetic acids
C6-C3 Hydroxycinnamic acids, Phenylpropenes, Coumarins, Isocoumarins, Chromones
C6-C4 Naphtoquinones C6-C1-C6 Xanthones C6-C2-C6 Stilbenes, Anthraquinones C6-C3-C6 Flavonoids, Isoflavonoids (C6-C3)2 Lignans, Neolignans (C6-C3-C6)2 Biflavonoids (C6-C3)n Lignins (C6)n Catechol melanins (C6-C3-C6)n Proanthocyanidins
11
The importance of these compounds seems to be linked to their well-established role as a protective pool against oxidative damages caused by free radicals (Racchi et al., 2002; Rice-Evans and Miller, 1996). The action of phenolic as strong antioxidants is due mainly to their redox properties, which allow them to act as reducing agents, hydrogen donators and single oxygen quenchers (Rice-Evans and Miller, 1996). The most abundant phenolic substances reported in artichoke heads belong to the class of hydroxycinnamic acids, such as coumaric (4-hydroxycinnamic acid), ferulic (3-methoxy-4-(4-hydroxycinnamic acid) and caffeoylquinic acid derivatives, particularly chlorogenic acid (5-O-caffeylquinic acid), the most abundant single component (39% of total caffeoylquinic acid contents), 1,5-di-O-caffeoylquinic acid (21%) 3,4-O-dicaffeoylquinic acid (11%), 1,3-O-3,4-O-dicaffeoylquinic acid (Cynarin) (about 1.5%) and 3,5-di-O-caffeoylquinic acid (Lattanzio et al., 1994).
About flavonoids, apigenin and luteolin glycosides have been detected in both leaves and artichoke heads, while anthocyanin pigments are present only in capitula. Anthocyanin pigments are responsible for most of the blue, purple, red and intermediate hues of plant tissues. From a quantitative viewpoint, these compounds are considered minor constituents of the total phenolic content (about 10% or less) of artichoke tissue (Lattanzio et al., 2009).
Due to the high content of phenolics compounds artichoke heads might, therefore, be regarded as a source of dietary antioxidants. (Lattanzio and Linsalata, 2005; Lattanzio 2009 ). In addition, leaves and outer bracts of artichoke heads can be considered as a cheap, as yet unused, source of natural non toxic antioxidants for use in industrial processes (to preserve and stabilize the freshness, nutritive value, flavour and colour of foods.
Phenolic content, profiles of polyphenols and minerals may significantly vary among artichoke plant parts, genotype, and are affected by several physiological and environmental factors. Some studies reported that, in some artichoke cultivars, single polyphenols accumulate preferentially in the edible parts of the heads (Lattazio et al., 2009). Phenolic content decreases during capitula development and content at commercial maturity stage is about half of the content at the early development (Fratianni et al., 2007; Di Venere et al., 2009; Lombardo et al., 2009, 2010, 2011; Pandino et al., 2011a, 2011b).
Several authors reported a different phenol content and composition, and antioxidant activity among heads or leaves of artichoke varieties (Gorny et al., 1999; Fratianni et al, 2007); several studies are available on phenolic components and antioxidant activity of artichokes (Lattanzio et al., 1994; Alamanni et al., 2003; Wang et al., 2003; Brecht et al., 2004; Fratianni et al., 2007, Lattanzio et al., 2009; Lombardo et al., 2010, Coinu et al., 2007; Lutz et al., 2011; Di Venere, personal communication).
12
Phenolic content of artichoke heads is strictly related to winter or spring harvest and is dependent from the climatic conditions (temperature, rainfall, light, etc.) (Lombardo et al., 2010; Di Venere et al., 2005a). Lombardo et al. (2009) found that the different environmental and weather conditions influenced the phenolic bio-synthesis for some artichoke genotypes, and also that there is an inverse relationship between phenol content and tissue age. Some authors reported that the profiles of polyphenols and minerals of some artichoke varieties were significantly different amongst genotype and plant parts (Lombardo et al., 2009, 2010; 2011; Pandino et al., 2011a, 2011b) and some authors reported that phenol content of artichokes harvested in sping decreased compared to artichokes harvested in winter (Massignan et al., 2005; Bianco and Pace, 2009).
1.1.3 Storage condition
Artichoke production is essentially continuous throughout the year, although about 70% of the crop is harvested in a specific part of the year. Fields with winter-spring cycles produce the highest yields, and are continuously harvested from September through May (Lo Bianco, 2009).
Highest quality heads show no violet discoloration on the inner bracts, a short pappus and outer bracts tightly closed and are free of blemishes (Miccolis et al., 1988; Mencarelli et al., 1993). Bract opening, external and internal blackening and wilting are the main factors limiting quality of artichokes during distribution (Escriche et al., 1982).
Artichokes harvested in early production are, normally used for the fresh market, whereas the last part of the late production is industrially processed (canned or frozen).
Delays between harvest and consumption or processing can result in losses of flavor and nutritional quality. Keeping intact fruits and vegetables within their optimum ranges of temperature and relative humidity is the most important factor in maintaining their quality and minimizing postharvest losses during the entire postharvest handling system. Storage temperature and relative humidity are the most important factors in postharvest quality maintenance of fresh produce. Atmospheric modification can be a very useful supplement to providing the proper temperature and relative humidity (Kader, 1990; 2002e; 2004).
Temperature management is the most effective tool for extending the shelf-life of fresh horticultural commodities (Kader, 2002a). Low temperatures (between 0°C and 5°C) together with high relative humidity (90–95% RH) during storage are recommended to maintain quality of artichokes for longer durations (Mencarelli et al., 1993; Suslow and Cantwell, 1997). The storage potential of artichokes is generally less than 21 days as visual and sensory quality deteriorate rapidly (Suslow and Cantwell, 1997), and depend on temperature of storage; some authors have reported even shorter storability that does not exceed 2 weeks at 1–2°C, 10 days at 5°C and 5 days at 10°C
13
with RH > 90% (Saltveit, 1991). Gil et al. (2001) reported that visual quality of artichoke heads decreased considerably during storage at 9°C and 17°C; after 16 days, visual quality was considered acceptable only for artichokes stored at 0°C or 6°C. Another study showed that ‘Blanca de Tudela’ artichokes stored at different temperatures showed significant changes in total phenol contents (Gil-Izquierdo et al., 2001).
Currently, no other postharvest technologies beside temperature and humidity control are applied when storing artichoke heads, and also because they are generally consumed close to the production area.
Relative humidity (RH) can influence water loss, decay development, incidence of some physiological disorders, and uniformity of fruit ripening. The optimum relative humidity during storage of fresh non-fruit vegetables ranges between 95-98% (Kader, 2002b).
The physiological activity of plant tissue continues after harvest inducing wilting phenomena of tissue, a phenomenon primarily due to transpiration, i.e. the transfer of water contained within the plant tissue to the surrounding atmosphere. The dehydration depends on many factors including the temperature and relative humidity of the storage room, the air movement and the packaging material. The decrease in weight may be attributed to respiration and other senescence-related metabolic processes during storage (Watada and Qi, 1999); Agamia (1984) has shown that the weight loss of artichoke heads is due to both respiration and transpiration. Water loss is not only results in direct quantitative losses (loss of salable weigh), but also in losses in appearance (wilting and shriveling), textural quality (softening, flaccidity, limpness, loss of crispness and juiciness) and nutritional quality. The commodity’s dermal system (outer protective coverings) governs the regulation of water loss. The transpiration rate (evaporation of water from the plant tissues) is influenced by internal factors (morphological and anatomical characteristics, surface-to-volume ratio, surface injuries, and maturity stage) and by external, or environmental, factors (temperature, relative humidity, air movement, and atmospheric pressure) (Kader, 2002b). Condensation of moisture on the commodity (sweating) over long periods of time is probably more important in enhancing decay than is the RH of ambient air. Management of relative humidity is very important for storage of artichoke heads, in fact values RH> 95% assure a low weight loss avoiding the loss of turgidity of the outer bracts and of the stem and the wilting of the leaves (Lipton and Stewart, 1963; Suslow and Cantwell, 1997). A study of Leroy et al. (2010) showed that weight loss increased significantly during storage for artichokes stored at 4°C (60% RH) and 18°C (80%RH), while dry matter increased.
Relative humidity can be controlled by one or more of the following procedures: adding moisture (water mist or spray, steam) to air by humidifiers, regulating air movement and ventilation in relation to produce load in the cold storage room, maintaining the refrigeration coils within about
14
1 °C of the air temperature, providing moisture berries that insulate storage room and transit vehicle walls, wetting floors in storage rooms, adding crushed ice in shipping containers or retail displays for commodities that are not injured by the practice, sprinkling produce with water during retail marketing (Kader, 2002b).
One final method to extend storability of fresh produce is the modification of the storage atmosphere by reducing oxygen and increasing carbon dioxide partial pressure (Zhang et al., 2011).
In modified atmospheres (MA) or controlled atmospheres (CA), gasses are removed or added to create an atmospheric composition around the commodity that is different from that of air (78.08% N2, 20.95% O2, and 0.03% CO2). Usually this involves reduction of oxygen (O2) and/or elevation of carbon dioxide (CO2) concentrations. The use of modified or controlled atmospheres should be considered as a supplement to proper temperature and relative humidity management (Table 1.3). The potential for benefit or hazard from using MA depends on the commodity, cultivar or variety, physiological age, atmospheric composition, temperature and duration of storage (Amanatidou et al., 1999; Kader, 2002c; Gorny, 2004; Colelli and Elia, 2009). CO2 is the most important gas in the modified atmosphere packaging of foods, due its bacteriostatic and fungi static properties. It inhibits the growth of the many spoilage bacteria and the inhibition rate is increased with increased CO2 concentrations in the given atmospheres. CO2 is highly soluble in water and fat, and the solubility increases greatly with decreased temperature (Sivertsvik et al., 2002). Atmospheres with low O2 levels inhibit the growth of most aerobic microorganisms, also this contributes to the maintenance of metabolic activities of the product (Farber, 1991; Klieber et al., 1996; Beaudry, 1999; Saltveit, 2003; Soliva-Fortuny et al., 2004).
MAP produces benefits by extending appearance and sensory quality, increasing overall marketability (Table 1.3).
Table 1.3 – Modified Atmosphere Packaging (Gorny, 2004)
Can Cannot
Increase shelf‐life Substitute for Temperature Control
Slow Microbial Growth Stop Microbial Growth
Maintain Nutritional Quality Slow Browning
It aims to the creation of an ideal gas composition within the packaging, which can be directly generated by the commodity respiration, or actively created by flushing a gas mixture within the packaging before sealing it. Once the package is closed, no further control is possible and the gas composition will inevitably change due to produce metabolism and to film barrier properties (Sivertsvik et al., 2002; Gorny, 2004).
15
However, differences between beneficial and harmful atmosphere combinations may be small. One of the mayor problems encountered in using MAP is the accumulation of anaerobic metabolites (i.e. ethanol and acetaldehyde) in the packages: if the O2 level decreases below the fermentation threshold, anaerobic respiration is triggered leading to the production of off-flavors and stimulating the growth of some anaerobic psychotropic pathogens (Oms-Oliu et al., 2009); similarly, high CO2 concentrations can be harmful for vegetal tissues. Also, in some leafy green vegetables, increases in ammonia were observed with high CO2 atmospheres and were associated with darkening of tissues (Cantwell et al., 2009).
A reduction in browning of the outer bracts is the major benefit from CA storage when artichoke buds are stored at temperatures higher than 0°C. However, the effectiveness of CA storage is dependent on bud maturity, cultivar, temperature and the particular atmosphere used (Andre et al., 1980; Rappaport and Watada, 1958; Ryder et al., 1983). Optimal CA conditions vary widely among cultivars, ranging between 1 to 6% O2 and 2 to 7% CO2 (Andre et al., 1980; Escriche et al., 1982; Ryall and Lipton, 1979; Saltveit, 1997). Little or no beneficial effect on quality retention can be obtained by CA storage when artichoke buds are stored at 0°C (Miccolis and Saltveit, 1988). Therefore, no general recommendation can be made for CA storage; studies reported that conditions of 2-3% O2 and 3-5% CO2 delay discoloration of bracts and the onset of decay by a few days at temperatures around 5°C, while atmospheres below 2% O2, fixed as the fermentation threshold, may result in internal blackening of artichokes (Suslow and Cantwell, 1997; 1998). In MAP, the levels of O2 and CO2 within a package depend on the interaction between commodity respiration and the permeability properties of the packaging film and/or microperforations. Yommi et al. (1996; 2001) indicate that packing with HDPE reduced weight loss and extended postharvest life of artichoke heads.
1.2 POTENTIAL USE OF THE ARTICHOKE FOR THE FRESH-CUT
PROCESSING
1.2.1 General information on fresh-cut artichokes
Processing of fruit and vegetables has ever had as its principal objective to extend the shelf-life for a long time, allowing the consumption even during periods of absence of fresh produce. Artichoke heads are traditionally processed as canned (in oil or in brine) or frozen. However, fresh-cut vegetables market has grown rapidly in recent years as a result of changes in
16
consumer attitudes. Currently, consumer needs are principally focused on added-value products, in terms of quality, convenience, nutritional value and ease of preparation (Colelli and Calabrese, 2009). For these reasons, there is a real need to find methods for preservation of minimally processed food products that can gain widespread acceptance by the industry.
Artichoke is a very important crop in Southern Italy, but its use is limited because trimming is time-consuming and complex. In addition, the edible portion is the inner part of the head which is about 15–20% of its fresh weight, and about 50% of the whole head (Lattanzio et al., 2009).
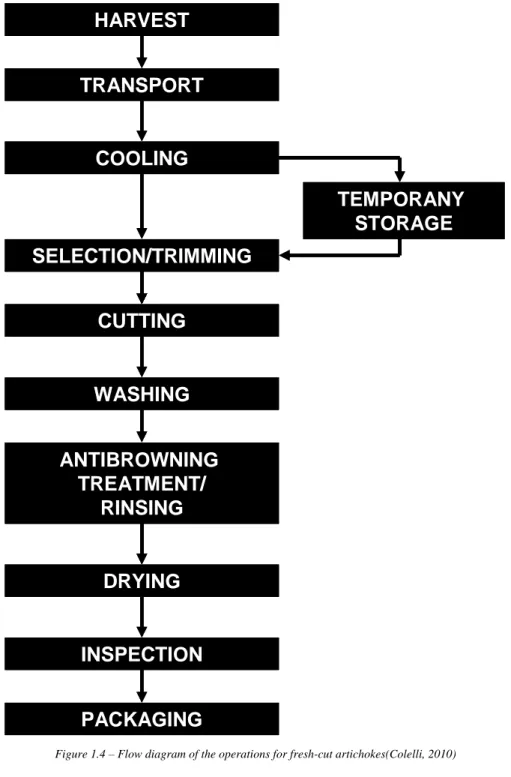
The high percentage of discarded plant waste, together with complex and time-consuming trimming operation, make artichoke processing as a fresh-cut product desirable. The presentation of this vegetable as a minimally processed product, ready to use, would be very convenient for its commercialization, reducing transport costs, storage space and preparation time (Yommi et al., 2001). A potential flow diagram of the operations for fresh-cut artichoke processing is showed in Figure 1.4.
However, fresh-cut artichokes suffer several degradative reactions (especially enzymatic and non-enzymatic browning) mainly related to phenolic compounds, which limit their marketability and the technological transfer of this process.
The shelf-life of fresh-cut of artichoke is, in fact, linked with reference to some operation listed in the flow diagram, in particular the cooling and temporary storage, the antibrowning treatment and the packaging (with particular references to the MAP: Modified Atmosphere Packaging).
Some of these operation have been widely studied in other to find optimal solutions for the implementation of a fresh-cut process.
Few authors studied how to develop the step of antibrowning treatment and packaging in order to improve the fresh-cut artichokes. In general, the major enzyme responsible for the browning reactions is polyphenol oxidase (PPO), a copper containing enzyme which also catalysis the orthohydroxylation of monophenols and the oxidation of o-diphenols to o-quinones (Lee and Whitaker, 1995).
Lattanzio et al. (1989) investigated the use of citric and ascorbic acids to delaying browning of stored artichokes heads; more recently, Giménez et al. (2003) and Del Nobile et al. (2009) tested ascorbic acid dipping and edible coatings containing citric acid, respectively, on minimally processed artichokes. However the use of ascorbic acid and citric acid provides only temporary prevention of browning (Özoglu and Bayindirli, 2002). Recently Amodio et al. (2011), in a study where different compounds were tested, reported that ascorbic acid had little effect on delaying browning of cut artichokes, which could be observed only up to 3 h after cutting, whereas
17
citric acid had a postcutting effect not different from control samples. On the other hand, these authors reported that cysteine at 0.5% was the most effective treatment to prevent browning and its effectiveness was improved by increasing the pH of the solution from 2.2 to 3. On a further study Amodio et al. (2012) observed that fresh-cut artichokes treated with l-cysteine at pH 7 showed best appearance and lowest changes in color attributes, due to the higher inhibition of PPO activity.
HARVEST
TRANSPORT
COOLING
TEMPORANY
STORAGE
SELECTION/TRIMMING
CUTTING
WASHING
ANTIBROWNING
TREATMENT/
RINSING
DRYING
INSPECTION
PACKAGING
HARVEST
TRANSPORT
COOLING
TEMPORANY
STORAGE
SELECTION/TRIMMING
CUTTING
WASHING
ANTIBROWNING
TREATMENT/
RINSING
DRYING
INSPECTION
PACKAGING
18
Non-enzymatic browning reactions are caused by iron-polyphenol complexes: chlorogenic acid, the most representative phenolic compound of artichoke heads, in presence of oxygen forms dark colored complexes with Fe3+, while the same substrate in anoxic conditions forms colorless complexes with Fe2+, but after exposure to air the complex Fe2+ is quickly oxidized to Fe3+ to give colored compounds (Lattanzio, 2003). Also, mechanical wounding enhances a diverse array of enzymatic pathways, many of which are associated with volatile accumulation, such as ammonia, ethanol and acetaldehyde, which leads to darkening of tissues and onset of off-flavors (Salunkhe and Do, 1976; Rolle and Chism, 1987).
The use of modified atmospheres can promote or, otherwise, inhibit this degradative reactions, and differences between beneficial and harmful effects of gas mixtures may be small. Increased levels of CO2 are used in combination with low O2 concentrations to maintain the visual quality of several fresh-cut produce. Carbon dioxide is considered a competitive inhibitor of PPO, but increases in ammonia were observed in leafy tissues stored in high CO2 (Cantwell et al., 2010); similarly, if the O2 level in the package decreases below the fermentation threshold, anaerobic respiration is triggered leading the accumulation of anaerobic metabolites (i.e. ethanol and acetaldehyde) and stimulating the growth of some anaerobic pathogens (Oms-Oliu et al., 2009). The presence of a very high CO2 concentration (25%) in the storage atmosphere have been proved to be deleterious for fresh-cut artichokes (la Zazzera et al., 2012), while only slight beneficial effects were observed for lower concentrations (5 and 15%). Therefore, the avoidance of extreme conditions in terms of CO2 and O2 concentrations within the package should be the main objective when designing a modified atmosphere packaging (MAP) system for fresh-cut artichokes.
Giménez, (et al. 2002) studied the impact of modified atmosphere packaging (MAP), on sensory quality (weight losses, color, texture and sensory acceptability) and on the growth of indicator micro-organisms (mesophiles, psychrotrophs, anaerobic micro-organisms, spore formers, fecal coliforms, Salmonella and Escherichia coli) in minimally processed artichokes packaged with five different films (two PVC and three P-Plus).
The atmospheres obtained, together with the different permeability to water vapor of the films under study, determined the evolution of the visual and microbiological quality of the artichokes.
For most of the batches, no correspondence was found between microbial growth and changes in appearance. Those batches where the equilibrium atmosphere was clearly anaerobic showed microbial counts below the legally established microbiological limits but also showed a rapid loss of sensory quality. On the other hand, some batches with an acceptable sensory evaluation had microbial counts higher than those allowed by the legislation. This last situation is particularly
19
dangerous from a health point of view since it allows the growth of micro-organisms (even pathogens) although the product may seem to be acceptable for consumption.
This lack of correspondence constitutes an important point to be attended to on the microbiological safety of these foods, since the preservation technologies applied allow the prolonging of their sensory characteristics but, at the same time, may favor the growth of micro-organisms.
Moreover the final results may be affected by the thermical history of the product as well as by the harvest date. It has been reported that time and temperature of storage before cutting influenced quality attributes of cut artichokes, but to a different extent depending on the cultivar. “Violetto Foggiano” artichokes benefited from pre-cutting low storage temperature (0°C), whereas “Catanese” showed physiological injuries on outer bract surfaces, where brown spots occurred. In both cases low temperatures during pre-cutting storage (5°C and 0°C) reduced the browning rate of the cut surface which maintained a higher L* value, compared to artichokes stored at 12°C. Moreover, pre-cutting storage at 12°C resulted in a reduction of quality of artichokes due to growth of floral primordial in the form of reddish tissues at the base of the receptacle for both cultivars. Management of storage conditions before cutting is therefore critical in fresh-cut processing operations of artichokes (Ricci et al. 2013).
On the same cultivar, Ricci (et al.2013) studied the effect of harvest date on post-cutting. quality of artichokes. Heads were harvested from December 2009 to May 2010 in 7 harvest dates (for “Violetto”) and from January to April 2010 in 4 harvest dates (for “Catanese”). For both the cultivar harvested in February and analyzed after 7 days of storage, the lowest color variation for bracts and receptacle was observed compared with the other harvesting date.Visual quality of fresh-cut quarters decreased with the progress of the season, and for “Violetto foggiano”, with the decrease of the antioxidant activity. Total phenolic content and antioxidant activity were different among harvest dates for both cultivars studied, and for “Violetto foggiano” showed a significant polynomial trend, denoting 2 phases of antioxidant accumulation from December to February and then from middle of March to May. The natural decline of plants at the end of production may be the reason of the poor quality of cut-artichokes in the last sampling date, and in general, considering the average temperatures at harvest, quality of fresh-cut artichokes could be positively affected by the lowest temperatures occurring in February.
20
1.3 ANALYTICAL METHODS FOR THE MEASURE OF PHENOLS AND
ANTIOXIDANT ACTIVITY
1.3.1 Phenols
The most common methods to analyse total phenolic contents is the Folin–Ciocalteu method (1927), better known as Folin–Ciocalteu reagent (FCR) or also called Gallic Acid Equivalence method (GAE). This method is a colorimetric in vitro assay of phenolic and polyphenolic antioxidants based on the reaction with a mixture of phosphomolybdate and phosphotungstate (Singleton et al., 1999).
The F-C reagent is prepared by first dissolving 100 g of sodium tungstate (Na2WO4*2H2O) and 25 g of sodium Mo (Na2MoO4*2H2O) in 700 mL of distilled water. Then, the solution is acidified with 50 mL of concentrated HCl and 50 mL of 85% phosphoric acid. The acidified solution is boiled for 10 h, cooled, and 150 g of Li2SO4*4H2O is added. The resultant intense yellow solution is the F-C reagent (Huang et al, 2005; Singleton et al., 1999). Although the chemical nature of the F-C reagent has not been elucidated, it is believed to be composed of heteropoly – phosphotungstates – molybdates (Huang et al, 2005). Likewise, the exact chemical nature of the F-C reaction that leads to blue species [possibly (PMoW11O40)4] is unknown and likely to remain so due to its complexity (Singleton et al., 1999). However, it is assumed that the F-C reaction involves sequences of reversible one or two electron reduction reactions (Huang et al, 2005; Singleton et al., 1999; Ainsworth and Gillespie, 2007). From the components of the FC reagent, molybdates are more easily reduced than tungstates, and thus it is suggested that most of the electron-transfer reactions in the assay are between the reductants and the molybdates. During the F-C assay, the reaction between PC and the F-C reagent takes place at a pH of ~ 10, which is reached by adding sodium carbonate. Under those basic conditions, dissociation of a phenolic proton leads to the formation of a phenolate ion, which is capable to reduce the F-C reagent (Huang et al, 2005; Singleton et al., 1999). The intensity of the blue color is than measured spectroscopically at 765 nm.
The reagent does not only measure phenols, since it reacts with any reducing substance. It therefore measures the total reducing capacity of a sample, not just phenolic compounds. This reagent is part of the Lowry protein assay, and will also react with some nitrogen-containing compounds such as hydroxylamine and guanidine (Ikawa et al., 2003). The reagent has also been shown to be reactive towards thiols, many vitamins, the nucleotide base guanine, the trioses glyceraldehyde and dihydroxyacetone, and some inorganic ions. Copper complexation increases the reactivity of phenols towards this reagent (Everette et al., 2003). Due to these reason Sánchez -Rangel et al. (2013) proposed a revisited method to simultaneously quantify TPC value and the
21
ascorbic acid reducing activity in plant food extracts, allowing to correct the value of TOC by subctraticng the contribution of ascorbic acid.
One of the problems about measuring total phenols is that of extraction, since exhaustive treatment with alcoholic and aqueous-alcholic solvent can still leave behind much tannin and other phenolic bound at the cell wall. Measurement of total phenol is therefore often confined in practice to the soluble fraction, which after concentration in vacuum, is made up to a standard volume.
A second problem is that, many different classes of phenol are going to be present in the extract and any method of measurement will be a compromise, since each class of phenol is likely to react differently with any given color reagent. This is also the reason why direct spectrophotometric measurement is usually ruled out, since it is impossible to select only one wavelength for such determinations. Spectrophotometry is only applicable if one class of phenol is predominant.
The development of HPLC techniques has to a large extent provided the means of quantitatively analysis plant of phenolics, since with HPLC it is now possible to determine very accurately the amounts of individual compounds. Although HPLC does not directly provide a determination of total phenol, it is often possible to do this by summation.
The HPLC conditions mainly include the use of C18 reversephased (RP) columns, a binary solvent gradient, and diode array detector or tandem mass spectrometry. The mobile phase usually consists of an aqueous solution of acid and an organic solvent (acetonitrile or methanol). HPLC-mass spectrometry (MS) combines the separation of LC with the selectivity and sensitivity of the MS detector to permit the identification of individual compounds from the complex matrices (Pyrzynska and Sentkowska, 2015). Mass spectrometry (MS) can often be applied directly to a small (0.1 mg) sample of phenolic and is especially useful for determining the molecular weight, preferably in an apparatus which provides precise mass measurement. In the case of labile or involatile phenolics, the method to be preferred is fast atom bombardment (FAB)-MS, where the sample is dissolved in glycerol or thioglycerol before measurement. MS and FAB-MS cause breakdown of the sample, so that a “fragmentation” pattern is usually obtainable, which will give additional structural information.
1.3.2 Antioxidant activity
ABTS is an analytical method that uses a type measure spectrophotometrically to determine the antioxidant capacity of a sample. Using a spectrophotometer UV-Vis is measured the absorbance of a solution containing the radical ABTS+, generated by oxidation dell'ABST (2,2'-azinobis (3-etilbenzotiazolin-6-sulfonate), a colorless substance that in a chemical configuration of
22
radical is colored absorbing at characteristic wavelengths of the visible range. The addition to the solution of ABTS+ (Figure 1.5 of antioxidant molecules, that may acts transferring or hydrogen or an electron, cause the reduction of the radical to form colorless and the discoloration of the reaction mixture. This discoloration, proportional to the quantity of antioxidant present, can be measured as decrease of absorbance during a fixed period and at a specific wavelength (734 nm). The antioxidant capacity is expressed by comparison with the absorbance values measured with known amounts of an antioxidant molecule selected as the reference standard, which is usually ascorbic acid or Trolox, a cell-permeable, water-soluble derivative of vitamin E, (in this case we speak of antioxidant activity TEAC Trolox Equivalent antioxidant Capacity), (Re et al., 1998).
The measure of the antioxidant based on the use dell'ABTS has the advantage to be simple and rapid. Moreover, ABTS allows the measurement of both hydrophilic and lipophilic antioxidants in a wide pH range. However, it is necessary to remember that the radical employed (ABTS+) is not physiological and is not present in biological systems and often it is highlighted issues of repeatability of the measurement due to the reaction kinetics of the different antioxidants involved.
Figure 1.5 – ABTS and Oxygen Radical
The FRAP test measures the reducing capacity of antioxidants against the Iron ions. It is a method based on the transfer of electrons, in which iron ions pass from Fe3+ to Fe2+. In certain conditions of pH (3.6) and with the availability of TPTZ (2,4,6-tris (2-pyridyl) -s-triazine), these ions form complexes with different characteristics, in particular the derivative reduced (Fe2+-TPTZ) takes on a blue color that has an absorption maximum at 593 nm measured by spectrophotometry (Figure 1.6). The reducing ability of an antioxidant can then be measured as a variation in
23
absorbance of the solution containing the oxidant to the wavelength established for comparison with the variation relative to a standard (for example Ascorbic acid).
Figure 1.6 – TPTZ (2,4,6-tris (2-pyridyl) -s-triazine)
The FRAP test has been created for the measurement of the reducing power of the plasma, (Benzie and Strain, 1996) but it was then adapted to test the antioxidant capacity of pure mixtures and complex matrices. Since this method allows to evaluate only the reducing capacity through the transfer of electrons, completely ignoring the action of antioxidants that act via hydrogen transfer, it does not allow to measure the contribution of molecules, such as thiols and proteins that have a role antioxidant fundamental in biological fluids (for example blood). The advantage coming from the use of this method is that it is one of the most simple, quick and less expensive for the determination of antioxidant capacity in vitro.
The 2,2-diphenyl-1-picrilidrazile (DPPH), Figure 1.7, is a nitrogen radical very stable and commercially available, characterized by an intense red-purple coloring, which loses color when reduced in the presence of a molecule with antioxidant capacity. Using spectrophotometric measurement at 517 nm of the absorbance variation of the DPPH solution after reaction with an antioxidant mixture, it is possible to quantify the reducing capacity of the substance tested if it is acting with the transfer of hydrogen or if it is acting with the transfer of electrons. The result is generally expressed as IC50: the quantity of antioxidant able to reduce of 50% the initial concentration of DPPH.
It is a quick, simple and economical. The limits of this analytical technique are given by the possibility that the results of the analysis are distorted in the case in which the molecules under consideration absorb in the same range of the wavelength of the DPPH radical or in the presence of large molecules that do not sterically bulky arrive to react with the reactive part of the radical. This determines that the DPPH reacts with antioxidants up to 1000 times more slowly than peroxyl radicals (Borset et al., 1994).
24
Figure 1.7 – DPPH reduction
1.4 NOT DESTRUCTIVE QUALITY EVALUATIONS
Generally, for determination of fruits and vegetables maturity index and composition, analysis are destructive and involve a considerable amount of manual work and can require sophisticated equipment. In recent years, quality and safety are the key factor in modern food industry, so researches have been focused on the development of non-destructive techniques suitable to increase the number of fruit pieces that can be analyzed, which can be repeated more times on the same sample during its physiological evolution, and can allow to achieve real-time information (Costa et al., 2009).
1.4.1 Overview of the most common techniques
Optical sensing technologies have been investigated as potential tools for non-destructive evaluation and inspection for food quality and safety. In particularly, hyperspectral imaging (or imaging spectroscopy) (Sun, Da-Wen, 2010), which is based on two mature technologies of imaging and spectroscopy (Sun, Da-Wen, 2008), have been widely studied and developed, resulting in many successful applications in the food industry.
There is also other imaging techniques as Magnetic resonance imaging, Soft X-ray imaging, Ultrasound imaging, Thermal imaging and Fluorescence imaging.
Nuclear magnetic resonance (NMR) is a unique technology that measures the magnetic properties of spins that can then be related to the physical or chemical properties of subjects. With the NMR technique applying an external magnetic field the physical process of radiation aborbtion by the nucleus, whose magnetic moment is not zero, is studied. Detectors receive the NMR signals
25
released as electromagnetic radiation; these signals can then be sent to the computer and be converted into the image through data processing. Magnetical Resonance Image (MRI) machines make use of the fact that food tissue contains lots of water which gets aligned in a large magnetic field. Each water molecule has two hydrogen nuclei or protons. When food is put in a powerful magnetic field, the average magnetic moment of many protons becomes aligned with the direction of the field. A radio frequency transmitter is briefly turned on, producing a varying electromagnetic field. This electromagnetic field has just the right frequency, known as the resonance frequency, to be absorbed and flip the spin of the protons in the magnetic field. After the electromagnetic field is turned off, the spins of the protons return to thermodynamic equilibrium and the bulk magnetization becomes re-aligned with the static magnetic field. During this relaxation, a radio-frequency signal is generated and can be measured with receiver coils. Information about the origin of the signal in 3D space (Koeckenberger et al., 2004) can be learned by applying additional magnetic fields during the scan. A 3D image is compiled from multiple 2D images, which are produced from any plane of view. The image can be rotated and manipulated to be better able to detect tiny changes of structures within the food object. These fields, generated by passing electric currents through gradient coils, make the magnetic field strength vary depending on the position within the magnet. Because this makes the frequency of the released radio signal also depend on its origin in a predictable manner, the distribution of protons in the food can be mathematically recovered from the signal, typically using the inverse Fourier transformation. In the images, each pixel value reflects the NMR-signal intensity of a voxel in the measured material, which relates with the resonance density and the two main parameters (i.e., relaxation time: T1 and T2).
MRI shows the image of the object structure making its physical and chemical information visible. In brief, the MRI system includes (Mariette, 2004):
the magnet and power-supply equipment that can produce a wide range of uniform, stable and constant magnetic field;
a set of gradient magnetic field coil, a controller and power-driven equipment; a radio-frequency (RF) system;
a computer system with large storage capacity for data collection and processing; some auxiliary equipment.
MRI being a non-invasive technique, find application to retrieve structural information from plants and fruits (Gruwel et al., 2013), as for example to study growth and ripening of grapes since it allows to obtain the volume and the soluble solids distribution within a cluster (Andaur et al., 2004) and for detecting fluid flow (Scheenen et al., 2002; 2007) in typical vascular structures such as xylem and phloem.
26
X-ray, also called roentgen ray, is electromagnetic radiation with a wavelength range of 0.01–10 nm. The photon energy of an X-ray is in the range of 0.1–120 keV, which leads to strong penetrability.
X-ray, similar to other electromagnetic waves, can show the following phenomena: reflection, refraction, scattering, interference, diffraction, polarization and absorption. Usually, X-rays whose photon energy is up to about 10 keV (10–0.10 nm wavelength) are classified as ‘‘soft’’ X-rays, and those of 10–120 keV (0.10–0.01 nm wavelength) are ‘‘hard’’ X-rays, due to their penetrating abilities. As hard X-rays pollute food, only the soft XRI technique is used in food inspection.
The principle of soft XRI inspection is based on the density of the product and the contaminant, as shown in Figure 1.8 (a). As an X-ray penetrates a food product, it loses some of its energy. A dense area, such as contaminant, will reduce the energy even further. As the X-ray exits the product, it reaches a sensor. The sensor then converts the energy signal into an image of the interior of the food product. Foreign matter appears as a darker shade of grey that helps to identify foreign contaminants. The soft X-ray inspection system, as shown in Figure 1.8 (b), mainly comprises a computer-controlled X-ray generator (i.e. X-ray source tube), a line-scanning sensor for X-ray detection, conveying belt, stepping motor, image-acquisition card and computer. As a rapid, non-invasive assessment technique, XRI also produces 3D information that can be manipulated numerically.
Figure 1.8 – Principle of soft X-ray imaging (a) and the soft X-ray inspection system (b), Chen et al., 2013
XRI is relatively cheap to use and simple in accessibility. Unfortunately this technique has material restrictions, such as for ferromagnetic metals (Bischof et al., 2007), difficulty to recognize objects whose density is similar to that of water and cannot detect hair, paper and plastics. On the other side, X-ray is very effective for investigating the internal condition of foods (Morita et al.,
27
2003). X-rays have strong penetration ability, so the image can directly reflect internal defects of food and agriculture products, and structural organization changes in quality.
There are several application on food industry. Mousavi (et al., 2005; 2007) demonstrated the capability of an X-ray as a non-destructive technique to characterize the ice-crystal microstructure of mycoprotein products after freezing; Mendoza (et al., 2010), studied the shelf-life of frozen products, while many applications have been developed for the detection of foreign materials in foods (deboned poultry, packaged dry foods and fish bones in fish fillets (Tao et al., 2001; Kwon et al., 2008; Narvankar et al., 2009; Mery et al.; 2011).
Ultrasound Imaging implies mechanical waves at frequencies above 20 kHz, which is beyond the upper limit of the human auditory acoustic frequency range (viz 20–20000 Hz). They are propagated by vibration of the particles in the medium and may be reflected and transmitted when they pass from one medium to another (Cho et al. 2003). Detailed information about the different physical properties of materials can be acquired through the amount of energy reflected or transmitted through the objects depending on their relative acoustic impedances. In addition, the time-of-flight and the speed can also indicate a material property or changes in material characteristics, since ultrasound velocity depends on the density and the elastic property of the medium (Povey et al. 1988). Like light waves, incident ultrasound captures objects, and ultrasound energy attenuation differs for the internal structure of an object to produce a different echo, which leads to a series of points of light displayed on the screen, that is, the ultrasound image. Primarily, the image contrast depends on differences in densities and speeds of the sound, because these properties determine the scattering and the reflectivity of tissue.
Thermal Imaging (TI) is an emerging, non-invasive analytical tool suitable for the food industry. The basic principle of TI is that all materials, above the absolute zero temperature (0 K), emit IR radiation, which is a band of invisible light with wavelengths of 0.75–100 μm. IR radiation can be divided into five regions: near (0.75–2.5 μm), short wave (1.4–3 μm), mid (3–8 μm), long wave (>8 μm) and extreme (15–100 μm).
TI is not only a non-invasive, but also a non-contact system of recording thermal distribution by measuring IR radiation emitted by a body surface to produce a pseudo image of the temperature distribution of the surface (Arora et al., 2008).
Thermal images can be obtained using passive or active TI systems. Passive thermography refers to TI without applying any external energy to the object; the features of interest are naturally at a higher or lower temperature than the background. Active thermography requires the application of thermal energy to produce a thermal contrast between the feature of interest and the background.
TI systems typically comprise the following components: camera, an optical system (e.g., focusing lens, collimating lenses, and filters), detector array (e.g., microbolometers), signal
28
processing, and image-processing system. TI does not require an illumination source, but integrated systems for active thermography measurements contain a heating or cooling unit to provide a thermal differential. In TI cameras, the IR energy emitted from an object under investigation is converted into an electrical signal via IR detectors and displayed as a monochrome or color thermal image. The image-acquisition speed of the approach may be high enough (e.g., 50–60 images/s) to explore rapidly changing thermal conditions (Rahkonen and Jokela, 2003).
TI, originally developed for military applications and for surveillance in night vision, was used in various fields, including medicine, materials science and fire safety. Actually is a system suitable also for the food industry, due to their portability, real-time imaging, and non-contact temperature-measurement capability (Goedeken et al., 1991; Ibarra et al., 2000; Varith et al., 2003; Vereycken et al., 2003; Fuller et al, 1998; Gariepy et al., 1989; Nanni Costa et al., 2010; Wang et al., 2006; FIto et al., 2004; Manickavasagan et al., 2006; Manickavasagan et al., 2008; Meinlschmidt and Maergner, 2002).
Limitations and disadvantages of thermography are the price higher than visible-spectrum counterparts, the difficulties to interpret accurately when based upon certain objects, specifically objects with erratic temperatures, the accuracy of the camera (±2% in most case) that is lower than the contact methods and the thermal influence on the test of the ambient.
Fluorescence is the emission of light by a substance that has absorbed light or other electromagnetic radiation. It is a form of luminescence. In most cases, the emitted light has a longer wavelength, and therefore lower energy, than the absorbed radiation. Fluorescence will disappear immediately without the incident light. There are two kinds of fluorescence, which are autofluorescence and fluorescence with the help of fluorescent pigment.
1.4.2 Techniques VIS -NIR
Visible and near infrared (VIS-NIR) spectroscopy is widely used for rapid, low-cost and non-destructive analysis of inner properties of fruits. The use of VIS-NIR technology have been extensively used for prediction of SSC, pH, acidity, phenols and antioxidant activity of fruits and vegetables (Cozzolino et al., 2004; 2006; Nicolai et al., 2007).
Near infrared radiation was discovered by Friedrich Wilhelm Herschel in 1800 (Davies, 2000) and covers by definition the wavelength range from 780 to 2500 nm. When radiation hits a sample, the incident radiation may be reflected, absorbed or transmitted, and the relative contribution of each phenomenon depends on the chemical constitution and physical parameters of the sample.
29
Reflection is due to three different phenomena. Specular reflection causes gloss, whereas external diffuse reflection is induced by rough surfaces. Both only provide information about the surface of the sample. Scattering results from multiple refractions at phase changes inside the material. The main scattering elements in fruit and vegetables are the cell wall interfaces since they induce abrupt changes in refractive index (McGlone et al., 1997), but suspended particles, such as starch granules, chloroplasts and mitochondria may also induce scattering caused by diffraction at the particle surface where the refractive index is different from that of the surroundings (Il’yasov and Krasnikov, 1991). The scattering is also dependent on the size, the shape and microstructure of the particles. Scattering may also appear due to heterogeneities, such as pores, openings, capillaries that are randomly distributed through the sample. Multiple scattering events largely determine the intensity of the scattered light that is emitted (McGlone et al., 1997). The scattering process affects the intensity level of the reflected spectrum rather than the shape; the latter is more related to the absorption process.
Most of the absorption bands in the near infrared region are overtone or combination bands of the fundamental absorption bands in the infrared region of the electromagnetic spectrum, which are due to vibrational and rotational transitions. In large molecules and in complex mixtures, such as foods, the multiple bands and the effect of peak-broadening, result in NIR spectra that have a broad envelope with few sharp peaks. The spectra are clearly very similar and are dominated by the water spectrum with overtone bands of the OH-bonds at 760, 970 and 1450 nm and a combination band at 1940 nm (Polessello and Giangiacomo, 1981). This similarity is the reason why sophisticated multivariate statistical techniques are essential to extract useful information from an NIR spectrum.
The equipment to perform the NIR analysis is the NIR spectrophotometer that consists of a light source (usually a tungsten halogen light bulb), sample presentation accessory, monochromator, detector, and optical components, such as lenses, collimators, beam splitters, integrating spheres and optical fibers. Spectrophotometers are conveniently classified according to the type of monochromator.
NIR spectroscopy was first used in agricultural applications by Norris (1964) to measure moisture in grain. Since then it has been used for rapid analysis of mainly moisture, protein and fat content of a wide variety of agricultural and food products (Davies and Grant, 1987; Gunasekaran and Irudayaraj, 2001). Early applications in horticulture focused on dry matter content of onions (Birth et al., 1985), soluble solids content (SSC) of apples (Bellon-Maurel, 1992) and water content of mushrooms (Roy et al., 1993), but then many other applications have followed. As the propagation of NIR radiation in fruit and vegetable tissues is affected by their microstructure, it was soon discovered that NIR spectroscopy could also be used to measure microstructure-related attributes, such as stiffness (Lammertyn et al., 1998), internal damage (Clark et al., 2003a,b), and
30
even sensory attributes (Mehinagic et al., 2004). Recent developments which extend the potential of NIR spectroscopy further include multi- and hyperspectral imaging techniques which also provide spatial information (Martinsen and Schaare, 1998; Lu, 2003) and time-resolved spectroscopy which allows measurement of absorption and scattering processes separately (Cubeddu et al., 2001).
The increasing importance of NIR spectroscopy in postharvest technology is linked with the fact that many manufacturers of on-line grading lines have now implemented NIR systems to measure various quality attributes.
1.4.3 Hyperspectral images
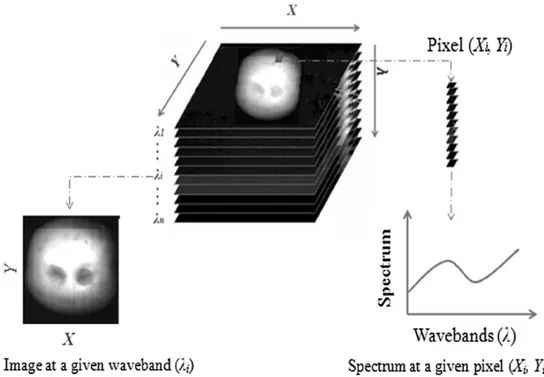
Hyperspectral imaging, known also as chemical or spectroscopic imaging, is an emerging technique that integrates conventional imaging and spectroscopy to attain both spatial and spectral information from an object (Gowen et al., 2007), which are both critical to the detection of food safety and to the evaluation of food quality attributes. A typical hyperspectral system consists of a light source, a wavelength dispersion device, and detector. The images are acquired over the visible and near-infrared (or infrared) wavelengths to specify the complete wavelength spectrum of a sample at each point in the imaging plane. These images are then combined and form a three dimensional hyperspectral cube, with two dimensions for describing spatial information (X and Y) and the third one for spectral information. In this hypercube, each spectral pixel corresponds to a spectral signature (or spectrum) of the corresponding spatial region, recording the entire measured spectrum of the imaged spatial points (Figure 1.9). Therefore the measured spectrum indicates the ability of the sample in absorbing or scattering the exciting light, representing the inherent chemical properties of a sample. As a result, the technology provides us with unprecedented detection capabilities, which otherwise cannot be achieved with either imaging or spectroscopy alone, providing information on where is what (Sun, Da-Wen, 2010).
When a fruit is exposed to light, the reflected radiation can be measured and recoded as a reflectance spectrum. This spectrum is related to chemical composition of the fruit, and spectra collected from fruit at different quality levels can therefore be quite different (Elmasry et al., 2007).
Hyperspectral imaging techniques have received much attention for food quality and safety evaluation and inspection. Many approaches and applications have shown the usefulness of hyperspectral imaging in the food industry (Sun, Da-Wen, 2008).
31
Figure 1.9 – Hypercube showing the relationship between spectral and spatial dimensions - Chen et al., 2013
Hyperspectral imaging technique has been for soluble solid content, bitter pit, bruise and surface defects and contaminations in apple fruit, (Mehl et al., 2004; Peri et al., 2005; Xing et al., 2005; Nicolaï et al., 2006), for the citrus fruit inspection (Moltó et al., 2010.), to predict the sugar content distribution in melons (Sugiyama and Tsuta, 2010), for measuring ripening of tomatoes (Polder and van der Heijden, 2010), for quality evaluation of mushroom (Gowen et al., 2010.), to detect defects of pickling cucumber (Ariana and Lu, 2010), to measure soluble solid content and firmness of strawberries and blueberries (Nagata et al., 2005; Leiva-Valenzuelaa et al., 2013), to monitor ripening on peaches and on banana (Lleó et al., 2011; Rajkumar et al, 2012) and to identify hidden bruise on kiwifruits (Qianga and Mingjie, 2012).
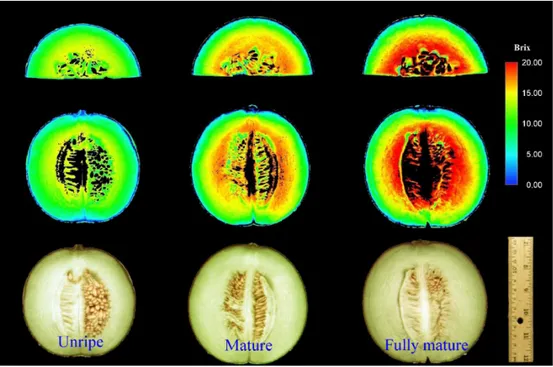
Sometime it is necessary quantify the presence of substance and monitor the changes (increase or decrease) function of the epoch. Figure 1.11 shows the possibility to analyze the sugar distribution in a fruit like melon; the output from of the analysis is a map of the brix grade. The concentration of the substance defines univocally a color in the scale of color; so it is possible define a scale of color for each degree of Brix degree.
32
Figure 1.10 – RGB and monochromatic images (550 nm, 660 nm and 950 nm) of various mandarins (cv. Clemenules) - (Moltó, et al., 2010.)