Proceedings of the 17th International Conference on Soil Mechanics and Geotechnical Engineering M. Hamza et al. (Eds.)
© 2009 IOS Press.
doi:10.3233/978-1-60750-031-5-1698
1698
Landslide triggering experiment in a steep forested slope in Switzerland
Essai de déclenchement d'un glissement de terrain sur une pente forestière escarpée en Suisse
Sarah Springman, Peter Kienzler, Francesca Casini, Amin Askarinejad
Affiliation: ETH Zurich Email: [email protected]
ABSTRACT
A landslide triggering experiment was carried out on a 37°- 40° steep forest slope in North-East Switzerland by sprinkling water artificially to represent an extreme rainfall event. This project is part of a multidisciplinary collaboration, which includes geotechnical engineering, hydrology, hydrogeology, forest engineering, geophysics and photogrammetry. A three dimensional model of the ground was developed from non-invasive geophysical surveys, insitu probing, combined sprinkling and dye tracer tests and shallow test pits. Laboratory tests were carried out on undisturbed samples under various degrees of saturation This paper mainly focuses on the characterisation of the site. .
RÉSUMÉ
Un essai de déclenchement d'un glissement de terrain a été réalisé sur un versant forestier incliné à 37°-40° dans le nord-est de la Suisse par aspersion d'eau pour représenter un événement pluvieux extrême. Ce projet fait partie d'une collaboration multidisciplinaire qui comprend l'ingénierie géotechnique, l'hydrologie, l'hydrogéologie, le génie forestier, la géophysique et de la photogrammétrie. Un modèle tridimensionnel du sous-sol a été développé à partir de levés géophysiques, d'échantillonage in situ, de la combinaison d'essais d'arrosage et de traçage ainsi que de sondages peu profonds. Les tests en laboratoire ont été effectués sur des échantillons saturés et non saturés. Ce papier se concentre sur la caractérisation du site.
Keywords : characterisation, field test, triggering, slope instability, infiltration, groundwater flow, vegetation
1 INTRODUCTION
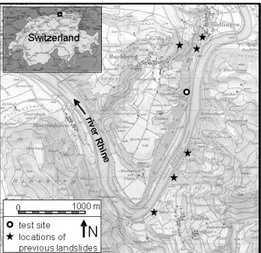
A series of 42 landslides had occurred in May 2002 in North East Switzerland along the river Rhine (Fig. 1), after an extreme rainfall event, in which 100 mm rain fell in 40 minutes (Fischer et al. 2003) .
Figure 1. Location of the test site. (a) detailed map and map of Switzerland (after Sieber, 2000)
A landslide triggering experiment was carried out nearby in autumn 2008 on a steep elongated, forested slope by sprinkling water artificially to represent an extreme rainfall event. During the preliminary investigations into feasibility, sandstone was
located at a depth of between 0.5 m to more than 5 m along the 30 m x 7.5 m plan section, located between stands of mature trees. Increasing clay content was noted in the overlying silty sand, which was loosely packed, with high macroporosity and primarily vertical drainage down to rock.
Sprinkling tests were performed to evaluate the in-situ infiltration characteristics alongside an extensive review of the reinforcing effects of the vegetation (Schwarz and Rickli, 2008). Electrical resistance tomography and ground penetrating radar were conducted to produce a three dimensional model of the ground accompanied (Gambazzi and Suski, 2008) by insitu probing, and shallow test pits. Triaxial and oedometer tests were carried out on undisturbed samples under various degrees of saturation and the results confirmed the vulnerability of this slope to failure. An extensive instrumentation plan was designed to measure deformation during the experiment, from the surface and within the soil, combined with detailed hydrological measurements of soil suction, ground water level and soil water content and investigation of subsurface flow paths by means of tracer experiments and hillslope trenching. 2 GEOMETRY
The selected experimental area is located on an east facing slope on the banks of the river Rhine. The altitude is about 350 masl. The average gradient was determined using a total station theodolite to be 38° with maximum of 43° in the middle of the slope. The surface is slightly concave; the middle longitudinal line is 0.3 to 0.5 m lower than the sides, except that the slope drains marginally to the north at the bottom.
S. Springman et al. / Landslide Triggering Experiment in a Steep Forested Slope in Switzerland 1699 3 VEGETATION
The experimental slope was originally covered by forest, with covertures of circa 80%, heights of 5-20 m. Shrubs up to 1-5 m high and a free herb, layer each cover circa 50% of the surface. The preliminary root reinforcement was quantified by Schwarz and Rickli, (2008), using measured distribution of the roots, standard models and samples for small field tension tests.
Figure 2. Test site plan showing dimensions and position of test pits 4 GEOLOGY
The site is located in the Swiss lowlands and consists mainly of Molasse, which is the sediment that was deposited in the foreland basin of the Alps. The Molasse consists of alternate layers of sea deposits under the Tethys Sea (Seawater Molasse) and land deposits (Freshwater Molasse). Several augured samples as well as an outcrop of the bedrock about 20 m above the selected field revealed horizontal layering of the (fine grained sand- and marlstone) sedimentary rocks at the experimental slope (Tacher and Locker, 2008).
5 INFILTRATION CHARACTERISTICS
The saturation and drainage characteristics of a slope may exert a major control on the prevention, or triggering, as well as the shape of any failure. Depending on the efficiency of preferential flow, and on how this flow is initiated, soils saturate differently (Kienzler & Naef, 2008). Therefore, infiltration characteristics at the Ruedlingen experimental slope were evaluated with combined sprinkling and dye tracer tests. The experiments were replicated across three different locations near to the investigated area (TP 3, TP 4, TP 5; Fig. 2). A small-scale sprinkling apparatus was used, which covers a circular area of 1 m2 (Fig. 3). Uniform sprinkling with an intensity of 60 mm h-1 was achieved with a 360° - spray nozzle. 120 l water was sprinkled in 2 hours at TP 3 and TP 5 each, and 300 l were sprinkled in 5 hours at TP 4. A metallic ring was driven 10 cm into the soil to enclose the sprinkled area and the transition between the soil and the ring was sealed with clay. An outlet at the lowest point of the ring collected overland flow and was connected to a 100 ml - tipping bucket, which recorded the flow. Brilliant Blue food dye was added in a concentration of 4 g l-1 to the sprinkling water to visualise infiltration flow paths. This tracer was used in several vadose zone hydrological studies, as it provides low toxicity, high mobility and high visibility (e.g. Flury et al., 1994). On the consecutive day to sprinkling, three vertical soil sections were excavated to a depth of 1.2 m. Spacing between the sections was 15 - 20 cm. The soil profiles were carefully prepared with a spatula and recorded
photographically under daylight conditions. Dye patterns were analysed according to Weiler & Naef (2003).
The experiments revealed a high infiltration capacity of the soil. No overland flow was observed during the sprinkling at any of the three locations. After excavation, flow paths of the infiltrated water were clearly visible by the dye patterns (Fig. 4). In all of the prepared soil profiles, staining of the soil was mainly homogeneous and little preferential flow was visible. Limited infiltration was detected at TP 4 and TP 5 at the transition between subsoil and weathered bedrock at 1 m to 1.2 m depth. Here, staining of the soil occurred parallel to the ground surface (Fig. 4), which points to lateral flow as a consequence of perched saturation above the less permeable sandstone. Deeper percolation into the Molasse sandstone was revealed by the observation of several stained joints below the subsoil in TP 4 and TP 5 (Fig. 5). In TP 3, staining of the soil was restricted to the uppermost 1.2 m and did not reach the transition to bedrock that started only at 1.5 m depth.
Figure 3. Small-scale sprinkling apparatus for the combined sprinkling and dye tracer experiments
Figure 4. Dye pattern in the middle section of TP5
Figure 5. Stained fracture below the subsoil at TP4
In summary, the dye patterns showed complete and homogeneous saturation of the whole soil profile with only little preferential drainage and with perched saturation above the sandstone bedrock. With regard to the planned landslide triggering experiment, these results confirmed the high
S. Springman et al. / Landslide Triggering Experiment in a Steep Forested Slope in Switzerland 1700 4.3 4.2 7.7 8.5 25.8 25.2 30.9 30.1 26.9 31.6 67.2 67.4 60.3 61.1 60.9 56.4 6 10.5 1.1 3.7 1.5 2.8 3.2 2.7 0% 20% 40% 60% 80% 100% 30 50 60 72.5 80 97.5 110 152.5 190 225 D ept h be lo w gr ound l ev el z ( cm)
clay (%) silt (%) sand (%) gravel (%)
vulnerability of the slope to failure and led to expectations of a more deep-seated failure above the transition to bedrock rather than a more surficial failure that is typical for many rainfall-induced landslides (Springman et al., 2003). However, stained fractures below the subsoil revealed that substantial drainage might occur into the bedrock, which may prevent complete saturation and failure of the instrumented slope.
6 PROBING
Dynamic probing tests were applied every 2 m around the test field, with some transverse sections as well, in order to locate the depth of bedrock. The probing was done with the DPL (Dynamic Probing Light) method, which operates with a 10 kg weight, dropped over 50 cm, generating energy of 50 kJ to drive rods and cone. The cone diameter is d=35.7 mm, tip angle 90° and cross section of 10 cm2. The penetration rate of the cone allows mechanical resistance of the soil to be evaluated empirically. The number of blows required for each 10 cm was counted, and the criterion for locating the underlying bedrock was set to 30 blows per 10 cm penetration. Two profiles of the DPL probings near the middle of the slope are shown in Fig. 6 with orientation in Fig. 7.
Figure 6. Two DPL profiles on the left for N10,DPL, halfway up the slope
According to the “DIN 4094” standard, different formulas are valid in different materials for transformation of N10,DPL to
N30,SPT. In clean sand above the water table, this transformation
is done via the Dynamic Probing Heavy (DPH) method and the Standard Penetration Test (SPT).
N10, DPH=0.34*N10,DPL for 3<=N10,DPL<=50
(1) N30,SPT=1.4*N10,DPH
Based on the above equations and the correlations between SPT number and the soil density (e.g. Terzaghi and Peck, 1967), the state of the soil was found to vary from “very loose” (top soil) to “medium dense”.
According to the DPL results, the bedrock level is reached between 0.5 m to more than 5 m. Bedrock on the right side of the field is shallower than on the left side (Fig. 7). The bedrock appears to be much shallower in the lower part of the field. At this point, the gradient of the slope is less steep (ca. 25°). The results show that there is a ridge in the rock along the middle longitudinal line of the field. These results agree well with those of the geophysical Electrical Resistivity Tomography (ERT) survey (Gambazzi and Suski, 2008).
Based on the rounded rocks observed in TP 4 and 5 (Fig. 4), there is a possibility that the” bedrock” detected by the dynamic probing may be an accumulation of big boulders that fell from higher points up the slope and that the soil fills the space between them.aboratory characterisation
The behaviour of soil was investigated under saturated and unsaturated conditions. Soil was collected from the TPs at different depths. The grain size distributions with depth for TP 1
are shown in Fig. 8. The physical properties of the soil, at the time of sampling, are shown in Fig. 9 and the mean properties are summarised in Table 1.
The clay fraction increases with depth from 4% at shallow depths to 10% at around 2 m. The silt fraction also increases with depth from 25% to 32%, while the sand decreases from 67% to 56% (Fig. 8). The clay is active (Fig. 9) in the upper part (IA>1.25) and is normal below 1 m depth (0.75< IA<1.25). The
soil can be classified as medium-low plasticity silty sand (ML) according with USCS. The fines content will play a significant role in the behaviour of slopes, and on the mode of failure, because the strength, amount and rate of infiltration, and therefore the change in degree of saturation are strongly influenced by the fines content.
Figure 7. The 3D shape of the bedrock based on DPL results (dimensions in metres)
Figure 8. Grain size distribution with depth (TP 1) Table 1. Mean physical properties of soil (TP 1)
w (%) IP (%) γs (kN/m3) γ (kN/m3) e (-) Sr (%) 19.6 9.9 25.8 16.7 0.85 60.6
The soil Water Retention Curve (WRC) which links suction (s = ua
-uw, ua pore air pressure uw pore water pressure) and degree of
saturation Sr, was obtained using a Fredlund Oedometer
(Perez-Garcia et al., 2008) under suction controlled conditions for a natural sample at a depth z = 120-130cm from TP3 (Fig. 10). The air entry value is located between 0-5 kPa, which is consistent with the WRC expected for a sandy soil (Casini et al., 2008a & b).
S. Springman et al. / Landslide Triggering Experiment in a Steep Forested Slope in Switzerland 1701 0 20 40 60 80 100 120 140 160 180 200 0 1IA 2(-)3 4 IA IA=0.75 IA=1.25 0 20 40 60 80 100 120 140 160 180 200 0 10 20 30 40 w (%), Ip (%) D ep th b elow g ro un d le ve l z ( cm ) w (%) wL (%) wP (%) IP(%) 0 20 40 60 80 100 120 140 160 180 200 0 1IA 2(-)3 4 IA IA=0.75 IA=1.25 0 20 40 60 80 100 120 140 160 180 200 0 10 20 30 40 w (%), Ip (%) D ep th b elow g ro un d le ve l z ( cm ) w (%) wL (%) wP (%) IP(%) 1 10 100 40 50 60 70 80 90 100 Sr=Vw/Vv (%) Su ct io n s ( kP a) z=120-130cmTP3 0.50 0.55 0.60 0.65 0.70 0.75 0.80 0.85 0.90 0.95 10 100 1000 vert.eff.stress σ'v (kPa) e= Vv /Vs saturated w=20% saturated saturated w=17% 1 10 100 40 50 60 70 80 90 100 Sr=Vw/Vv (%) Su ct io n s ( kP a) z=120-130cmTP3 0.50 0.55 0.60 0.65 0.70 0.75 0.80 0.85 0.90 0.95 10 100 1000 vert.eff.stress σ'v (kPa) e= Vv /Vs saturated w=20% saturated saturated w=17%
Four oedometer tests were performed with a standard oedometer on undisturbed samples from TP 2, at various depths. The comparison between data from saturated and unsaturated specimens (at the same depth) exhibit the structure induced from partial saturation. The compressibility parameters from the oedometric tests are reported in Table 2.
Figure 9 Variation of physical properties with depth (TP1)
(a)
(b) Figure 10 (a) Water Retention Curve on a natural sample (e = 0.8 TP 3) (b) Oedometric compression curves in saturated and unsaturated conditions on natural samples (from TP 2 & TP 3, depths 85-130 cm) Table 2. Compressibility parameters
σ'vL (kPa) Cc (-) Cs (-)
Saturated 40 0.25 0.016
Unsaturated (w=20%) 80 0.14 0.012
Five triaxial tests were also performed: three CIUC tests (a-b-c) and two CIDC tests (d-e) (Fig. 11). The results from the tests are consistent with behaviour of a silty sand (critical state parameter M=1.28; angle of friction ϕ’=32°). The properties of the samples are reported in Table 3.
Figure 11. Triaxial tests on saturated undisturbed soil samples: results in the p’-q planes
Table 3. Sample properties for triaxial tests
Test w0 (%) e0 (-) ksat (m/s) p’c (kPa) stress path a 20 0.79 - 25 Und. b 16 0.82 1.5*10-7 50 Und. c 17.4 0.95 - 75 Und. d 15 0.78 6*10-6 90 Drain. e 18 0.81 4*10-8 100 Drain. 7 CONCLUSIONS
The preliminary characterisation of an experimental site has been reported including information obtained from test pits, insitu probing, sprinkling, dye tracer tests and a series of laboratory tests. A first artificial rainfall experiment was conducted in October 2008 and a second will follow in March 2009.
ACKNOWLEDGEMENTS
This research was funded by the Competence Centre for Environment and Sustainability (CCES) within the framework of the TRAMM - Project. Marco Sperl, Ernst Bleiker and Rico Borrellini helped with the fieldwork. We are grateful to the Gemeinde Ruedlingen and their President Katy Leutenegger for giving permission to carry out this experiment on their land. REFERENCES
American Society for Testing and Materials, 1985, D 2487-83 Classification of Soils for Engineering Purposes: Annual Book of ASTM Standards. Vol.04.08:395-408.
Casini, F., Kienzler, P., Askarinejad, A., Springman, S.M., 2008a. Report Ruedlingen-Characterisation. Report: IGT CCES-TRAMM 14p.
Casini, F., Kienzler, P., Askarinejad, A., Springman, S.M., 2008b. Report Ruedlingen-Laboratory results. Report: IGT CCES-TRAMM 13p.
Deutsches Institut fuer Normung, 2003, Subsoil - Field testing - Part 2: Borehole dynamic probing (DIN 4094-2).
Fischer, C., López, J.; Springman, S.M. 2003. Remediation of an eroded steep slope in weathered sandstone after a major rainstorm. International Conference on Landslides, Hong Kong, pp. 878-883. Flury, M., Flühler H., Jury W.A., Leuenberger J. 1994. Susceptibility of
soils to preferential flow of water: A field study. Water Resources Research, 30, 7: 1945-1954.
Gambazzi, F., Suski, B., 2008. Electrical Resistivity Tomography Ruedlingen. STEP-UNIL CCES TRAMM meeting.
Kienzler P.M., Naef F. 2008. Subsurface storm flow formation at different hillslopes and implications for the "old water paradox". Hydrological Processes, 22, 1: 104-116.
Perez-Garcia, N., Houston, S.L., Houston, W.N., Padilla, J.M. 2008. An oedometer–type Pressure Plate SWCC Apparatus. Geotechnical Testing Journal 31: 1-9.
Schwarz, M., Rickli, C. 2008. Characterisation of the vegetation cover at the test site of Ruedlingen. Internal GEOLEP CCES-TRAMM report.
Sieber, R., (2000). Atlas der Schweiz–interaktiv: karten zur Bevölkerungsentwicklung, Bundesamt für Landestopographie, Wabern.
Springman, S. M,. Jommi, C., Teysseire P., 2003. Instabilities on moraine slopes induced by loss of suction: a case history. Géotechnique 53, 1: 3-10.
Tacher, L., Locher, D. 2008. Geological Characterization of the Buchberg field site (Ruedlingen). Internal TRAMM report. Terzaghi, K., and Peck, R.B., 1967. “Soil Mechanics in Engineering
Practice” 2nd ed. John Wiley and Sons, New York.
Weiler M, Naef F. 2003. An experimental tracer study of the role of macropores in infiltration in grassland soils. Hydrological Processes 17, 477-493. http://www.cces.ethz.ch/projects/hazri/tramm http://www.swiss-experiment.ch/index.php/TRAMM:Home 0 50 100 150 200 250 300 0 50 100 150 200 p'=(σ'1+σ'2+σ'3)/3 (kPa) q = σ1 -σ 3 (k P a ) Test a(und.z=30-50cmTP3) Test b(und.z=65-80cmTP3) Test c(und.z=50-65cmTP5) Test d(und.z=30-50cmTP6) Test e(und.z=80-95cmTP5) a b c d e CSL ϕ‘=32° 0 50 100 150 200 250 300 0 50 100 150 200 p'=(σ'1+σ'2+σ'3)/3 (kPa) q = σ1 -σ 3 (k P a ) Test a(und.z=30-50cmTP3) Test b(und.z=65-80cmTP3) Test c(und.z=50-65cmTP5) Test d(und.z=30-50cmTP6) Test e(und.z=80-95cmTP5) a b c d e CSL ϕ‘=32°