UNIVERSITÀ DEGLI STUDI DI PISA
Dipartimento di Chimica e Chimica Industriale
Tesi di laurea in Chimica Industriale
Curriculum Classe
Materiali LM-71
Novel ionomeric polyurethanes
with chromogenic properties
Relatori Controrelatore
Dott.ssa Simona Bronco Dott.ssa Valentina Domenici
Dott. Andrea Pucci
Index
1. Introduction...5 1.1 Stimuli-responsive materials...5 1.2 Polyurethanes...8 1.3 DABCO(OH)2...12 1.4 PzPer...14 1.5 Summary...16 1.6 Goal...18 References...192. Results and Discussion...23
2.1 Polyurethanes: characterization...24
2.2 1H-NMR spectroscopy...27
2.3 1H-NMR spectroscopy: calculation of polyurethane composition...38
2.4 Solubility tests...43
2.5 Size exclusion chromatography...45
2.6 Fourier transform infrared spectroscopy: polyurethanes...46
2.7 FTIR spectroscopy: functional polyurethanes...57
2.8 Differential Scanning Calorimetry...62
2.9 Thermogravimetric Analysis...68
2.10 Solvent vapor absorption: films, colors...74
2.11 Vapor tests: color changes, weight variations...80
2.12 Fluorescence spectroscopy...87
2.13 Discussion of results from fluorescence spectroscopy. ...97
References...101
3. Experimental section...104
3.1 Materials Used...104
3.1.1 Solvents...104
3.1.2 Deuterated Solvents and NMR tubes...104
3.1.3 Reagents...104 3.1.4 Dye...105 3.1.5 DABCO(OH)2: characterization...105 3.1.6 PU_100: characterization...106 3.1.7 PZPER: characterization...106 3.1.8 POLOPTEL project...106 3.2 Characterization techniques...107
3.2.1 1H Nuclear Magnetic Resonance...107
3.2.2 Fourier Transform Infrared spectroscopy...108
3.2.3 Solubility tests...108
3.2.4 Size Exclusion Chromatography...109
3.2.6 Thermogravimetric Analysis...109
3.2.7 Fluorescence spectroscopy and photography...110
3.3 Polymer Synthesis...112
3.3.1 Polymer nomenclature...112
3.3.2 Synthesis...113
3.3.3 Work-up and purification...114
3.4 Film Preparation...116
3.5 Vapor tests, acetone exposure setups...117
References...120
4. Conclusions...121
1. Introduction.
1.1 Stimuli-responsive materials.
Recently there has been a growing interest in the development of smart and intelligent materials, specifically polymeric ones. These are capable of detecting and monitoring external stimuli, be they of chemical, mechanical or thermal nature. Attention has been dedicated to the study of polymeric systems with stimuli-responsive functions, with the goal of developing these smart and intelligent systems1–5. These materials can respond to an external stimulus
(thermal, mechanical, electrical, chemical, etc...), via a macroscopic output that is a transduction of the stimulus' energy.
Chromogenic (literally "color-generating") materials are such thanks to the introduction of a stimulus-sensitive chemical species. Stimuli are generally mechanical, thermal or chemical, in the form of mechanical deformations or tears, changes in temperature, or alterations of the chemical environment, respectively. Systems responding to these sollecitations are accordingly called mechanochromic and thermochromic; there are many types of possible chemical stimuli, though examples include solvatochromic (solvent-sensitive)6 and protochromic (pH-sensitive)7 dyes. Response to the stimulus (or
stimuli) stems from a change of either the chemical nature of the chemical species, or a variation of its supramolecular architecture. An example of changes of chemical nature are spiropyran derivatives, covalently incorporated into the polymer backbone: when sufficient mechanical stress is applied, the molecule's internal bonds change, producing a change in its absorption features, i.e. color.8 On the other hand, supramolecular architecture generally refers to the
presence of dye-dye interactions (aggregated, interacting form) or absence of these (disaggregated, non-interacting form). Dyes that change their optical features according to their supramolecular state are generally referred to as aggregachromic dyes; these can be used in many types of chromogenic materials, including mechanochromic and thermochromic ones.9
Chromogenic materials can give an output in the form of a change of their optical features (i.e. absorption, emission, refractive index).10,11 Potential
applications include smart packaging, sensors and displays. Generally one designs and prepares these materials by choosing an opportune polymer matrix,
and dispersing or incorporating a chemical species capable of responding to the stimulus. The response typically consists either of an alteration of the species' chemical structure, or of a variation of its supramolecular state (aggregated or disaggregated).1,2,12,13
Chromogenic materials can be prepared in a variety of ways; depending on the manner in which the sensing component (dye) is introduced in the polymer matrix, there are two main approaches - covalent incorporation, or dispersion.14 The latter avoids issues such as migration stability, by rendering
the dye an integral component of the polymer backbone, though production on an industrial scale is hindered by the necessary synthetic steps;15,16 the latter
makes for an easier introduction of the sensing dye, and is currently more feasible for large scale production, though issues such as stability of supramolecular states might need to be addressed.17,14 Dispersion is being used
in a growing number of papers in literature, and generally relies either on solvent casting, or more often, on melt processing.12,17–19
Chromogenicity in aggregachromic systems is induced by a change in the dye's supramolecular state, i.e. aggregated or disaggregated. Aggregation consists of short-range, non covalent interactions, and can consist of hydrogen bonds or aromatic π-π orbital interactions.20–23 Disaggregated molecules, and non
interacting ones in general, are such if they are sufficiently distant, or if interactions are impeded between them.17,14,24
Many chromogenic materials exhibit their properties in the UV-vis spectrum (200-380 nm);25 absorption and emission features provide useful information.
Absorption spectra are generally studied for absorption maxima, both in terms of relative intensity, and more importantly for their position. Aggregated molecules and disaggregated ones can have distinct spectral features, and it is possible to differentiate between specific types of supramolecular architecture. Indeed, the exciton theory24 is often used in interpreting absorption spectra of
spectroscopy) remain quite useful. Although not always applicable, many dyes present in literature display sufficiently different emission profiles, depending on whether they are in an aggregated or disaggregated state. Examples include stilbene derivatives,12 OPV derivatives28 and thiophene-based π-conjugated
systems.16 In other cases however, this is not possible: an example are perylene
tetracarboxylic diimide (PTCDI) derivatives, which display overlapping features both in the interacting and non interacting form, as observed in previous work by Donati et al.17 In this specific work, this difficulty was overcome by observing
any variations in emission intensity (attributable to a decrease in quenching phenomena32), and studying relative peak intensity of spectral features. Indeed,
while both aggregated and disaggregated forms contribute to the same emission peaks, an increase in the disaggregated form leads to a majoritary contribution to only one of the peaks.
Many seminal works, along with much literature concerning chromogenic systems, have been prepared using polyolefin matrices.2,4,14,16,19,32–34 This can be
justified by the quality of the chromogenic response, the ease of manufacturing such systems, and more imporantly by the affordable cost of an eventual production on an industrial scale.14 Recently however, attention has also been
focused on less traditional matrices and instead on more innovative or complex systems. Examples include biodegradable, PLA/PBS-based systems12 and
polyurethane matrices.35
Examples of smart materials, specifically polyurethane (PU) based ones, include PUs with temperature-sensitive water vapor permeability, offering potential applications in smart textiles;36 secondary dispersions of cationic segmented
PUs with thermoresponsivity (upper critical solution temperature (UCST) in water) and antibacterial properties;37 and PUs that covalently incorporate
spiropyran mechanophores, conferring mechanochromicity to these polymeric systems.15
1.2 Polyurethanes.
Polyurethanes (PUs), defined as polymers containing urethane groups [-O-(C=O)-NH-], were first prepared in the late 1930s by O. Bayer at I. G. Farbenindustrie by reacting diisocyanates with glycols; their properties made them interesting for use as plastics and fibers. Further research showed that PUs offered promising applications as adhesives, rigid foams and surface coatings.
Isocyanates can be aromatic or aliphatic, while diols can be either simple glycols, polyethers or polyesters. Currently, PUs are classifiable in the following major types: flexible foams, rigid foams, elastomers, fibres and moulding compositions, suface coatings, and adhesives.38–40 The chief areas of
applications are: appliances; automotive; building and construction; coatings, adhesives, sealants and elastomers; furniture and bedding. Other applications include electronics, flooring and packaging.41
PU-based surface coatings are a very important type of coating thanks to their versatility and the broad range of products commercially available; they also potentially constitute a solution to the issue of eliminating volatile organic compounds (VOCs), given that some coatings can be prepared by applying liquid monomers and allowing for the mixture to polymerize and set.40 Sealants
and adhesives also represent important sectors for polyurethanes (Figure 1.1,
Figure 1.2. World consumption in 2005 of raw materials
by product type (value); total: Euro 14.4 billions). Note: for "Powder coating resins", the value is 9%.
As can be seen in the figures, polyurethanes do not represent the most used material for adhesives and sealants; however, they compensate for this by constituting a signicant percentage of sold products, coming in second only after alkyd resins/oil-free polyesters.42
PUs come in many shapes and sizes, and are limited only to the components that can be synthesized and combined. The only defining characteristic that is common to all PUs is the urethane moiety, -O-(C=O)-NH-. Generally, PUs are prepared by reacting a diisocyanate (OCN-R-NCO) with a diol (HO-R-OH), and eventually a chain extender. Additionally, a tertiary amine or an organometallic compound can be used as a catalyst38,39. The exact mechanism is still unknown,
though some reaction mechanisms have been proposed depending on the presence and type of catalyst used.43,44 It is known however that the isocyanate
moiety reacts with active hydrogens:38,45 this makes isocyanates quite reactive,
undergoing a series of side reactions and even self-condenstion reactions38,40 (Figure 1.3).
Figure 1.3. Common isocyanate reactions.
From a chemical standpoint, there is a very large selection of isocyanate and diol monomers; this allows for great versatility when it comes to choosing a polyurethane matrix that is adequate for an application. Given the many applications PUs have found over the years, it seems sensible to explore their use in preparing smart or intelligent systems.
The polyurethanes prepared in this work are based on two well-known monomers: 1,6-hexamethylenediisocyanate (HDI) and polyethylene glycol, average molecular weight 1500 (PEG-1500). HDI was chosen mainly for its reputation as a non-toxic component in polyurethanes46 and for its low cost,
traits that makes it attractive for cheap and sustainable green applications. HDI is aliphatic, offering greater color stability than its aromatic counterparts39; this
is a useful factor to consider when preparing composites containing dyes. Additionally, a traditional polyether-based polyurethane was prepared with PEG-200, as a possible matrix in which to disperse the dye-loaded ionomeric polymers.
found that the inclusion of PEGs of opportune molecular weight in HDI-based PUs increases biodegradation rates to some degree51, and the use of the cyclic
trimer of HDI has been even studied in the preparation of dye-sensitized organic solar cells52.
Furthermore, the polyurethanes synthesised for this thesis were for the most part water-dispersible, sometimes even water-soluble; hydrophilicity has been observed for polyurethanes using polyethers of a relatively high molecular weight53. This property makes them interesting for applications which require
acqueous polyurethane (APU) systems, which make up a rapidly growing branch of research54. Furthermore, polyurethane matrices have recently been
explored as a medium in which to disperse aggregation-sensitive dyes, by covalent bonding though35. This work instead aims to obtain chromogenic
1.3 DABCO(OH)2.
DABCO(OH)2, an ionomer derived from DABCO, was synthesised as a part of
the POLOPTEL project, as described in the Goal of this thesis.
The ionomer was included in this work in an effort to determine if its presence in a polyurethane system could confer desirable properties. To the best of our knowledge, this specific compound has not been utilized in any previous work. A similar compound had however been previously synthesised55, with different
counterions (bromide and iodide, instead of chloride). Moreover, at least one patent has been filed for a series of compounds similar to DABCO(OH)256, and
quaternized ammonium salts do have applications in the production of polyurethane foams57,58.
What sets DABCO(OH)2 apart from these previous compounds is that quaternization of triethylenediamine is only an intermediate step to obtaining a free base derivative of DABCO, and quaternized salts are generally not cyclic, nor are they normally incorporated in the polyurethane during polymerization. As stated above, the ionomer is a di-N,N'-quaternized derivative of DABCO, and thus has two positive charges. This modification confers a hydrophilic nature to the compound - to the point that it is hygroscopic - and makes it interesting for applications such as water dispersable polyurethanes, which have been prepared employing quaternized ammonia groups40. Polyurethanes
incorporating ionomeric groups are often used to prepare aqueous dispersions, a useful trait for the preparation of "solventless" polyurethane coatings39.
Quaternized ammonia salts (QAS), such as DABCO(OH)2, often possess
antibacterial qualities59,60, making them interesting for biomedical applications.
A class of compounds containing two quaternary ammonia groups are cationic gemini quaternary surfactants, consisting of two hydrophobic side chains and two polar headgroups covalently attached through a spacer group. These novel surfactants can be taylor-made to have different aggregation properties by
properties62. Although the polyurethanes synthesized in this work were not
studied for micellization properties, it would be interesting to study eventual novel surfactant properties that a quaternary ammonium dication could confer to such systems.
1.4 PzPer.
In chromogenic systems, functional dyes have been introduced via covalent bonding8,15, or non covalent bonding63,64; the latter offers a more sustainable
route in material development, since it allows for the use of different kinds of dyes already available on the market14.
Perylene dyes are an example of functional dyes that can be dispersed in polymeric system. They represent an important class of functionalised chromophores, thanks to the combination of properties such as electro-optical and redox characteristics, along with thermal and migration stability20,65,66,21.
The fact that perylene and its derivatives are made up of five planar rings fused together, is responsible for promoting aggregation through stacking interactions26. Perylene dyes have been used as fluorescence standards,
thin-film transistors, light emitting diodes, photovoltaics and liquid crystals20,67–72.
Perylene dimimide molecules have been synthesized and studied by various research groups; potential applications include antitumor drugs, fluorescence tags of biological systems, and elements in the self-assembly of photoactive films65,73,74.
PzPer belongs to the family of perylene tetracarboxilic acid diimide (PTCDI) dyes. The bisanhydride perylene tetracarboxylic acid is sufficiently reactive that it can be functionalized; this can be exploited for enhancing opto-electronic properties, or for modifying the perylene derivative's solubility in a dispersing medium26,75,76,30.
Since there was the possibility of generating multichromophoric supramolecular architectures even in semicrystalline polymer systems, previous work by Donati, Pucci et al. focused on PzPer's aggregation properties in various environments, including vinyl alcohol-containing polymers. These systems were prepared by non covalent dispersion of the dye17.
similar to those of PzPer in the monomeric form; specifically, for PVA-based systems, the disaggregation process occurred at greater rates when heated above their Tg (about 80°C).77 For studies on PzPer in water, an increase in
temperature showed a decrease of the 530 nm band in absorption spectra; this band is attributed to pi-pi stacking interactions, and a decrease can be ascribed to a partial disruption of H-aggregates. Similarly, emission spectra showed a progressive recovery of fluorescence as temperature was increased. When progressive amounts of acetone were added to aqueous solutions of PzPer, absorption features changed noticeably, assuming the profile of non-interacting perylene chromophores.32 Emission spectra showed a very strong recovery in
fluorescence, confirming the reduction of aggregation extent. Acetone, as an aprotic co-solvent, probably reduces the number of hydrogen bonds between PzPer molecules, and in doing so limits aggregation phenomena.
1.5 Summary.
A series of polyurethanes are synthesized from traditional components, HDI and PEG-1500. A novel ionomer, DABCO(OH)2, is included in reaction feeds,
yielding ionomeric polyurethanes. PzPer, a water-dispersible and aggregachromic dye, is dispersed at low to very low loadings (0.50 to 0.01% wt). Additionally, a second polyurethane matrix is prepared with HDI and PEG-200. Polymers synthesized are characterized by 1H-NMR, solubility tests, GPC, FTIR, DSC, and TGA. Samples with dye dispersed are studied by exposure to solvents, and by fluorescence spectroscopy.
Two variations are made to the PEG-1500 based systems. The first one involves introducing 1, 4-dihydroxyethyl-1, 4-diazabicyclo [2.2.2] octane dichloride (DABCO(OH)2, Figure 1.4), a novel diquaternized cationomer (or ionomer) of
1, 4-diazabicyclo [2.2.2] octane (DABCO or thriethylenediamine).
Figure 1.4. DABCO(OH)2.
The second variation consists in dispersing a water-soluble, aggregation-sensitive fluorescent dye, N, N' - bis (2 - ( 1 - piperazino) ethyl) - 3, 4, 9, 10 - perylenetetracarboxylic acid diimide dichloride (PzPer, Figure 1.5). This dye is dispersed in very low to low loadings (0.01 - 0.50% wt) in polyurethanes with and without the ionomer.
PU_100, is studied with some of these techniques (FTIR, TGA) for comparison. Systems containing the fluorescent dye are studied by measuring solvent vapor absorption (humidity), and by fluorescence spectroscopy.
This work wishes to further study the environmental effects on PzPer previously observed by Donati et al. in vinyl alcohol-containing polymeric systems1, by
using a chemically different polar environment, i.e. a polyether-based urethane, which in addition incorporates an ionomer. It would be interesting to study any interactions between the charged ionomer and PzPer's two quaternized groups, such as compatibilization effects.
Characterization results show that polymers synthesized are typical polyurethanes, while the amount of ionomer incorporated does not exceed 1.5% mol of total composition. Studies on chromogenicity indicate increase in emission intensity and simultaneous increase in aggregation; correlation with results in literature suggests strong chromophore aggregates, attributable to polar environment.
1.6 Goal.
This work was performed under the POLOPTEL project, titled "New Polymer Systems with Electric and Optical Functionalities via Nano and Micro Adhesive Dispersion to Produce Materials and Devices for Smart Applications (POLOPTEL)". Its mission is "the preparation, design, characterisation,
processing and performance evaluation of polymer based [sic] smart materials" (quoted from the project's submission form, part B). The project is
financed by Fondazione Pisa, Via Pietro Toselli, 29, 56125 Pisa.
In this work, a novel ionomeric polyurethane matrix is prepared by covalently incorporating a charged monomer. A charged aggregation-sensitive dye is then dispersed in this matrix; the system is studied for compatibilization effects and chromogenicity, by studying its optoelectronic properties and by studying its response to solvent vapor exposure, respectively.
The ionomeric polyurethanes prepared in this work incorporate positive charges in the polymer backbone. Given the presence of positive charges on PzPer, it is possible that same-charge repulsive effects could occur in proximity to DABCO(OH)2. Thus it would be interesting to study any compatibilizing or aggregation-encouraging effects.
References.
1. Y. Sagara and T. Kato, Nat. Chem., 2009, 1, 605–10.
2. M. M. Caruso, D. a Davis, Q. Shen, S. a Odom, N. R. Sottos, S. R. White, and J. S. Moore, Chem. Rev., 2009, 109, 5755–98.
3. D. Roy, J. N. Cambre, and B. S. Sumerlin, Prog. Polym. Sci., 2010, 35, 278– 301.
4. J. Hu and S. Liu, Macromolecules, 2010, 43, 8315–8330.
5. R. Yerushalmi, A. Scherz, M. E. van der Boom, and H.-B. Kraatz, J. Mater.
Chem., 2005, 15, 4480.
6. O. Inganas, W. R. Salaneck, J. E. Osterholm, and J. Laakso, Synth. Met., 1988, 22, 395–406.
7. R. Cinar, J. Nordmann, E. Dirksen, and T. J. J. Müller, Org. Biomol. Chem., 2013, 11, 2597–604.
8. C. Weder, Nature, 2009, 459, 45–46.
9. J. Kunzelman, T. Chung, P. T. Mather, and C. Weder, J. Mater. Chem., 2008,
18, 1082.
10. O. L. J. Pursiainen, J. J. Baumberg, K. Ryan, J. Bauer, H. Winkler, B. Viel, and T. Ruhl, Appl. Phys. Lett., 2005, 87, 101902.
11. O. L. Pursiainen, J. J. Baumberg, H. Winkler, B. Viel, P. Spahn, and T. Ruhl,
Opt. Express, 2007, 15, 9553–61.
12. A. Pucci, F. Signori, R. Bizzarri, S. Bronco, G. Ruggeri, and F. Ciardelli, J.
Mater. Chem., 2010, 20, 5843.
13. D. a Davis, A. Hamilton, J. Yang, L. D. Cremar, D. Van Gough, S. L. Potisek, M. T. Ong, P. V Braun, T. J. Martínez, S. R. White, J. S. Moore, and N. R. Sottos, Nature, 2009, 459, 68–72.
14. A. Pucci and G. Ruggeri, J. Mater. Chem., 2011, 21, 8282.
15. C. K. Lee, D. a Davis, S. R. White, J. S. Moore, N. R. Sottos, and P. V Braun,
J. Am. Chem. Soc., 2010, 132, 16107–11.
16. G. Prampolini, F. Bellina, M. Biczysko, C. Cappelli, L. Carta, M. Lessi, A. Pucci, G. Ruggeri, and V. Barone, Chemistry, 2013, 19, 1996–2004. 17. F. Donati, A. Pucci, and G. Ruggeri, Phys. Chem. Chem. Phys., 2009, 11,
6276–82.
18. A. Pucci, T. Biver, G. Ruggeri, L. I. Meza, and Y. Pang, Polymer (Guildf)., 2005, 46, 11198–11205.
19. B. C. Löwe and C. Weder, Adv. Mater., 2002, 14, 1625–1629.
20. C. W. Struijk, A. B. Sieval, J. E. J. Dakhorst, M. Van Dijk, P. Kimkes, R. B. M. Koehorst, H. Donker, T. J. Schaafsma, S. J. Picken, A. M. Van De
Craats, J. M. Warman, H. Zuilhof, and E. J. R. Sudho, J. Am. Chem. Soc., 2000, 122, 11057–11066.
21. T. E. Kaiser, H. Wang, V. Stepanenko, and F. Würthner, Angew. Chem. Int.
Ed. Engl., 2007, 46, 5541–4.
22. J. R. Cox, P. Müller, and T. M. Swager, J. Am. Chem. Soc., 2011, 133, 12910– 3.
23. V. I. Vuillev, H. Jiang, and G. Jones, Excimer sensing, Boston University, Chemistry Department and Photonics Center, Boston, MA, 02215.
24. M. Kasha, H. R. Rawls, and M. Ashraf El Bayoumi, Pure Appl. Chem., 1965,
11, 371–392.
25. Silverstein and Bassler, Spectrometric Identification of Organic
Compounds, John Wiley & Sons, Inc., 1966.
26. F. Würthner, Chem. Commun. (Camb)., 2004, 1564–79.
27. K. Balakrishnan, A. Datar, T. Naddo, J. Huang, R. Oitker, M. Yen, J. Zhao, and L. Zang, J. Am. Chem. Soc., 2006, 128, 7390–8.
28. B. R. Crenshaw and C. Weder, Chem. Mater., 2003, 15, 4717–4724. 29. S.-W. Tam-Chang, W. Seo, and I. K. Iverson, J. Org. Chem., 2004, 69,
2719–26.
30. H. Langhals and S. Kirner, European J. Org. Chem., 2000, 2000, 365–380. 31. C. Kohl, T. Weil, J. Qu, and K. Müllen, Chemistry, 2004, 10, 5297–310. 32. F. Donati, A. Pucci, C. Cappelli, B. Mennucci, and G. Ruggeri, J. Phys.
Chem. B, 2008, 112, 3668–79.
33. B. R. Crenshaw, M. Burnworth, D. Khariwala, A. Hiltner, P. T. Mather, R. Simha, and C. Weder, Macromolecules, 2007, 40, 2400–2408.
34. A. Pucci, R. Bizzarri, and G. Ruggeri, Soft Matter, 2011, 7, 3689.
35. B. R. Crenshaw and C. Weder, Macromolecules, 2006, 39, 9581–9589. 36. X. M. Ding, Text. Res. J., 2006, 76, 406–413.
37. F. Chen, J. Hehl, Y. Su, C. Mattheis, A. Greiner, and S. Agarwal, Polym. Int., 2013, n/a–n/a.
38. K. J. Saunders, Organic Polymer Chemistry, .
39. Kirk-Othmer, Kirk-Othmer Encyclopedia of Chemical Technology.
44. R. W. Lenz, Organic chemistry of synthetic high polymers, 1967.
45. B. D. Kaushiva, Virginia Polytechnic Institute and State University, 1999. 46. Z. Li, X. Yang, L. Wu, Z. Chen, Y. Lin, K. Xu, and G.-Q. Chen, J. Biomater.
Sci. Polym. Ed., 2009, 20, 1179–202.
47. C. Alkan, E. Günther, S. Hiebler, Ö. F. Ensari, and D. Kahraman, Sol.
Energy, 2012, 86, 1761–1769.
48. H. Fu, H. Gao, G. Wu, Y. Wang, Y. Fan, and J. Ma, Soft Matter, 2011, 7, 3546.
49. M. M. Talakesh, M. Sadeghi, M. P. Chenar, and A. Khosravi, J. Memb. Sci., 2012, 415-416, 469–477.
50. W. P. Van Antwerp, C. C. Decker, and J. J. Mastrototoro, 2004, 2, 26. 51. H. Yeganeh, H. Jamshidi, and S. Jamshidi, 2007, 49, 41–49.
52. Q. Li, H. Chen, L. Lin, P. Li, Y. Qin, M. Li, B. He, L. Chu, and Q. Tang, J.
Mater. Chem. A, 2013, 1, 5326.
53. F. E. Gould and C. W. Johnston, 1984.
54. A. Saeed and G. Shabir, Prog. Org. Coatings, 2013, 76, 1135–1143. 55. O. Shigeru, J. Org. Chem., 1959, 24, 1348–1349.
56. G. H. Temme, 1981.
57. H. P. Klein and G. P. Speranza, 1980. 58. W. J. Farrissey Jr. and A.-M. Nashu, 1976.
59. I. Yudovin-Farber, J. Golenser, N. Beyth, E. I. Weiss, and A. J. Domb, J.
Nanomater., 2010, 2010, 1–11.
60. Y. Zhu, J. Hu, and K. Yeung, Acta Biomater., 2009, 5, 3346–57. 61. Y. Li, P. Li, C. Dong, X. Wang, Y. Wang, H. Yan, and R. K. Thomas,
Langmuir, 2006, 22, 42–5.
62. M. Ding, J. Li, X. Fu, J. Zhou, H. Tan, Q. Gu, and Q. Fu, Biomacromolecules, 2009, 10, 2857–65.
63. A. Pucci, G. Ruggeri, and F. Ciardelli, in Advanced Nanomaterials, eds. K. Geckeler and H. Nishide, Wiley-VCH, Weinheim, Germany, 2010, pp. 379–401.
64. C. Weder, Chim. Int. J. Chem., 2009, 63, 758–763.
65. K. Peneva, G. Mihov, A. Herrmann, N. Zarrabi, M. Börsch, T. M. Duncan, and K. Müllen, J. Am. Chem. Soc., 2008, 130, 5398–9.
66. Y. Jin, J. Hua, W. Wu, X. Ma, and F. Meng, Synth. Met., 2008, 158, 64–71. 67. K. Sugiyasu, N. Fujita, and S. Shinkai, Angew. Chem. Int. Ed. Engl., 2004,
43, 1229–33.
H. M. van Stokkum, L. De Cola, R. M. Williams, and F. Würthner, J. Am.
Chem. Soc., 2005, 127, 6719–29.
69. M. Sadrai and G. R. Bird, Opt. Commun., 1984, 51, 2–4.
70. Y. Guan, Y. Zakrevskyy, J. Stumpe, M. Antonietti, and C. F. J. Faul, Chem.
Commun. (Camb)., 2003, 894–5.
71. C. Ego, D. Marsitzky, S. Becker, J. Zhang, A. C. Grimsdale, K. Müllen, J. D. MacKenzie, C. Silva, and R. H. Friend, J. Am. Chem. Soc., 2003, 125, 437–43.
72. R. A. Cormier and B. A. Gregg, Chem. Mater., 1998, 4, 1309–1319.
73. M. Franceschin, C. M. Lombardo, E. Pascucci, D. D’Ambrosio, E. Micheli, A. Bianco, G. Ortaggi, and M. Savino, Bioorg. Med. Chem., 2008, 16, 2292– 304.
74. T. Tang, J. Qu, K. Müllen, and S. E. Webber, Langmuir, 2006, 22, 7610–6. 75. H. Langhals, Heterocycles, 1995, 40, 477–500.
76. H. Langhals and S. Saulich, Chem. Eur. J., 2002, 8, 5630–5643.
77. A. Pucci, M. Bernabò, P. Elvati, L. I. Meza, F. Galembeck, C. A. de Paula Leite, N. Tirelli, and G. Ruggeri, J. Mater. Chem., 2006, 16, 1058.
2. Results and Discussion
Four polyurethanes were prepared for this work: 1500_PU_00, 05 and 20, and 200_PU_00; all polymer yields were moderate (70 to 85%). Two of these, 1500_PU_05 and 1500_PU_20, included the novel dicationomer DABCO(OH)2
in their reaction feeds.
Films of the 1500_PU series were prepared by solvent casting, with water/acetone solutions of PzPer. 200_PU_00 had been synthesized as a matrix in which to disperse the 1500_PU-dye systems: the hope was to overcome the ionomeric polymers' fragility, but it too proved to have insufficient mechanical properties. Furthermore, solubility tests (see section) showed that it was not soluble in water or acetone, and instead dissolved in chloroform and other solvents; the lack of a common solvent prevented further use of 200_PU_00 in film preparations.
After terminating polymerization, the mixture consisted of a liquid component and a swollen, solid component that was insoluble in all organic solvents. This was the case for all polymers, except 1500_PU_00, which was soluble in all solvents tested save diethyl ether.
To ensure that polymerization had occurred, an infrared spectrum of each polymer was acquired and compared with the monomers' spectra; the reaction was considered complete when the isocyanate peak at 2260 cm-1 disappeared1.
This was done when possible, since often during polymerization the mixture became very tough and hard to remove from the reaction vessel. Thus, only 1500_PU_00 and 1500_PU_05 were subjected to this test.
2.1 Polyurethanes: characterization.
The polyurethanes synthesised for this work were characterized with the goal of determining their chemical and thermal properties. A total of four polyurethanes were made: 200_PU_00, 1500_PU_00, 1500_PU_05 and 1500_PU_20 (Figure 2.1).
Figure 2.1. Polyurethanes prepared.
As stated previously, these polymers were synthesized starting from diols and a diisocyanate. It is a well-known fact that isocyanates are very reactive, and will form many different products depending on the chemical species present: they will essentially react with an active hydrogen site2. Figure 2.2 outlines the
Figure 2.2. Summary of main reactions that isocyanates undergo.
One reaction that competes with polyurethane formation is that of R-NCO with water, giving urea bonds (left side of Figure 2.2). This happens when water is present in the reaction medium, and is the main reason that polyurethanes described in this work were prepared without using solvents, a potential source of additional vapor. Indeed, the only solvent capable of dissolving all three monomers was DMSO (see solubility tests), which is hygroscopic and therefore requires drying3,4. Furthermore, the diols themselves were hygroscopic,5 and
although they were vacuum dried for 24h, trace amounts of water resulted still present. Thus, when studying these polymers, one must keep an eye out for the urea moiety.
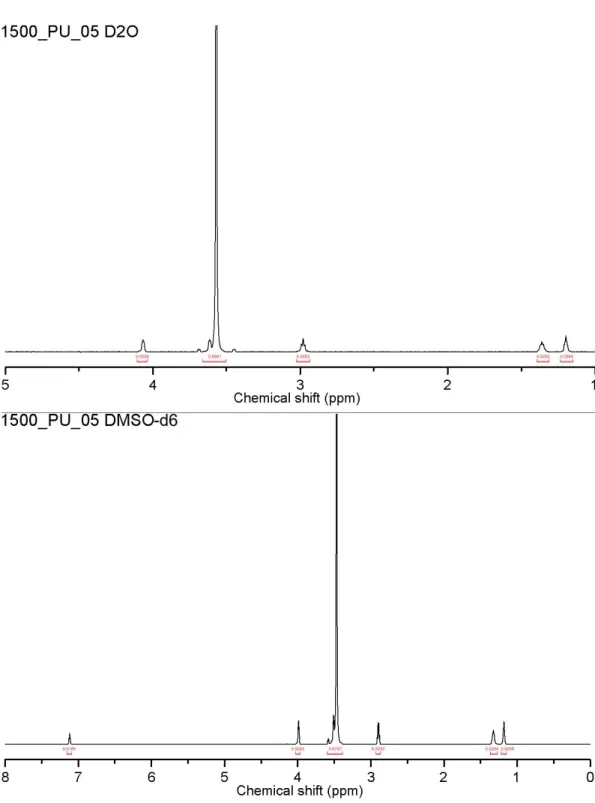
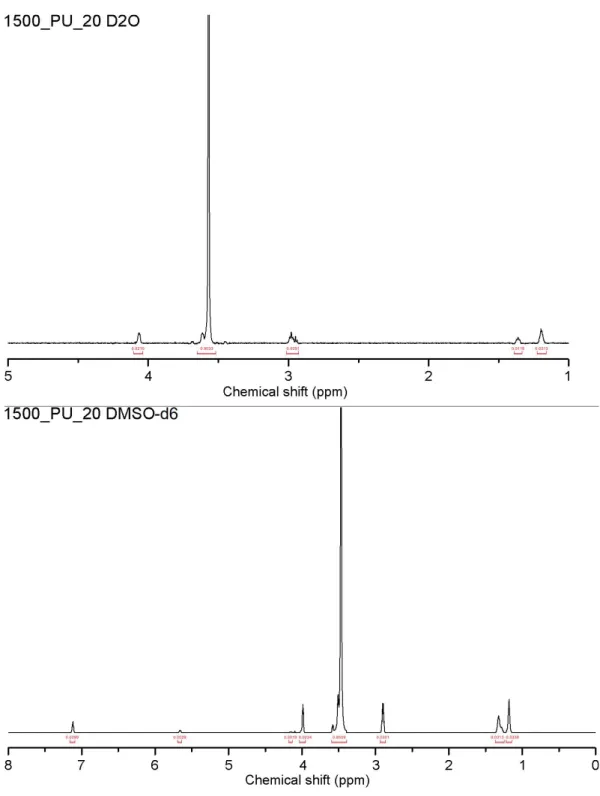
2.2 1H-NMR spectroscopy.
The chemical shift values for the polyurethanes synthesized are assigned as described in Figure 2.3 and Figure 2.4 for spectra acquired in D2O and
DMSO, respectively. These values are corroborated by previous works involving polyurethanes prepared from HDI and PEG6,7; assigning chemicals shifts to
DABCO(OH)2 was done by referring to previous works done in this laboratory.
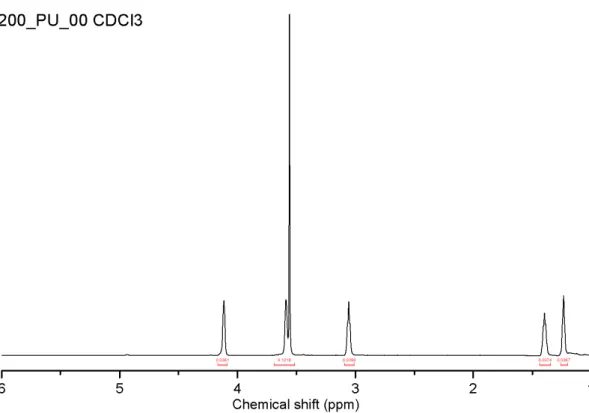
Chemical shifts for 200_PU_00, acquired in CDCl3 (Figure 2.5), differed little
from those acquired in the other deuterated solvents. For spectra acquired in DMSO-d6, urethane protons are visible at ~7 ppm; on the contrary urethane
protons were not observed in deuterium oxide and deuterated chloroform spectra.
Figure 2.3. 1H-NMR spectrum of 1500_PU_20 in D
2O (25°C, solvent peak omitted),
Figure 2.4. 1H-NMR spectrum of 1500_PU_20 in DMSO-d
6 (25°C, solvent peak omitted),
Figure 2.5. 1H-NMR spectrum of 200_PU_00 in CDCl
3 (25°C, solvent peak omitted),
with assignment of chemical shifts.
It can be noted that the peak at about 3.5 - 3.7 ppm, belonging to the bulk CH2s
of PEG-200 and PEG-1500, has a small shoulder on the left side of the peak; this was included in integrating the main peak, and not treated separately. Furthermore, although this peak's maximum is at about 3.55 ppm, a wide interval (3.7 - 3.5) was considered, so as to include the shoulder.
DABCO(OH)2's NMR spectra in D2O and DMSO-d6 (Figure 2.6 and Figure
2.7, respectively) differ mainly in the presence of a peak at 5.6 ppm (terminal
-OH) in the DMSO-d6 spectrum. This peak is not visible in D2O due to the
proton-deuterium exchange that inevitably occurs between hydroxy functionalities and deuterium oxide8,9.
Figure 2.6. 1H-NMR spectrum of DABCO(OH)
2 in D2O (25°C, solvent peak omitted),
with assignment of chemical shifts.
Figure 2.7. 1H-NMR spectrum of DABCO(OH)
2 in DMSO-d6 (25°C, solvent peak omitted),
with assignment of chemical shifts.
Aside from this difference, both spectra are in good agreement in terms of integrated peak area ratios: c:b:a 3:1:1 in the case of D2O, c:b:a:d 12:4:4:1 in the case of DMSO-d6; if terminal hydroxy groups were ignored, DMSO-d6 spectra
would yield the same ratio as found in D2O. A more detailed analysis of NMR peaks is found in the next section, 1H-NMR spectroscopy: calculation of
polyurethane composition.
The spectra of 200_PU_00 (Figure 2.8), DABCO(OH)2 (Figure 2.9),
1500_PU_00 (Figure 2.10), 1500_PU_05 (Figure 2.11) and 1500_PU_20 (Figure 2.12) were analysed for peak area integration. Peak areas were then multiplied by 100 for ease of calculation.
Figure 2.8. 1H-NMR spectrum of 200_PU_00 in CDCl
Figure 2.9. 1H-NMR spectrum of DABCO(OH)
2 in D2O (above) and DMSO-d6 (below),
Figure 2.10. 1H-NMR spectrum of 1500_PU_00 in D
2O (above) and DMSO-d6 (below),
Figure 2.11. 1H-NMR spectrum of 1500_PU_05 in D
2O (above) and DMSO-d6 (below),
Figure 2.12. 1H-NMR spectrum of 1500_PU_20 in D
2O (above) and DMSO-d6 (below),
with integrated peak areas.
PEAK INTEGRATION AREAS
Peak
assignment letter1 letter2 letter3 ... For letter-structure correspondence, see previous figures.
Compound
Deut. solvent area×100ppm ... ... ...
DABCO(OH)2
Assigmnents d c b a d:c:b:a ratio
DABCO(OH)2 D2O 58.43 4.03 ppm 20.11 3.99 ppm 19.17 3.65 ppm (absent):3:1:1 DABCO(OH)2 D2O 4.87 5.75 ppm 4.02 ppm56.96 3.84 ppm18.77 3.64 ppm18.94 1:12:4:4
Polyurethanes 200_PU_00 and 1500_PU series
"A-peak" 4.1-3.9 ppm
"B-peak" 3.5-3.4 ppm
Assigmnents m * g+i, j, k h, l e+f a+d b+c
200_PU_00 CDCl3 3.61 4.11 ppm 3.56 ppm12.18 3.06 ppm3.90 1.39 ppm3.74 1.24 ppm3.67 1500_PU_00 D2O 1.90 4.07 ppm 3.57 ppm90.01 2.98 ppm2.06 1.36 ppm2.20 1.20 ppm2.29 1500_PU_00 DMSO-d6 0.95 7.11 ppm 3.98 ppm2.21 3.46 ppm88.90 2.90 ppm2.32 1.32 ppm2.35 1.18 ppm2.41 1500_PU_05 D2O 2.11 4.06 ppm 3.57 ppm89.44 2.98 ppm2.51 1.36 ppm2.56 1.20 ppm2.64 1500_PU_05 DMSO-d6 1.05 7.11 ppm 2.43 3.98 ppm 87.97 3.46 ppm 2.52 2.90 ppm 2.52 1.32 ppm 2.59 1.20 ppm 1500_PU_20 D2O 2.10 4.07 ppm 3.57 ppm90.30 2.98 ppm2.91 1.36 ppm1.17 1.20 ppm3.12 1500_PU_20 DMSO-d6 0.99 7.11 ppm 0.29 5.65 ppm 2.34 3.98 ppm 85.59 3.46 ppm 3.01 2.98 ppm 3.13 1.32 ppm 3.38 1.18 ppm *terminal -OH
Table 2.1. Integrated peak areas (×100) and respective chemical shift
of DABCO(OH)2 and each polymer. Peak assignments included.
DMSO-d6 chemical shifts (grey entries) were consistently lower in value;
corresponding spectra were also of better quality, as urethane protons and even terminal -OH groups (in the case of 1500_PU_20) even terminal OH groups were visible. The proton-deuterium exchange taking place in D2O solutions
probably contributed to the absence of these peaks in D2O spectra.
Peaks corresponding to letters m, e+f, a+d and b+c are assigned to isocyanate methylenes (or amines), while peaks corresponding to g+i, j, k, h and l belong to both ionomer and macrodiol methylenes. As described above, a calculation of effective diol composition requires a series of preliminary calculations on peak areas, given the lack of peaks assignable exclusively to ionomer or macrodiol. To this end and for convenience, two peaks were labeled "A-peak" and "B-peak".
"A-peak" (4.1 - 3.9 ppm) corresponds to the terminal PEG methylenes linked to the urethane moiety, in the sample without DABCO(OH)2. In samples with the
ionomer this remains true, although there are eight additional methylenes of DABCOder to consider. "B-peak" (3.5 - 3.7 ppm) corresponds to the bulk methylenes in the pure sample; for samples with DABCO(OH)2, it includes the
external CH2s of the ionomer. Calculations are described in the following
2.3 1H-NMR spectroscopy: calculation of polyurethane composition.
Thanks to data found in literature6,7 and from this laboratory, chemical shifts
were uniquely assigned to methylenes in polyurethanes without ionomeric content (i.e. 200_PU_00 and 1500_PU_00); performing subsequent calculations10–13 was not as intuitive. Table 2.2 lists the composition of
200_PU_00. All calculations were based on methylenes, or two protons.
CDCl3: 200_PU_00 ppm/compound 4.11 3.56 3.06 1.39 1.24 PEG-1500 2i 7i HDI 2i 2i 2i total 2i 7i 2i 2i 2i
Where i is the number of repeating units.
Table 2.2. Number of methylenes calculated from CDCl3 spectrum of 200_PU_00.
On the other hand, calculating compositions for polymers containing the ionomer was not as straightforward. Indeed, PEG-1500 and DABCO(OH)2's
peaks both fall in nearly identical regions; HDI's peaks, though unequivocal, are present in both the ionomeric and macrodiol segments (Table 2.3, Table 2.4).
D2O: DABCO(OH)2, 1500_PU_00, 05, 20 ppm/compound 4.1 - 3.9 3.7 - 3.5 3.0 - 2.9 1.4 - 1.3 1.2 DABCO(OH)2 6n + 2n 2n PEG-1500 2m 95m HDI 2n + 2m 2n + 2m 2n + 2m total 8n + 2m 2n + 95m 2n + 2m 2n + 2m 2n + 2m
Where n and m are segments containing DABCO(OH)2 and PEG-1500, respectively.
DMSO-d6: DABCO(OH)2, 1500_PU_00, 05, 20 ppm/compound 7.11 4.1 - 3.9 3.7 - 3.5 3.0 - 2.9 1.4 - 1.3 1.2 DABCO(OH)2 6n + 2n 2n PEG-1500 2m 81m HDI n+m 2n + 2m 2n + 2m 2n + 2m total n+m 8n + 2m 2n + 81m 2n + 2m 2n + 2m 2n + 2m
Where n and m are segments containing DABCO(OH)2 and PEG-1500, respectively.
Table 2.4. Number of methylenes calculated from spectra in DMSO-d6.
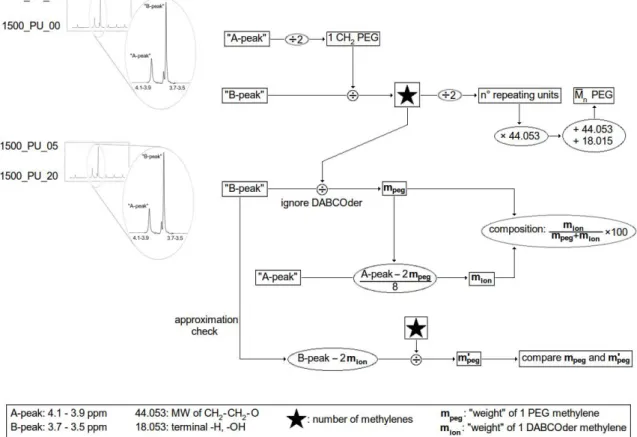
Figure 2.13 outlines the scheme used for calculating the composition of each
polyurethane.
Figure 2.13. Scheme of calculations performed on integrated areas of peaks in
methylene; the number of CH2 present in PEG, , was determined by dividing★
the integrated peak at 3.7-3.5 ppm ("B-peak") by. This also made it possible to calculate the numerical average molecular weight (Mn) and compare it with the
manufacturer's data; this comparison is purely qualitative, as methods for determining Mn used by manufacturers can vary (and in PEG-1500's case only
Mw was provided).
Second, for calculations concerning polyurethanes containing DABCO(OH)2, ★
was used in finding the weight of one macrodiol CH2; this was done by dividing
the B-peak by . The weight of one PEG ★ methylene present in the ionomer-containing polyurethane was called mpeg.
Third, always concerning ionomeric polyurethanes, it was known that in the A-peak there are a total of 10 CH2s, two of which are assigned to PEG and the
remaining eight to DABCO(OH)2; the weight of 1 ionomer methylene, mion, was
calculated by subtracting 2 mpeg from A-peak and dividing the remnant by 8.
Fourth, mpeg and mion were used for determining the percentage composition of
(of total diol) each polyurethane synthesized.
Fifth and final, the above calculations were made with an approximation: given that the calculated number of CH2s in PEG in B-peak was 95 (D2O) or 81
(DMSO-d6), the two ionomer methylenes present in this peak (Table 2.3,
Table 2.4) were deemed negligible during calculations involving mpeg. To
check that this approximation was acceptable, 2mion was subtracted from the
B-peak area; the difference corresponds to the 95 or 81 PEG methylenes present, by which the area was then divided. This division gave a new PEG methylene value, m'peg, which was compared with the previous mpeg.
CDCl3 n° CH2 ( )★ 7 PEG-200 Mn 312 Da D2O n° CH2 ( )★ 95 PEG-1500 Mn 2149 Da
% DABCO(OH)2* mpeg m'peg
1500_PU_05 2.86 0.944 0.943
1500_PU_20 2.48 0.953 0.953
DMSO-d6 n° CH2 ( )★ 81
PEG-1500 Mn 1834 Da
% DABCO(OH)2* mpeg m'peg
1500_PU_05 2.70 1.093 1.093
1500_PU_20 2.43 1.064 1.063
Percentages are molar.
*Composition with respect to diols, not total
Table 2.5. Summary of data calculated from 1H-NMR spectra.
As can be seen from Table 2.5, the calculated amount of ionomer incorporated in all polymers, in both deuterated solvents, does not exceed 3% mol of diol composition; consequently, actual composition is half this value, or 1.5% mol. Additionally, the approximation used for calculations is acceptable, since methylene weights do not vary significantly; in most cases there are no changes in value whatsoever, or at the third digit (1500_PU_05 D2O, and 1500_PU_20
DMSO-d6). The calculated average molecular weight of PEG-1500 was in both
cases very different from the value given by the manufacturer, although in the case of DMSO-d6 spectra, the difference is smaller.
oligomeric polyurethanes, the rest of DABCO(OH)2 (MW~273 Da) was in a form
of insufficiently high molecular weight to be retained by the dialysis membrane, which had a cutoff of 2000 or 1000 Da.
One final information can be obtained from these NMR spectra, concerning 1500_PU_20's Mn. Unlike the other compounds analyzed, this ionomer has a
measurable terminal OH area (0.29, see Table 2.1). This makes it possible to calculate a numerical average molecular weight, Mn. Moreover, this calculation
is particularly useful, since 1500_PU_20 was found to be insoluble in CHCl3,
the solvent used in gel permeation chromatography (GPC) for determining the synthesized polyurethanes' molecular weights. As can be seen in the respective section, 1500_PU_20 was not analyzable for this reason.
Given that the amount of ionomer incorporated in 1500_PU_20's case is 2.43 % mol of the total diol present (about 1.2 % mol of the entire polymer), this is a negligible quantity when determining Mn. Any of the 3 peaks assigned to HDI
contains 2 methylenes (see Figure 2.10), while the two terminal -OH groups represent 1 "methylene" in terms of protons: if there were only one HDI molecule in an OH-terminated polyurethane, hydroxy and methylene protons would be in a 1:2 ratio. Peak areas can be first subjected to this ratio, so as to find the "weight" of one pair of HDI methylenes; the area of one HDI peak can then be divided by this weight.
In 1500_PU_20's case, terminal hydroxy groups have an area of 0.29, while the average of the three HDI peaks is 3.17. The 1:2 ratio is respected if it is 0.29 : 0.58; the average peak (3.17) is divided by 0.58 to give 5.47, which represents the degree of polymerization. To calculate Mn, one simply multiplies the
molecular weight of HDI (168.19 Da) and PEG-1500 by 5.47. An additional PEG molecule is added, since PEG-1500 was fed in molar excess, so as to ensure that the polyurethane was hydroxy terminated (see Experimental Section). Depending on whether one has made the calculation with with PEG-1500's Mw
provided by the manufacturer (1500) or with the Mn determined by previous
NMR calculations (1834), the resulting Mn for 1500_PU_20 is respectively
10625 or 12786 Da.
This calculation was possible only for 1500_PU_20, since it was the only polyurethane with a visible hydroxy peak. Still, it was useful in providing a piece of information that would have otherwise remained unknown.
2.4 Solubility tests.
Initial solubility tests were either qualitative, or done at concentrations of 1 mg/ml, to determine if a sample was insoluble in a particular solvent. In later tests the concentration was increased to 3 mg/ml (for 200_PU_00), in light of the concentration necessary for preparing GPC samples (2 mg/ml). In results not shown here, it was found that samples soluble in a specific solvent at 1 mg/ml were also soluble in that same solvent at 3 mg/ml or more. Table 2.6 describes the outcome of all solubility tests. Solvents were tested only at room temperature.
Sample H2O CHCl3 THF Acetone MeOH Et2O DMSO
PEG-1500* s s s s s | s DABCO(OH)2* s | -- -- -- -- s 1500_PU_001 s s s s s | s 1500_PU_051 s s | s s | s 1500_PU_201 s | | | | | s 200_PU_00(l)2 | s s | s | |
Where: s = soluble, | = not soluble, -- = not performed. Notes: *: qualitative; 1: 1 mg/ml; 2:3 mg/ml
Table 2.6. Solubility tests.
PEG-200 was not tested; from the manufacturer's technical data14 and other
tests performed in this laboratory, it was known that this compound is quite water-soluble. Since 200_PU_00's soluble fraction (l) dissolves in methanol and not water, this property was exploited in purifying it from unreacted PEG-200 (see Experimental Section).
Solubility tests on DABCO(OH)2 where not performed with all solvents, since the amount of ionomer available was limited. Furthermore, previous work done in this laboratory had shown that the compound was soluble in water and DMSO; these specific tests were essentially a confirmation of previous
The objective of these solubility tests was to determine whether a specific polymer could be analyzed by GPC, which used chloroform as the eluent (see respective section). More importantly, solubility tests were essential for determining the best strategy for purification; however, as described in the Experimental Section, purification was done by dialysis for all polymers, except 200_PU_00. This was necessary, as macrodiols and polymers were soluble in nearly all the same solvents.
2.5 Size exclusion chromatography
Size exclusion chromatography (SEC) was used for the characterization of all polymers synthesized in this work. The only exception was 1500_PU_20, which was not soluble in chloroform (see Solubility Tests); numerical average molecular weight was calculated by 1H-NMR spectroscopy (see respective
section). Table 2.7 sums up chromatographic data collected.
Sample Mn Mw PDI (Mw/Mn) PEG-200 241 273 1.130 PEG-1500 3043 3167 1.041 200_PU_00 12190 33278 2.730 1500_PU_00 10622 18366 1.729 1500_PU_05 11196 33423 2.985
All values are in Da. PDI= Polydispersity index.
Table 2.7. Molecular weights determined by GPC.
Given the values determined for the two macrodiols, the molecular weights found for all polymers indicate that a polycondensation reaction has taken place. It should be noted that these values were obtained on a size exclusion chromatograph using chloroform as the eluent, and by calibrating the instrument with monodisperse polystyrene standards15. Furthermore,
PEG-200's value has been extrapolated, as its molecular weight is below the calibration curve's lowest value (500 Da).
Data provided by PEG-200's manufacturer14 includes a molecular weight
distribution; it is possible to calculate an Mw, giving a value of 226. It should be
noted however that fractioning in the manufacturer's case was done by gas chromatography; thus this information, much like the data obtained in 1H-NMR
2.6 Fourier transform infrared spectroscopy: polyurethanes.
Samples were prepared as described in Experimental Section. In this section both of 200_PU_00's fractions, (s) and (l), were studied. For simplicity, unless otherwise stated, "200_PU_00" refers to the soluble or liquid (l) fraction; the solid fraction (s) will be specified explicitly.
Before analysing the acquired spectra, it is important to understand polyurethane spectra in general. This requires the following important pieces of information: where the urethane moiety absorbs, where the urea moiety absorbs, and how these absorptions are affected by hydrogen bonding. This section describes polyurethane spectra in general, as an introduction that aids in describing the results gathered in this work. The actual IR spectra are in the following section, Fourier transform infrared spectroscopy: functional polyurethanes.
For the purpose of an infrared spectroscopy study, the urethane moiety, -O-(C=O)-NH-,16 can be considered as consisting of an ether, carbonyl and
secondary amine group. Chemically, it is reminiscent of the amide -(C=O)-NH- group and of the ester -(C=O)-O- group. Amide carbonyls absorb around 1695-1630 cm-1, while esters absorb at higher wavenumbers, 1750-1735 cm-117,18.
The ether oxygen is generally not used as a diagnostic group for identifying polyurethanes, and in the case of PEG-based polyurethanes it becomes difficult to distinguish between urethane ethers and glycol ones; still, it is good to know that the ether moiety absorbs in the 1100-1050 cm-1 region19. Urethane
carbonyls typically absorb at 1730-1700 cm-1, a slightly lower value when
compared with ester carbonyls19–22, while urethane amines absorb in the
3450-3300 cm-1 region20; generally, urethane carbonyls along with amines are used as
diagnostic groups23–25. The lower wavenumber values for urethane carbonyl
groups, are to be attributed to the presence both of the ether oxygen and amine bonded to the C=O group. This gives rise to resonance structures in which the carbonyl oxygen is single-bonded, making for a weaker bond that absorbs at lower IR frequencies. Figure 2.14 illustrates this resonance, both in urethanes and ureas.
Figure 2.14. Resonance structures of the urethane and urea moiety.
Given that nitrogen is less electronegative than oxygen, the presence of the amine group facilitates resonance by donation of the nitrogen's lone pair. This makes for a more frequent single bond on the carbonyl carbon, when compared with a simple ester bond. In the case of ureas -NH-(C=O)-NH-, resonance happens with greater ease than in urethanes, so that the single bond on the carbonyl carbon is even more favored. These resonance structures are responsible for a weaker bond in the carbonyl group when compared to a simple ketone or even ester or amide, affecting directly the absorption frequency at which urethanes and ureas absorb26, 27.
As stated previously, the polymers described in this work were synthesized starting from diols and a diisocyanate. One reaction that competes with polyurethane formation is that of isocyanate with water, giving polyurea (see
Figure 2.2). When studying these polymers, one must keep an eye out for the
urea moiety.
The presence of urea not only implies a loss of reagent to an undesired reaction, it also means that hydrogen bonding within the polymer changes. Figure 2.15 compares hydrogen bonding in a polyurethane system with that in a polyurea one23.
Figure 2.15. Comparison of hydrogen bonding in polyurethanes and polyureas.
As can be seen, polyurethanes and polyureas differ in hydrogen bonding, in that the former are asymmetrical, and the latter are symmetrical. Furthermore, hydrogen bonding in a polyurea involves twice the number of hydrogens when compared to the situation in a polyurethane. The result is a stronger bond, and when present in sufficient amount, urea linkage can act as a physical crosslinker23,28. While this can be exploited by manufacturers29–31, it makes for
an undesirable product in pure polyurethane production, and the crosslinked polymer is generally less soluble (if not insoluble) than the non-crosslinked one29.
It becomes clear that, when examining the IR spectra of polyurethanes prepared from hygroscopic diols, one should look not only for urethane bands, but also urea ones. Figure 2.16 shows both the absorption frequencies of the urea group, and the effect hydrogen bonding has on these frequencies.
Figure 2.16. Comparison of urea absorption values in free and bonded state.
As can be seen, ureas absorb at very different wavenumbers depending on whether they are free or bonded; furthermore, when bonded they are affected by ordered or disordered hydrogen bonding. Ordered hydrogen bonding is attributed to crystalline domains in polyureas, while disordered bonding is assigned to amorphous regions.23,32,33
Examining the urea group, in the non hydrogen bonded case the carbonyl group absorbs at 1690 cm-1, a lower value than that found in other carbonyl-containing
groups (see above). The amine group absorbs in a region typical of amines, 3450 cm-1 18,23. In the hydrogen bonded case, ureas undergo a significant drop in
absorption frequency for the carbonyl and amine groups, with a distinction between ordered and disordered state. As is to be expected, carbonyl absorptions in the ordered (crystalline) state are lower than those for the disordered (amorphous) one, 1650 cm-1 and 1630 cm-1, respectively. Amine
absorptions instead don't undergo such large variations, with both ordered and disordered absorbing at about 3340-3320 cm-1. The difference between these
Figure 2.17. Comparison of urethane absorption values in free and bonded state.
Hydrogen bonded urethane carbonyls absorb at about 1707 cm-1, while free ones
absorb at 1730 cm-1, and amines absorb at 3310-3300 cm-1 and 3440 cm-1 in the
hydrogen bonded and free state, respectively20. Table 2.8 sums up urea and
urethane absorption values.
Urea Urethane
bonded non-bonded bonded non-bonded
C=O 1630 (ordered) 1690 1707 1730
1650 (disordered)
N-H 3340-3320 (ordered, sharp) 3450 3310-3300 3440
3340 (disordered, broad)
All values in cm-1.
Table 2.8. Comparison of urea and urethane absorption values.
When comparing ureas and urethanes, values are sufficiently different that it is possible to identify both moieties, in good spectra of samples with sufficient urea and urethane content.
In light of these considerations, one can examine both fractions of 200_PU_00 as an example illustrating the differences between polyurethanes and polyureas. Indeed, polyurethane synthesis - in the presence of even trace amounts of water - implies that one cannot ignore the potential presence of urea linkage.
In 200_PU_00's case, PEG-200 was used as the diol: at room temperature it is a liquid, and has a significant amount of absorbed water. Vacuum drying
reduces the water content, but as described in the Experimental Section, two fractions were obtained from polymerization: one soluble in methanol, the other insoluble in methanol and all other solvents used. The insoluble fraction is such due to appreciable amounts of water that were present in PEG-200,14 resulting
in urea linkage that altered the polymer's properties (Figure 2.18).
Figure 2.18. Spectrum of 200_PU_00 (s).
At a first glance, the spectrum of the solid fraction doesn't seem too different from that of the soluble one (Figure 2.19)
Figure 2.20. Comparison of 200_PU_00 (s) and 200_PU_00 (l), amine region.
As was described above, 200_PU_00 (s) has the characteristics of a polyurea: the amine absorption band is at 3324 cm-1, quite close to the value expected.
Moreover, the peak's shape is relatively sharp, indicating that there is a certain degree of order in the hydrogen bonding in 200_PU_00 (s). On the other hand, 200_PU_00 (l) absorbs at higher values, 3340-3330 cm-1, which in of itself is
not sufficient to distinguish a urethane amine from a urea one. Although the shape of the peak is much wider, which could be ascribed to 200_PU_00 (l) being chemically different, the peak's different shape is probably attributable to the presence of unevaporated water. The presence of only one NH per urethane moiety, and the consequent asymmetry, make for much less ordered hydrogen bonding.
Finally, if one examines the carbonyl region of both fractions (Figure 2.21), one notices a large difference between the two polymers. 200_PU_00 (s)'s carbonyl peak is at 1681 cm-1, clearly attributable to the carbonyl urea, while
200_PU_00 (l) absorbs at 1700 cm-1, typical of hydrogen-bonded urethane
linkage. The urea absoprtion is not at 1690 cm-1, nor at any other values
described in Table 2.7. This can be due to an intermediate situation between a free urea group and a disordered, bonded one: given that PEG-200 was vacuum dried and that this did eliminate an appreciable amount of water, the total urea linkage present is still not in sufficient quantity to undergo predominant urea-urea interactions. Rather, it is probable that the urea-urea linkage present interacts with the urethane groups, which are present in much larger amount. Urea
linkage is not present in sufficient amount, so as to exhibit ordered or disordered bonding measurable in the carbonyl region. Still, its presence is capable of producing an insoluble, solid fraction, even when not the predominant linkage. The effect of urea crosslinking was such that it required subjecting 200_PU_00 to centrifugation, in order to properly separate the two fractions before finishing purification. This confirms once again the importance of keeping a lookout for urea linkage.
Figure 2.21. Comparison of 200_PU_00 (s) and 200_PU_00 (l), carbonyl region.
If one compares the soluble portion of 200_PU_00 with another PEG-based polyurethane, such as 1500_PU_00 (Figure 2.22), one can employ this newfound awareness in better describing polyurethane spectra.
Figure 2.22. FTIR spectra of 200_PU_00 (above) and 1500_PU_00 (below).
As can be seen at a first glance, 200 and 1500_PU_00 are quite similar both in peak positions, and to a certain degree also in peak shape. However, a closer look indicates some appreciable differences. Figure 2.23 compares the two polymers in the amine region.
Figure 2.23. FTIR spectra of 200_PU_00 (above) and 1500_PU_00 (below); amine region.
Thanks to what is known from studying 200_PU_00's two fractions, the soluble portion consists chiefly of urethane linkage. Its amine peak is a relatively sharp one at 3327 cm-1, which is above the expected value for a bonded urethane
(3310-3300 cm-1) and below the non-bonded value (3440 cm-1). This suggests an
bonded, or at least are weakly bonded. This observation is further enforced by the relatively sharp shape of the peak, indicating some sort of partial order attributable to hydrogen bonding; this relative sharpness can be appreciated when comparing it with 1500_PU_00. As for the latter, its amine peak has a maximum at 3437 cm-1, indicating a largely non-bonded state. This can be
explained by the fact that the density of urethane linkage decreases with increasing molecular weight of the macrodiol; hydrogen bonding does occur, but much less frequently. The very broad band can be attributed to amine-ether interactions, which are more likely than amine-carbonyl ones.
The assumption that 200_PU_00 is chiefly composed of urethane linkage is confirmed, when examining its carbonyl region and comparing with that of 1500_PU_00 (Figure 2.24).
Figure 2.24. FTIR spectra of 200_PU_00 (above) and 1500_PU_00 (below); carbonyl and ether region.
Both polymers have a band at about 1700 cm-1, indicating hydrogen bonding typical of urethanes. However, there is an inversion of the relative intensities of each polymer's carbonyl and ether bands: 1700 cm-1 and 1105 cm-1 for
1500_PU_00, the situation is inverted, thanks to the higher molecular weight of its macrodiol; PEG-1500 has on average 34 repeating units, making for a much stronger ether signal and a less dense urethane linkage.
One final note on 200_PU_00 (s): given that its spectrum was acquired via ATR, ATR correction was applied, but this did not improve spectrum quality in an appreciable manner; moreover, IR spectra were only used for a qualitative comparison, so peak areas or intensities were not of vital importance. Furthermore, ATR correction did cause a small shift in peak positions, but it was an artifact of only 2 cm-1, an insignificant amount when considering the
difference between polyureas and polyurethanes (up to 50 cm-1), and the
2.7 FTIR spectroscopy: functional polyurethanes.
All polyurethanes synthesized were subjected to IR spectroscopy; intensities are expressed in absorbance or arbitrary units (AU). The goal was to compare the spectra so as to determine which functional groups were present. For this reason, peaks were compared for their position, rather than for their areas. To make the individual spectra suitable for comparison, their absorbances were adjusted by multiplying the individual spectrum by an opportune factor. Again, infrared spectroscopy was performed so as to determine which moieties were present. Information pertaining to the polymers' composition had already been obtained through 1H-NMR spectroscopy (see section).
Figure 2.25 shows the spectra of PEG-1500 and DABCO(OH)2, while Figure
2.26 compares the two in the carbonyl-ether region. The main difficulty in
interpreting the spectra of polymers synthesized was the similarity of polyurethanes with and without DABCO(OH)2.
Figure 2.25. FTIR spectrum of PEG-1500 and DABCO(OH)2.
While at first glance the two diols appear different, a closer examination in the carbonyl-ethyl region reveals that they have some crucial bands at nearly identical positions (Figure 2.26).