UNIVERSITA’ DEGLI STUDI DI VERONA
DIPARTIMENTO DI MEDICINASCUOLA di DOTTORATO di SCIENZE DELLA VITA E DELLA SALUTE
DOTTORATO di RICERCA in
SCIENZE MEDICHE, CLINICHE E SPERIMENTALI
XXVIII ciclo/2013
Tesi di Dottorato
DETERMINANTI GENETICI DI DIABETE MELLITO DI TIPO 2 E FENOTIPI CARDIOMETABOLICI ASSOCIATI
S.S.D. MED13
Coordinatore:
Prof. ENZO BONORA, MD, PhD
Tutor: Dottorando:
UNIVERSITA’ DEGLI STUDI DI VERONA
DEPARTMENT of MEDICINEGRADUATE SCHOOL of
GRADUATE SCHOOL FOR HEALTH AND LIFE SCIENCES DOCTORAL PROGRAM in
MEDICAL, CLINICAL AND EXPERIMENTAL SCIENCES
XXVIII cicle/2013
Doctoral Thesis
GENETIC DETERMINANTS OF TYPE 2 DIABETES AND ASSOCIATED CARDIOMETABOLIC DISORDERS
S.S.D. MED13
Coordinator:
Prof. ENZO BONORA, MD, PhD
Tutor: Doctoral candidate:
Genetic determinants of type 2 diabetes and associated cardiometabolic disorders – Determinanti genetici di diabete mellito di tipo 2 e fenotipi cardiometabolici associati
Marco Dauriz
Doctoral Thesis - Tesi di Dottorato Verona, 11 May 2016
ISBN
This thesis is licensed under a Creative Commons License Attribution – NonCommercial – NoDerivs 3.0 Italy CC BY-NC-ND 3.0 IT
A copy of the license is available at the following website: https://creativecommons.org/licenses/by-nc-nd/3.0/
Attribution – You must give appropriate credit, provide a link to the license, and indicate if changes were made. You may
do so in any reasonable manner, but not in any way that suggests the licensor endorses you or your use. NonCommercial – You may not use the material for commercial purposes. NoDerivatives – If you remix, transform, or build upon the material, you may not distribute the modified material.
Quest’opera è stata rilasciata con licenza Creative Commons
Attribuzione – Non commerciale – Non opere derivate 3.0 Italia (CC BY-NC-ND 3.0 IT)
Una copia della licenza è disponibile al seguente sito web: http://creativecommons.org/licenses/by-nc-nd/3.0/it/
Attribuzione – Devi riconoscere una menzione di paternità adeguata, fornire un link alla licenza e indicare se sono state
effettuate delle modifiche. Puoi fare ciò in qualsiasi maniera ragionevole possibile, ma non con modalità tali da suggerire che il licenziante avalli te o il tuo utilizzo del materiale. NonCommerciale – Non puoi usare il materiale per scopi commerciali. Non opere derivate – Se remixi, trasformi il materiale o ti basi su di esso, non puoi distribuire il materiale così modificato.
4 EXAMINATION COMMITTEE
Prof. Enzo Bonora
University of Verona (Doctoral Program Coordinator)
Prof. Cristina Giannattasio
University of Milano Bicocca (Component)
Prof. Marcello Govoni
University of Ferrara (Component)
Prof. Giovanni Targher
5 ACKNOWLEDGMENTS
The work presented in this thesis was conducted in part at the Division of Endocrinology and Metabolic Diseases, Department of Medicine, University of Verona Medical School and Hospital Trust of Verona, Verona, Italy, and in part at the General Medicine Division, Massachusetts General Hospital and Harvard Medical School, Boston, MA, USA.
The relentless supervision and the overall guidance provided by Prof. James B. Meigs (Harvard Medical School), Prof. Riccardo C. Bonadonna (University of Parma), and by Prof. Enzo Bonora (University of Verona) are gratefully acknowledged.
The individual contribution and financial disclosure statement of the research groups and collaborators at each participating Institution involved in the projects herein presented are listed in the original publication at the respective publisher’s website.
The work of Dr. M. Dauriz was supported by the financial contribution provided by the University of Verona (2012 CooperInt Junior Researcher Program 2012; 2014-2015 Research Fellowship) and by the Autonomous Province of Trento (2009-2014 Fellowship Program in Endocrinology, Diabetes and Metabolism).
No part of this thesis may be reproduced or transmitted in any form or by any means without prior permission from the author or, when appropriate, from the publishers of the publications.
6
TYPE 2 DIABETES and
ASSOCIATED CARDIOMETABOLIC
DISORDERS
7
Certainty in science went out of fashion early last century following Heisenberg’s postulates. We now see ranges and confidence intervals around any given mode, mean, or median. Truth, in short, is a dependent variable.
R. David G. Leslie & Eric S. Kilpatrick Diabetes Care, 2009 Jan;32(1):e11
8 TABLE OF CONTENTS List of Publications 11
Chapter 1 Preface / Prefazione 16
Chapter 2 Current Insights into the Joint Genetic Basis of Type 2
Diabetes and Coronary Heart Disease 21
2.1 Abstract (English/Italian) 22
2.2 Introduction 24
2.2.1 Recent Type 2 Diabetes Genome-Wide Association
Studies (GWAS) 25
2.2.2 Recent Coronary Heart Disease GWAS 26 2.2.3 Recent Glycemic Quantitative Traits GWAS 27
2.3 The chromosome 2q36.3-IRS1 locus 28
2.4 The chromosome 9p21.3 locus 30
2.5 Summary 32
2.6 Implications and future directions 33
2.7 Figures and Tables 36
2.7.1 Tables 36
2.7.2 Figures 39
2.8 References 43
Chapter 3 Association of a 62 Variants Type 2 Diabetes Genetic
Risk Score With Markers of Subclinical
Atherosclerosis: A Transethnic, Multicenter Study 48
3.1 Abstract (English/Italian) 49
3.2 Introduction 53
3.2.1 Background 53
3.2.2 Objective 53
9 3.3.1 Study populations 54
3.3.2 Assessment of subclinical atherosclerosis 56
3.3.3 Genotyping 56
3.4 Statistical Analysis 57
3.5 Results 59
3.6 Discussion 60
3.7 Conclusions 63
3.8 Figures and Tables 65
3.8.1 Tables 65
3.8.2 Figures 67
3.9 References 74
Chapter 4 Is common genetic variation at IRS1, ENPP1 and
TRIB3 loci associated with cardiometabolic phenotypes in type 2 diabetes? An exploratory analysis of the
Verona Newly Diagnosed Type 2 Diabetes Study 79
4.1 Abstract (English/Italian) 80 4.2 Introduction 83 4.3 Methods 84 4.3.1 Study population 84 4.3.2 Genotyping 85 4.3.3 Cardiometabolic phenotyping 85 4.3.4 Analytical Methods 87 4.3.5 Calculations 87 4.4 Statistical Analysis 88 4.5 Results 89 4.6 Discussion 90 4.7 Conclusions 94
4.8 Figures and Tables 95
4.8.1 Tables 95
4.8.2 Figures 99
10
Chapter 5 A Genetic Risk Score of 96 Variants linked with Type 2
Diabetes and Cardiometabolic Risk Traits is Associated with Cardiovascular Mortality in 29-years Follow-up of
the Framingham Heart Study 106
5.1 Abstract (English/Italian) 107 5.2 Introduction 110 5.3 Methods 111 5.4 Results 114 5.5 Discussion 115 5.6 Tables 117 5.7 References 121
Chapter 6 Supplemental material 123
6.1 Authors and affiliations 124
6.2 Supplemental material Chapter 3 129
11
List of Publications
12
PUBLICATIONS AND MANUSCRIPTS BASED ON THE STUDIES DESCRIBED IN THIS THESIS
Chapter 2
Marco Dauriz, James B. Meigs
Current Insights into the Joint Genetic Basis of Type 2 Diabetes and Coronary Heart Disease
Curr Cardiovasc Risk Rep (2014) 8(1):368 – PMID: 24729826
Chapter 3
Marco Dauriz, Bianca C. Porneala, Xiuqing Guo, Lawrence F. Bielak, Patricia A. Peyser,
Nefertiti H. Durant, Mercedes R. Carnethon, Riccardo C. Bonadonna, Enzo Bonora, Donald W Bowden, Jose C. Florez, Myriam Fornage, Marie-France Hivert, David R. Jacobs Jr, Edmond K. Kabagambe, Cora E. Lewis, Joanne M Murabito, Laura J. Rasmussen-Torvik, Stephen S. Rich, Jason L. Vassy, Jie Yao, Jeffrey J Carr, Sharon L. Kardia, David Siscovick, Christopher J. O'Donnell, Jerome I. Rotter, Josée Dupuis, James B. Meigs
Association of a 62 Variants Type 2 Diabetes Genetic Risk Score With Markers of Subclinical Atherosclerosis: A Transethnic, Multicenter Study
Circ Cardiovasc Genet. 2015 Jun;8(3):507-15 – PMID: 25805414
Chapter 4
Maddalena Trombetta*, Marco Dauriz*, Sara Bonetti*, Daniela Travia, Maria Linda
Boselli, Lorenza Santi, Enzo Bonora, Riccardo C Bonadonna
* Equal contribution.
Is common genetic variation at IRS1, ENPP1 and TRIB3 loci associated with cardio metabolic phenotypes in type 2 diabetes? An exploratory analysis of the Verona Newly Diagnosed Type 2 Diabetes Study
13 Chapter 5
Marco Dauriz, Bianca C Porneala, Josée Dupuis, Joanne M Murabito, Adrianne L
Cupples, Jose C Florez, James B Meigs
A Genetic Risk Score of 96 Variants linked with Type 2 Diabetes and Cardiometabolic Risk Traits is Associated with Cardiovascular Mortality in 29-years Follow-up of the Framingham Heart Study
In preparation
OTHER RELEVANT PUBLICATIONS
Vassy JL, Hivert MF, Porneala B, Dauriz M, Florez JC, Dupuis J, Siscovick DS, Fornage M, Rasmussen-Torvik LJ, Bouchard C, Meigs JB.
Polygenic type 2 diabetes prediction at the limit of common variant detection Diabetes. 2014 Jun;63(6):2172-82
Walford GA, Porneala BC, Dauriz M, Vassy JL, Cheng S, Rhee EP, Wang TJ, Meigs JB, Gerszten RE, Florez JC
Metabolite traits and genetic risk provide complementary information for the prediction of future type 2 diabetes
Diabetes Care. 2014 Sep;37(9):2508-14
Cornes BK, Brody JA, Nikpoor N, Morrison AC, Dang HC, Ahn BS, Wang S, Dauriz M, Barzilay JI, Dupuis J, Florez JC, Coresh J, Gibbs RA, Kao WH, Liu CT, McKnight B, Muzny D, Pankow JS, Reid JG, White CC, Johnson AD, Wong TY, Psaty BM, Boerwinkle E, Rotter JI, Siscovick DS, Sladek R, Meigs JB
14
Association of levels of fasting glucose and insulin with rare variants at the chromosome 11p11.2-MADD locus: Cohorts for Heart and Aging Research in Genomic Epidemiology (CHARGE) Consortium Targeted Sequencing Study
Circ Cardiovasc Genet. 2014 Jun;7(3):374-82 – PMID: 24951664
Wessel J, Chu AY, Willems SM, Wang S, Yaghootkar H, Brody JA, Dauriz M, Hivert MF, Raghavan S, Lipovich L, Hidalgo B, Fox K, Huffman JE, An P, Lu Y, Rasmussen-Torvik LJ, Grarup N, Ehm MG, Li L, Baldridge AS, Stančáková A, Abrol R, Besse C, Boland A, Bork-Jensen J, Fornage M, Freitag DF, Garcia ME, Guo X, Hara K, Isaacs A, Jakobsdottir J, Lange LA, Layton JC, Li M, Hua Zhao J, Meidtner K, Morrison AC, Nalls MA, Peters MJ, Sabater-Lleal M, Schurmann C, Silveira A, Smith AV, Southam L, Stoiber MH, Strawbridge RJ, Taylor KD, Varga TV, Allin KH, Amin N, Aponte JL, Aung T, Barbieri C, Bihlmeyer NA, Boehnke M, Bombieri C, Bowden DW, Burns SM, Chen Y, Chen YD, Cheng CY, Correa A, Czajkowski J, Dehghan A, Ehret GB, Eiriksdottir G, Escher SA, Farmaki AE, Frånberg M, Gambaro G, Giulianini F, Goddard WA 3rd, Goel A, Gottesman O, Grove ML, Gustafsson S, Hai Y, Hallmans G, Heo J, Hoffmann P, Ikram MK, Jensen RA, Jørgensen ME, Jørgensen T, Karaleftheri M, Khor CC, Kirkpatrick A, Kraja AT, Kuusisto J, Lange EM, Lee IT, Lee WJ, Leong A, Liao J, Liu C, Liu Y, Lindgren CM, Linneberg A, Malerba G, Mamakou V, Marouli E, Maruthur NM, Matchan A, McKean-Cowdin R, McLeod O, Metcalf GA, Mohlke KL, Muzny DM, Ntalla I, Palmer ND, Pasko D, Peter A, Rayner NW, Renström F, Rice K, Sala CF, Sennblad B, Serafetinidis I, Smith JA, Soranzo N, Speliotes EK, Stahl EA, Stirrups K, Tentolouris N, Thanopoulou A, Torres M, Traglia M, Tsafantakis E, Javad S, Yanek LR, Zengini E, Becker DM, Bis JC, Brown JB, Cupples LA, Hansen T, Ingelsson E, Karter AJ, Lorenzo C, Mathias RA, Norris JM, Peloso GM, Sheu WH, Toniolo D, Vaidya D, Varma R, Wagenknecht LE, Boeing H, Bottinger EP, Dedoussis G, Deloukas P, Ferrannini E, Franco OH, Franks PW, Gibbs RA, Gudnason V, Hamsten A, Harris TB, Hattersley AT, Hayward C, Hofman A, Jansson JH, Langenberg C, Launer LJ, Levy D, Oostra BA, O'Donnell CJ, O'Rahilly S, Padmanabhan S, Pankow JS, Polasek O, Province MA, Rich SS, Ridker PM, Rudan I, Schulze MB, Smith BH, Uitterlinden AG, Walker M, Watkins H, Wong TY, Zeggini E; EPIC-InterAct Consortium, Laakso M, Borecki IB,
15
Chasman DI, Pedersen O, Psaty BM, Tai ES, van Duijn CM, Wareham NJ, Waterworth DM, Boerwinkle E, Kao WH, Florez JC, Loos RJ, Wilson JG, Frayling TM, Siscovick DS, Dupuis J, Rotter JI, Meigs JB, Scott RA, Goodarzi MO
Low-frequency and rare exome chip variants associate with fasting glucose and type 2 diabetes susceptibility
Nat Commun. 2015 Jan 29;6:5897 – PMID: 25631608
Willems SM, Cornes BK, Brody JA, Morrison AC, Lipovich L, Dauriz M, Chen Y, Liu CT, Rybin DV, Gibbs RA, Muzny D, Pankow JS, Psaty BM, Boerwinkle E, Rotter JI, Siscovick DS, Vasan RS, Kaplan RC, Isaacs A, Dupuis J, van Duijn CM, Meigs JB Association of the IGF1 gene with fasting insulin levels.
Eur J Hum Genet. 2016 Feb 10. doi: 10.1038/ejhg.2016.4 – PMID: 26860063
Dauriz M, Meigs JB The power of numbers.
Invited Commentary - Diabetologia. 2016 Apr 26 – PMID: 27115413
Buzzetti R, Prudente S, Copetti M, Dauriz M, Simona Zampetti, Garofalo M, Penno G, Trischitta V
Genetic prediction of common forms of diabetes mellitus and related chronic complications. Still much work to do.
Under submission
16
Chapter 1
Preface / Prefazione
17
Preface
Since the earliest steps in this Doctoral Program I envisioned this journey as consisting of three steps: (1) to become comfortable with the state-of-the-art of genetic epidemiology and get organizational skills to correctly and productively frame ideas, manage datasets and biobanks and to deal with international research consortia; (2) to learn how to compellingly write research proposals and scientific reports, discuss and share results, critically review and support the work of other research groups involved in the field of diabetes, obesity and cardiovascular disease from a wide variety of perspectives (from wet lab to clinical epidemiology); (3) to finalize for publication original research papers on the topics outlined above.
To this end, in 2013-2014 I had the opportunity to get a formal training in scientific methodology and writing, epidemiology, medical and population genetics at Harvard University in Boston. This experience led to the publication of several papers in high-impact scientific journals and continuing collaboration with the Framingham Heart Study group, MAGIC and CHARGE Consortia is still fruitfully ongoing. Since my arrival back in Italy in July 2014 I have continued to work on the projects I started in Boston, while disseminating scientific knowledge by actively attending to several national and international meetings.
The unprecedented experience accrued while working with the Framingham Investigators and other international leaders in the field of (genetic) epidemiology led to create the overarching framework of my current activity, which aims at bringing together the genetic determinants of diabetes, obesity, cardiovascular disease and intermediate traits and to understand their relationship with the pathophysiology of the glucose-insulin system.
18
T2D is a complex disease characterized by a high prevalence and incidence worldwide, and recognizes genetic and non-genetic (environmental) risk factors as underlying determinants. CVD are currently one of the leading causes of death and are also often clinically associated to T2D. Recent large-scale genome-wide association studies (GWAS) have identified common genetic risk variants associated with a higher propensity of developing T2D, CVD and intermediate cardiometabolic phenotypes.
The goal of the research project herein presented was three-fold: (1) to critically revise the available literature about the genetic determinants of type 2 diabetes (T2D), coronary heart disease (CHD) and intermediate phenotypes (sub-diabetic hyperglycemia, measures of subclinical atherosclerosis (SCA) and associated risk conditions), aimed at searching for potential overlapping areas of shared genetic background; (2) to verify whether the genetic determinants of T2D, and particularly those associated with insulin resistance, are also associated with measures of SCA; (3) to verify whether a genetic risk score comprised of the genetic determinants of T2D, myocardial infarction, stroke, atrial fibrillation, sudden cardiac death, coronary heart disease, is associated with an excess risk of all-cause mortality and/or CVD death.
In detail, the present research exercise aimed at exploring the common genetic background of T2D, CVD and sub-diabetic forms of hyperglycemia by means of three exemplifying studies herein outlined. The first study verified whether the genetic risk for T2D, as represented by the aggregate burden of T2D risk loci (either as a whole or by distinct functional sub-groups, representative of loci with prior evidence of association with defective beta-cell function and/or increased insulin resistance), is associated with SCA traits in multi-ethnic cohorts.
The second study verified the hypothesis that the common genetic variability at loci gatekeepers of the insulin signaling transduction pathway are associated with
19
insulin resistance, beta-cell dysfunction, pathologic electrocardiogram, and/or increased SCA in patients affect by newly-diagnosed T2D.
The third study verified whether the composite of the genetic determinants of T2D and intermediate CVD risk traits is associated with a higher mortality in the Framingham Offspring Study.
Prefazione
Il presente progetto di ricerca si compone di tre parti: (1) revisione della letteratura relativa ai determinanti genetici di diabete mellito tipo 2, malattie coronariche e fenotipi intermedi (forme sub-diabetiche di iperglicemia, forme subcliniche di aterosclerosi e fattori di rischio associati) alla ricerca di possibili aree di sovrapposizione; (2) verificare se i determinanti di rischio genetico per diabete tipo 2, ed in particolare quelli maggiormente associati a insulino-resistenza, sono anche associati a misure di aterosclerosi subclinica; (3) verificare se uno score di rischio genetico costituito dai determinanti genetici di diabete tipo 2, infarto miocardico, stroke, fibrillazione atriale, morte cardiaca improvvisa, malattie coronariche è associato a mortalità per tutte le cause e/o mortalità per malattie cardiovascolari.
Il diabete mellito di tipo 2 (T2D) è una malattia complessa ad alta prevalenza e incidenza che riconosce fattori genetici e non-genetici quali determinanti causali. Le malattie cardiovascolari (CVD) sono una delle maggiori cause di morte e sono spesso associate a T2D. Studi di associazione genome-wide hanno identificato varianti genetiche comuni associate a T2D, CVD e fenotipi cardiometabolici intermedi.
20
Questo percorso di ricerca si è proposto di individuare le basi genetiche comuni a T2D, CVD e forme sub-diabetiche di iperglicemia attraverso tre studi esemplificativi. Nel primo studio è stato verificato se il rischio genetico per T2D sia associato, in aggregato e/o in sottogruppi funzionali distinti (disfunzione beta-cellulare o insulino-resistenza), a tratti di aterosclerosi subclinica (ATS) in coorti multi-etniche. Il secondo studio ha testato l’ipotesi che la variabilità genetica comune dei loci principalmente coinvolti nella trasduzione del segnale insulinico siano associati a insulino-resistenza, funzione beta-cellulare, anomalie elettrocardiografiche e/o aterosclerosi subclinica in soggetti affetti da T2D neo-diagnosticato. Nel terzo studio è stato indagato se il rischio genetico per T2D e tratti di rischio cardiometabolico sia associato ad aumentata mortalità nel Framingham Offspring Study.
21
Chapter 2
Current Insights into the Joint Genetic Basis of
Type 2 Diabetes and Coronary Heart Disease
Curr Cardiovasc Risk Rep (2014) 8(1):368
22 2.1 ABSTRACT
English - The large-scale genome-wide association studies conducted so far identified numerous allelic variants associated with type 2 diabetes (T2D), coronary heart disease (CHD) and related cardiometabolic traits. Many T2D- and some CHD-risk loci are also linked with metabolic traits that are hallmarks of insulin resistance (lipid profile, abdominal adiposity). 9p21.3 and 2q36.3, are the most consistently replicated loci appearing to share genetic risk for both T2D and CHD. Although many glucose- or insulin-related trait variants are also linked with T2D risk, none of them is associated with CHD. Hence, while T2D and CHD are strongly clinically linked together, further ongoing analyses are needed to clarify the existence of a shared underlying genetic signature of these complex traits. The present review summarizes an updated picture of T2D-CHD genetics as of 2013, aiming to provide a platform for targeted studies dissecting the contribution of genetics to the phenotypic heterogeneity of T2D and CHD.
Italian - Gli studi su larga scala del genoma hanno sinora identificato numerose varianti alleliche associate a diabete mellito tipo 2 (DMT2), malattie coronariche (CHD) e a fenotipi intermedi di rischio cardiometabolico. Molti loci associati a DMT2 ed alcuni associati a CHD sono anche associati a tratti metabolici caratteristici dell’insulino-resistenza (profilo lipidico, adiposità addominale). I loci 9p21.3 e 2q36.3 sono stati più volte identificati quali determinanti genetici di rischio all’intersezione tra DMT2 e CHD. Benchè tuttavia molte varianti genetiche associate a glicemia, insulinemia e fenotipi ad essi correlati siano anche associate a un aumentato rischio per DMT2, nessuna è risultata associata a CHD. Pertanto, benchè sia evidente che DMT2 e CHD sono fortemente associati clinicamente, ulteriori studi sono necessari per chiarire se questi complessi fenotipi riconoscano una base genetica comune. In questo riassunto viene fornito
23
un quadro aggiornato delle conoscenze relativa ai determinanti genetici di DMT2 e CHD e si propone di fornire una base per esplorare l’eterogeneità fenotipica che caratterizza DMT2 e CHD.
Abbreviations
CARDIoGRAM Coronary ARtery DIsease Genome wide Replication and Meta-analysis Consortium
C4D Coronary Artery Disease Genetics Consortium DIAGRAMv3 DIAbetes Genetics Replication and Meta-analysis MAGIC Meta-Analyses of Glucose- and Insulin-related traits
Consortium
WTCC Wellcome Trust Case Control Consortium
GWAS Genome Wide Association Study
T2D Type 2 Diabetes
CHD Coronary Heart Disease
MI Myocardial Infarction
LD Linkage Disequilibrium
SNP Single Nucleotide Polymorphism
MAF Minor Allele Frequency
BMI Body Mass Index
WHR Waist-to-Hip Ratio
HOMA-B Homeostatic Model Assessment of Beta-Cell Function HOMA-IR Homeostatic Model Assessment of Insulin Resistance
24 2.2 INTRODUCTION
The global epidemic of type 2 diabetes (T2D) and associated cardiovascular diseases is increasing tremendously despite great efforts in prevention and treatment [1]. Cardiovascular diseases, especially coronary heart disease (CHD), represent the leading cause of death worldwide [2] and alarming projections for upcoming years require new and more effective strategies [3].
Better understanding of mechanisms underlying disease etiology and disease pathogenesis is the sine qua non to move forward and is a major goal of recent genetic studies on T2D and CHD [4]. Both T2D and CHD constitute the paradigm of common complex traits and have been an exciting and highly productive arena in the field of genetics: the last decade witnessed an impressive growth of available information about the genetic architecture of T2D and CHD. Interestingly, the growing amount of available information has revealed many apparently overlapping genetic signals that share association with T2D and CHD, especially in and near chromosome 9p21.3 [5-9] and 2q36.3 [10, 11], and at several other loci harboring variants associated with fasting glucose or insulin and other cardiometabolic traits (for instance, levels of lipids and anthropometric measures) that increase risk for CHD and/or T2D [12, 13].
The present review will outline and discuss the results from large-scale association analyses for T2D [14], CHD [15] and glycaemic traits [12] published in the last year (2012-2103), and integrate the evidence on chromosomal regions at 9p21.3 and 2q36.3 loci to provide a plausible, though not exhaustive, explanation at the genetic level of the common soil underlying CHD, T2D and associated metabolic traits.
25
2.2.1 Recent Type 2 Diabetes Genome-Wide Association Studies (GWAS)
In 2012, the DIAbetes Genetics Replication and Meta-analysis Consortium published the largest to date association analysis for T2D (DIAGRAMv3) [14]. The study, combined with the 2011 genome-wide association study (GWAS, see the glossary in Table 1) of Cho et al. [16] in roughly 55,000 East Asians, brought to 65 the number of independent T2D susceptibility loci (Table 2), thus further extending an effort begun a few years ago [17] to unveil the common allelic architecture of T2D. The strategy took advantage of the experience accumulated in the field of GWAS and the availability of the Metabochip custom array [18] for cost-effective follow-up genotyping. The case-control, two-stage DIAGRAMv3 meta-analysis was conducted in nearly 150,000 subjects (34,840 T2D cases and 114,981 controls) mostly of European ancestry from 38 independent cohorts. The study found 10 new T2D variants of modest effect size in or near ZMIZ1, ANK1, KLHDC5, TLE1, ANKRD55, CILP2, MC4R, BCAR1, HMG20A and GRB14. Linkage disequilibrium (LD) analysis and previous reports showed that the lead SNP at many of these loci was also associated with T2D-related metabolic traits that overlap CHD risk factors such as body-mass index (BMI), waist circumference, and insulin resistance (MC4R), triglyceride concentration (MC4R, CILP2), waist-to-hip ratio (WHR) (GRB14), HDL-cholesterol (GRB14, CILP2) and total-cholesterol (CILP2). Interestingly, as clearly shown in Figure 1 and thoroughly detailed in the following sections, there is also compelling evidence that specific T2D loci on chromosome 2q36.3 and 9p21.3 harbor allelic variants in close proximity to each other and marking genomic regions associated with increased CHD risk.
26
2.2.2 Recent Coronary Heart Disease GWAS
As detailed in Table 2 the number of loci currently known to be associated with coronary heart disease at genome-wide significance level have reached 45, thanks to the joint effort undertaken by the CARDIoGRAM-C4D Consortium on a sample of nearly 200,000 individuals (63,746 CHD cases and 130,681 controls in Stage1 + Stage2) [15]. This study, published in early 2013, confirmed previous findings [11, 19], discovered 15 new genome-wide significant loci and tested them by a thorough association analysis with traditional CHD risk factors. Twelve loci (APOB, ABCG5-ABCG8, PCSK9, SORT1, ABO, LDLR, APOE and LPA) showed genome-wide significance for association with at least one lipid trait in the expected direction. The CHD-raising allele was also associated with abnormal lipid levels, the strongest association being with LDL-cholesterol; CYP17A1-NT5C2, SH2B3, GUCY1A3, FES and ZC3HC1 were associated with blood pressure; CYP17A1-CNNM2-NT5C2 and RAI1-PEMT-RASD1 loci were associated with BMI and WHR. Notably, there was no overlap with specific T2D or glycaemic trait-associated variants (fasting insulin, fasting plasma glucose, HOMA-B and HOMA-IR) for any of the SNPs analyzed (Figure 1).
Taken together, the overall spectrum of 65 T2D and 45 CHD genome-wide associated common variants explain only a small fraction (∼10% each) of disease heritability, thus leaving a large unfilled space under the umbrella of the common variant/common disease hypothesis [20]. Indeed, a great proportion of common genetic variance is predicted to occur in non-coding regions at the level of structural variation, such as deletions, insertions, inversions and copy number variants, which might be imperfectly tagged or under-represented in current GWAS arrays [21]. Large scale sequencing studies currently underway may help to fill in some of the unfilled space under the umbrella of the genetic basis of T2D
27
and CHD by identifying less common or regulatory variants underlying these diseases.
2.2.3 Recent Glycaemic Quantitative Traits GWAS
Valuable details concerning quantitative risk factors were added to the overall picture in 2012 by two large-scale association analyses from the Meta-Analyses of Glucose and Insulin-related traits (MAGIC) Consortium [12, 22] that further enlightened our understanding of the genetic determinants of overlapping risk factors for T2D and CHD (see Table 3).
The joint meta-analysis by Manning et al. [22] in nearly 100,000 non-diabetic subjects of European ancestry investigated the genetic variability of insulin resistance by testing on a genome-wide basis the interaction of body mass index with fasting glucose and insulin. Based on previous experience from MAGIC [23] a new computational approach accounting for potential interactions between BMI and genetic variants was applied, enabling the discovery of 13 previously unknown SNPs associated with fasting insulin (FI) or fasting glucose (FG) at genome-wide significance. Among the FI-loci, the lead SNP in or near IRS1, COBLL1-GRB14, PDGFC or LYPLA1 was also associated with an increased risk for T2D (Figure 1, Table 3), the strongest signal being for the chr2q36.3-IRS1 locus (rs2943634). Notably, as detailed in Table 3, the risk allele of most of the FI-SNPs identified were also associated with metabolic phenotypes related to insulin resistance and CHD risk (for instance, detrimental lipid profile, higher WHR). None of the FG-loci showed association with any insulin resistance-cardiometabolic trait, and only ARAP1 was associated with T2D (Table 3). These results are complementary to the GWAS conducted by Scott et al. [12], which identified 41 previously undiscovered [23, 24] glycaemic associations in up
28
to 133,010 non-diabetic individuals of European descent by combining previous discovery MAGIC data with newly Metabochip-genotyped samples. Scott et al. and Manning et al. jointly raised the number of non-overlapping loci influencing glycaemic traits (FI, FG, post-challenge glucose concentration) to 55 (53 confirmed loci in Scott et al. plus 2 additional and potentially independent signals from Manning et al., associated with FG and lying, respectively, in or near OR4S1 and DPSYL5 genes); 34 of them are also at least nominally associated with increased T2D risk (Figure 1), and most of the FI-raising loci showed directionally consistent associations with abdominal obesity and/or higher triglycerides-to-HDL cholesterol ratio (Tg/HDL) (Table 3).
2.3 THE CHROMOSOME 2q36.3-IRS1 LOCUS
The evidence described above suggests that loci associated with signatures of insulin resistance are fairly good candidates mechanistically linking the overlap between T2D, CHD and glycaemic quantitative traits. As pointed out in Figure 1 and Figure 2, one of the most promising regions is a large locus spanning ∼593 kb located on chromosome 2q36.3 and harboring the IRS1 gene, a key mediator along the insulin signaling pathway. Over the past few years many large-scale association studies from different research groups including Manning et al. and Scott et al. led to the identification of a cluster of SNPs (rs2943634, rs2043640, rs2943641, rs2943650, rs2972146, rs2943645) in high LD with each other (0.75<r2<1.00; 1000 Genomes Pilot 1 CEU population) and associated with T2D, CHD, increased FI, higher Tg/HDL and/or low subcutaneous-to-visceral fat ratio [11-14, 22, 25, 26]. A recent basic science report by Li et al. [27] also clarified that these variants are located in two major sites ∼600 kb and ∼1 Mb downstream from the IRS1 gene promoter and might physically regulate IRS1 gene expression
29
by looping interactions, explaining how putative regulatory regions far from IRS1 might regulate insulin sensitivity. The variant rs2943634 deserves a special mention (Figure 2A) as the only one SNP discovered so far in 2q36.3 region directly associated with increased CHD risk –though at slightly below genome-wide significant (p=1.61x10⁻⁷) by the WTCC and Cardiogenics Consortium GWAS effort in 2007 [11].
That said, since insulin resistance and its associated traits have also been proposed as common pathophysiological background underlying CHD risk and the diabetic atherogenic context [28], Lim et al. [29] early in 2013 further investigated whether the genetic variation at 2q36.3 locus might also affect CHD risk via subclinical atherosclerosis in a sample of 2740 Framingham Heart Study participants. The study examined the cluster of SNPs described above along with 195 additional genotyped or imputed SNPs in 2q36.3 locus, testing them for association with subclinical atherosclerosis traits, but failed to find any correlation, despite an adequate sample size and detailed phenotypic characterization. The only significant association between rs10167219 (r2 with rs2943634 = 0.07) and ankle-brachial index (ABI) was not confirmed after a validation step in a larger ABI meta-analysis [30].
On the other hand, Bacci et al. [10] found that functional candidate variants of insulin signaling genes, including IRS1 G972R (rs1801278) (regional plot shown in Figure 2B), ENPP1 K121Q (rs1044498) and TRIB3 Q84R (rs229549), summed in a genetic risk score (GRS), jointly nominally predicted a composite endpoint of incident cardiovascular events in a sample of 733 type 2 diabetic patients, The GRS was also associated with decreased insulin sensitivity, and functional analysis in human vascular endothelial cells (HUVEC) showed that the GRS was inversely related with insulin-stimulated nitric oxide synthase activity. Hence, depending on the outcome measured, whether atherosclerotic plaque formation or coronary heart disease events, current insights on 2q36.3 locus are
30
still far from conclusive with much remaining to be understood at a mechanistic level.
2.4 THE CHROMOSOME 9p21.3 LOCUS
As shown in Figure 1 and Table 2, only two of the 65 T2D genome-wide associated loci [14, 16] but none of the common variants at these loci clearly overlaps any of the 45 CHD loci [15]. The example provided by 9p21.3 locus, a large genomic region spanning ∼53 kb, is paradigmatic in this sense, owing to its unique haplotype structure (Figure 2B). Notably, this locus is associated with both CHD and T2D in European ancestry individuals [5, 7-9] and also in Chinese Han individuals as shown in 2011 by Cheng et al. [6].
The 9p21.3 locus has been extensively studied over the past years and has been historically primarily linked with an increased risk of CHD and myocardial infarction [11, 31], as confirmed by the recent GWAS conducted by CARDIoGRAM-C4D Consortium [15]. The numerous CHD-associated SNPs identified thus far in this interval are characterized by high LD with each other, thus representing a distinct region robustly associated with CHD. In 2013 additional insights in the haplotype structure of this CHD-risk interval have become available. In a case-control study conducted in nearly 3,700 non-diabetic white subjects, Fan et al. [32] successfully showed that atherosclerotic plaque formation is determined by a set of allelic variants physically distinct from the haplotype that predicts MI, namely, vulnerable plaque rupture and thrombosis. The 9p21.3 locus does not house protein-coding genes; the closest, CDKN2ABS1, CDKN2A/B, and ABO, are 120 kb from the principal index SNPs at the locus. As well highlighted by a recent editorial by McPherson [33], a mechanistic explanation to unambiguously clarify the contribution of 9p21.3 CHD-associated
31
SNPs to atherosclerosis and MI is still missing. Long range regulatory interactions with distant coding regions, tissue-specific effects of 9p21.3 CHD susceptibility SNPs and interactions with inflammation have been hypothesized, [34], but current results are conflicting and a clear mechanistic model for the genetic effects at this locus remain to be identified [35, 36].
With respect to T2D risk, as found by Morris et al. [14], chromosome 9p21.3 also encompasses variants strongly associated with T2D (Table 2) and spatially arranged in a very tight genomic region adjacent but distinct from that harboring the CHD-associated SNPs. As shown in Figure 2C-D, it is well ascertained that the haplotype structure of 9p21.3 locus stands on two main regions or “blocks” [8]: one large segment spans roughly 44 kb and hosts the CHD LD region (lead-SNP: rs1333049); on the other side of a recombination peak lies a 4kb T2D-associated block (SNP: rs10811661). The LD between the respective lead-SNPs of T2D and CHD blocks [15] is very low (r2<0.009; 1000 Genomes Pilot 1 CEU population). The two regions have a low chance of mixing together during recombination, thus suggesting a distinct pattern of inheritance.
However, the DIAGRAMv3 GWAS identified an additional lead SNP at a putative independent secondary T2D signal (rs944801; r2=0.01 with rs10811661) [14] within the CHD-haplotype block (Figure 3C). This T2D-associated SNP is in modest LD (r2=0.35) with the CHD lead-SNP (rs1333049), thus indicating a potential region close to the CDKN2A/B genes jointly affecting CHD and T2D. Functional studies to parse in depth the contribution, if any, to both T2D and CHD of this and other variants within 9p21.3 locus is a challenging task that is worth pursuing further.
32 2.5 SUMMARY
Large-scale GWAS have been a powerful tool to uncover common genetic signatures strongly associated with common complex diseases like T2D, CHD and associated cardiometabolic traits. Here we reviewed the most recent findings in this field, highlighting the hitherto confirmed overlapping associations among T2D, CHD and glycaemic trait susceptibility loci.
The papers in the last year by the DIAGRAM, Cardiogram-C4D and MAGIC consortia showed that a few GWAS-discovered loci overlap both T2D and CHD risk, and for quantitative traits, a larger fraction of glycaemic trait raising alleles are also associated with T2D risk and CHD quantitative risk factors. In particular, FI-raising alleles show a directionally consistent link with increased T2D risk and adverse lipid and anthropometric measures. These results suggest that many FI-associated loci represent insulin resistance loci that potential provide a genetic underpinning for joint T2D-CHD risk. The 2q36.3-IRS1 locus in particular has emerged as a crossroad for signals associated with T2D-CHD risk. However, a firm and comprehensive functional explanation of the role played by 2q36.3-IRS1 remains to be shown, especially towards CHD risk. For instance, 2q36.3 locus harbors variants that, taken together, seem to play heterogeneous genetic effects on atherosclerotic plaque formation/rupture [10, 29]. Interestingly, compelling evidence exists for the association between cardiovascular events and the candidate functional variant IRS1 G972R (rs1801278) [10]. Unfortunately, this variant lacks of GWAS confirmation despite being quite common (MAF 5.4%), probably because no proxy for rs1801278 mapping in or near other known variants in 2q36.3 locus is presently available in any available SNP data set. Thus, absence of evidence for a clear role of this variant is due to absence of evidence, not evidence of no role. Genotyping of this variant in large, independent samples is needed for firm confirmation of this coding variant’s role in CHD risk.
33
The role of the 9p21.3 locus on T2D-CHD risk needs further elucidation, as well. It has a peculiar haplotype structure organized in two contiguous but distinct blocks conferring risk, respectively, for T2D and CHD/MI. However there appears to be a variant, rs944801, that may be an independent secondary T2D signal amidst the CHD-haplotype block. Targeted confirmatory association and functional studies are needed to further investigate joint risk of T2D-CHD in this haplotype block.
2.6 IMPLICATIONS AND FUTURE DIRECTIONS
A number of possible confounding elements may explain why association results should be taken with, perhaps, a grain of salt [21, 37, 38]. First, as pointed out by Wray et al. [38], GWAS are capable, by design, to explain only a small fraction (currently 10%, on average) of disease heritability and are intrinsically underpowered to uncover the “missing inheritance” carried by rare and low-frequency variants; second, the nature of the association is essentially statistical and in most cases doesn't tell much about the functional effect, if any, of the SNPs identified, thus limiting the predictive power of the loci discovered so far [21]; third, most of the GWAS SNPs lie in non-coding DNA regions and might work as regulatory or chromatin-modulating variants with unknown distant cis/trans effect on gene expression [37]; and finally, possible limitations including imperfect tagging due to insufficiently dense SNP arrays cannot be excluded.
Another possibility is that diabetic and non-diabetic individuals might have distinct mechanisms of CHD risk. For instance, an increased burden of T2D-associated GWAS risk variants is T2D-associated with cardiovascular disease risk in individuals with T2D [39], but CHD risk at chromosome 9p21.3 is only raised in
34
T2D among those with elevated HbA1c levels [40], and the recently discovered variant on chromosome 1q25 associated with glutamic acid metabolism and CHD risk in T2D has not been observed in large scale non-diabetic CHD GWAS [41]. Further dissection of the joint genetic association of T2D and CHD versus the interaction of T2D on genetic risk for CHD will require additional careful untangling in large scale association studies and follow-up functional and physiological studies.
Future research might also focus on pleiotropy analyses of variants with less stringent evidence for genome-wide significance. For instance, as detailed in Table 3, the link between glycaemic trait raising alleles with lipids and BMI is physiologically consistent and statistically convincing for “true” associations, though in most cases not strong enough to reach p<5x10⁸. Whether these loci that appear to be associated with more than one trait are true pleiotropic loci or more a function of the known trait correlations (that is, greater adiposity is a well-known correlate of insulin resistance) remains to be elucidated. In addition, studies that leverage extended genealogy [42] to catch more of the “missing heritability” and improve polygenic risk prediction [43] combined with targeted re-sequencing and fine-mapping studies of confirmed loci like 2q36.3 and 9p21.3 may also help to untangle the joint association of T2D-CHD [44].
Furthermore, increasing the prior probability to find “true” associations would be of paramount help. To this end it might be wise to focus on studies of carefully selected, deeply phenotyped population samples with a priori stronger genetic background like early-onset diabetes [45] or cohorts free of confounding factors like long standing (sub)diabetic hyperglycaemia [46]. The availability of detailed assessments of beta-cell function and insulin sensitivity (instead of surrogate markers) as well as the accessibility of tissue- and cell-repositories within these population samples will also provide the unique opportunity to mechanistically
35
unravel the genetic signature of T2D and/or CHD.
Greater understanding of the genetic associations underlying T2D-CHD risk in the setting of a global pandemic of T2D and CHD is a timely challenge for improved population health and the sustainability of healthcare systems. The tremendous abundance of discoveries made by large-scale association studies published in 2012-2013 now needs further translation into mechanistic insights and improved clinical practice. However, this promise for discoveries achieved in the field of diabetes and cardiometabolic disease genetics is becoming ever closer.
36
2.7 FIGURES and TABLES
Table 1 - Glossary of Unfamiliar Terms
SNP: A Single Nucleotide Polymorphism (SNP) is a single base-pair change in the DNA sequence and is a class of common human genetic variations [47]. A genetic variant is usually considered as “common” if its Minor Allele Frequency (MAF) is over 5%, i.e. the less frequently inherited allele on one of the two DNA strands has a prevalence over 5% in the population of interest.
Linkage Disequilibrium: The difference between the expected and the observed frequencies of two SNPs under the assumption of independence is a common way to determine and measure the structure of haplotypes in genetic linkage analysis. This probability is called linkage disequilibrium (LD) and is expressed as a correlation coefficient ( r2 ) between pairs of SNPs, with r2 ranging between 0 and 1) The higher the
r2, the higher the probability that two SNPs are non-randomly inherited together during recombination.
GWAS: Genome-Wide Association Study. GWAS have become global scientific efforts begun over 10 years ago to analyze DNA sequence variations and to identify their possible association with common diseases by a hypothesis-free approach. For a general overview of basic principles, experimental design and overall computational strategy underlying GWAS we recommend the recent publication of Bush et al. [48].
Lead SNP: is the representative variant in a genomic region (or “locus”) most significantly associated with the disease or trait in a GWAS. As a general agreement, the lead SNP “tags” (or is a “tag-SNP”) an LD region and is named as being associated with the nearest known gene at the locus, if any. Further mapping and function studies are also required to determine if the lead SNP at a locus is actually associated with the named gene or has any molecular functional significance related to the disease or trait being studied.
Statistical significance in GWAS: Since currently available GWAS genotyping platforms allow to test millions of SNPs together against one or more traits of interest across thousands of individuals, the agreement of what has to be considered statistically significant (i.e. accepted as true association rather than happened by chance) takes into account the nominal Pearson’s statistical significance threshold (0.05) and the number of apparently independent association tests in the human genome. It is estimated that in individuals of European ancestry there are about 1 million uncorrelated (“independent”) common SNPs, hence, the resulting threshold is 5x10⁻⁸ or 0.05 divided by 1 million.
Pleiotropy: Describes a single genetic variant or multiple variants at the same locus that affect one or more phenotypic traits. If such genetic variation acts as possible underlying cause for an observed cross-phenotype association, then pleiotropy occurs [37].
37
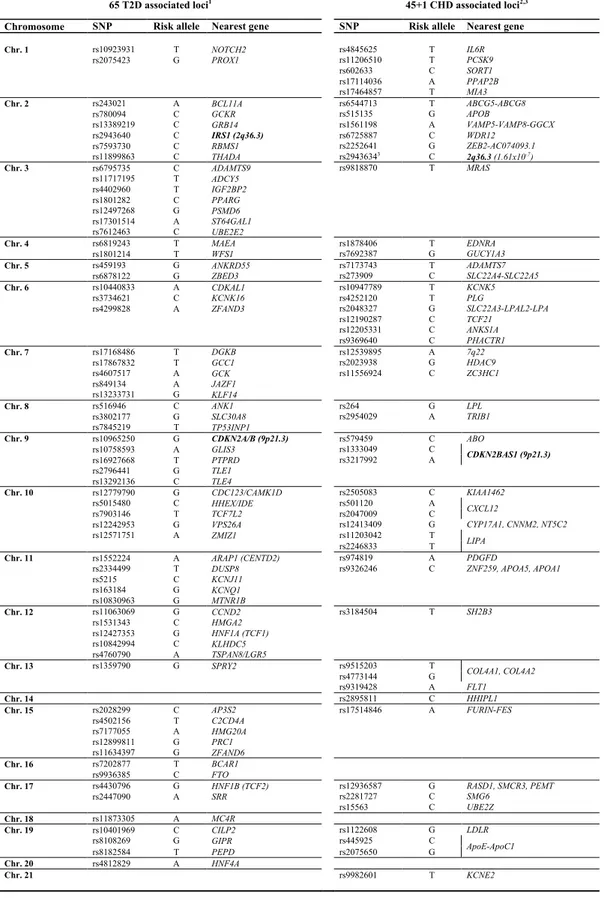
65 T2D associated loci1 45+1 CHD associated loci2,3
Chromosome SNP Risk allele Nearest gene SNP Risk allele Nearest gene
Chr. 1 rs10923931 T NOTCH2 rs4845625 T IL6R rs2075423 G PROX1 rs11206510 T PCSK9 rs602633 C SORT1 rs17114036 A PPAP2B rs17464857 T MIA3 Chr. 2 rs243021 A BCL11A rs6544713 T ABCG5-ABCG8 rs780094 C GCKR rs515135 G APOB rs13389219 C GRB14 rs1561198 A VAMP5-VAMP8-GGCX rs2943640 C IRS1 (2q36.3) rs6725887 C WDR12 rs7593730 C RBMS1 rs2252641 G ZEB2-AC074093.1 rs11899863 C THADA rs29436343 C 2q36.3 (1.61x10⁻⁷) Chr. 3 rs6795735 C ADAMTS9 rs9818870 T MRAS rs11717195 T ADCY5 rs4402960 T IGF2BP2 rs1801282 C PPARG rs12497268 G PSMD6 rs17301514 A ST64GAL1 rs7612463 C UBE2E2 Chr. 4 rs6819243 T MAEA rs1878406 T EDNRA rs1801214 T WFS1 rs7692387 G GUCY1A3 Chr. 5 rs459193 G ANKRD55 rs7173743 T ADAMTS7 rs6878122 G ZBED3 rs273909 C SLC22A4-SLC22A5 Chr. 6 rs10440833 A CDKAL1 rs10947789 T KCNK5 rs3734621 C KCNK16 rs4252120 T PLG rs4299828 A ZFAND3 rs2048327 G SLC22A3-LPAL2-LPA rs12190287 C TCF21 rs12205331 C ANKS1A rs9369640 C PHACTR1 Chr. 7 rs17168486 T DGKB rs12539895 A 7q22 rs17867832 T GCC1 rs2023938 G HDAC9 rs4607517 A GCK rs11556924 C ZC3HC1 rs849134 A JAZF1 rs13233731 G KLF14 Chr. 8 rs516946 C ANK1 rs264 G LPL rs3802177 G SLC30A8 rs2954029 A TRIB1 rs7845219 T TP53INP1 Chr. 9 rs10965250 G CDKN2A/B (9p21.3) rs579459 C ABO rs10758593 A GLIS3 rs1333049 C CDKN2BAS1 (9p21.3) rs16927668 T PTPRD rs3217992 A rs2796441 G TLE1 rs13292136 C TLE4 Chr. 10 rs12779790 G CDC123/CAMK1D rs2505083 C KIAA1462 rs5015480 C HHEX/IDE rs501120 A CXCL12 rs7903146 T TCF7L2 rs2047009 C rs12242953 G VPS26A rs12413409 G CYP17A1, CNNM2, NT5C2 rs12571751 A ZMIZ1 rs11203042 T LIPA rs2246833 T Chr. 11 rs1552224 A ARAP1 (CENTD2) rs974819 A PDGFD
rs2334499 T DUSP8 rs9326246 C ZNF259, APOA5, APOA1
rs5215 C KCNJ11 rs163184 G KCNQ1 rs10830963 G MTNR1B Chr. 12 rs11063069 G CCND2 rs3184504 T SH2B3 rs1531343 C HMGA2 rs12427353 G HNF1A (TCF1) rs10842994 C KLHDC5 rs4760790 A TSPAN8/LGR5 Chr. 13 rs1359790 G SPRY2 rs9515203 T COL4A1, COL4A2 rs4773144 G rs9319428 A FLT1 Chr. 14 rs2895811 C HHIPL1 Chr. 15 rs2028299 C AP3S2 rs17514846 A FURIN-FES rs4502156 T C2CD4A rs7177055 A HMG20A rs12899811 G PRC1 rs11634397 G ZFAND6 Chr. 16 rs7202877 T BCAR1 rs9936385 C FTO Chr. 17 rs4430796 G HNF1B (TCF2) rs12936587 G RASD1, SMCR3, PEMT rs2447090 A SRR rs2281727 C SMG6 rs15563 C UBE2Z Chr. 18 rs11873305 A MC4R Chr. 19 rs10401969 C CILP2 rs1122608 G LDLR rs8108269 G GIPR rs445925 C ApoE-ApoC1 rs8182584 T PEPD rs2075650 G Chr. 20 rs4812829 A HNF4A Chr. 21 rs9982601 T KCNE2
Table 2 - List of currently known T2D- and CHD-associated SNPs from most recent
38
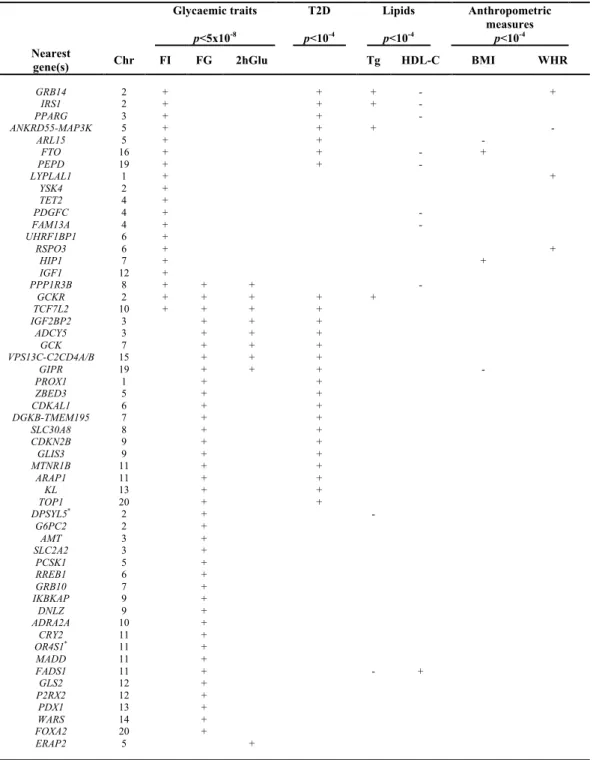
Table 3 – Associations of 55 confirmed glycaemic loci with T2D and/or cardiometabolic traits. Glycaemic traits p<5x10⁻⁸ T2D p<10-4 Lipids p<10-4 Anthropometric measures p<10-4 Nearest
gene(s) Chr FI FG 2hGlu Tg HDL-C BMI WHR
GRB14 2 + + + - + IRS1 2 + + + - PPARG 3 + + - ANKRD55-MAP3K 5 + + + - ARL15 5 + + - FTO 16 + + - + PEPD 19 + + - LYPLAL1 1 + + YSK4 2 + TET2 4 + PDGFC 4 + - FAM13A 4 + - UHRF1BP1 6 + RSPO3 6 + + HIP1 7 + + IGF1 12 + PPP1R3B 8 + + + - GCKR 2 + + + + + TCF7L2 10 + + + + IGF2BP2 3 + + + ADCY5 3 + + + GCK 7 + + + VPS13C-C2CD4A/B 15 + + + GIPR 19 + + + - PROX1 1 + + ZBED3 5 + + CDKAL1 6 + + DGKB-TMEM195 7 + + SLC30A8 8 + + CDKN2B 9 + + GLIS3 9 + + MTNR1B 11 + + ARAP1 11 + + KL 13 + + TOP1 20 + + DPSYL5* 2 + - G6PC2 2 + AMT 3 + SLC2A2 3 + PCSK1 5 + RREB1 6 + GRB10 7 + IKBKAP 9 + DNLZ 9 + ADRA2A 10 + CRY2 11 + OR4S1* 11 + MADD 11 + FADS1 11 + - + GLS2 12 + P2RX2 12 + PDX1 13 + WARS 14 + FOXA2 20 + ERAP2 5 +
Adapted from Scott RA et al. Nat. Genet. 2012 – PMID: 22885924 and from *Manning AK et al. Nat. Genet. 2012 –
PMID: 22581228. The 55 loci harboring one or more allelic variants associated with glycaemic traits are shown according to the nearest known gene(s). +/-, effect direction of the glycemic trait raising allele; T2D, type 2 diabetes; Tg, triglycerides; HDL-C, HDL-cholesterol; BMI, body mass index (Kg/m2); WHR, waist-to-hip ratio; FI, fasting
39
Figure 1. Overlapping associations among currently known T2D, CHD and glycaemic quantitative trait susceptibility loci from recent GWAS.
Loci harboring one or more common variant(s) associated with the phenotype or trait of interest are listed according to the nearest known gene. The diagram highlights the overlapping associations among A, B and C sets. Set A, coloured in yellow, comprises 65 confirmed type 2 diabetes (T2D) susceptibility loci, from 1Morris A.P. et al. (DIAGRAMv3 Consortium) Nat. Genet. 2012 (PMID: 22885922) [14]. Set B (red) shows the 45 confirmed coronary heart disease (CHD) susceptibility loci from 2Deloukas P. et al. (CARDIoGRAMplusC4D Consortium) Nat. Genet. 2013 (PMID: 23202125) [15]. Set C (blue) shows the 55 confirmed loci associated with glucose- and insulin-related traits (fasting glucose, fasting insulin, 2 hour post-challenge glucose), from 3Scott R.A. et al.
Nat. Genet. 2012 (PMID: 22885924) [12] and 4Manning A.K. et al. Nat. Genet. 2012
(PMID: 22581228) [22].
The intersection between set A and set C comprises 34 loci associated with both T2D (at p<0.05 or lower) and glycaemic quantitative traits (p<5x10⁻⁸); loci reaching genome wide significance for association with both T2D and quantitative traits are marked by an asterisk (*).
Chromosome 2q36.3- IRS1 is a starred locus also linked with detrimental levels of other cardiometabolic traits (for instance, higher triglycerides-to-HDL cholesterol ratio or low subcutaneous-to-visceral fat ratio) and harboring a variant (rs2943634) strongly associated with increased CHD risk (p=1.61x10⁻⁷, Samani NJ et al. NEJM 2007-PMID:
17634449) [11]. The chromosome, 2q36.3-IRS1 locus, lying at the convergence of A, B and C sets, is a joint T2D_CHD locus.
Chromosome 9p21.3 is a locus at the intersection of A and C sets characterized by two contiguous but distinct haplotype blocks harboring variants associated with T2D or CHD and separated by a recombination peak. A potential overlap of a T2D SNP lying in the CHD block at 9p21.3 makes this locus a promising candidate for a shared genetic risk for both T2D and CHD.
55"loc i"assoc ia te d"wi th "" gl uc ose0 "an d"insulin0 re la te d"tr ai ts 3,4 " 45 "C AD "susc ep: bility "lo ci 2 " 65"T2D "susc ep: bility "lo ci 1 "
Chr
. 9p
21.3
Ch r2 ! ABC G5& ABC G8( APO B( VA MP 5&V AMP 8&G G CX( W D R1 2( ZEB2 &A C0 74 09 3.1 ( Ch r1 ! N O TC H2 ! Ch r2 ! BC L11A( RB MS 1( THA DA ( Ch r8 ! ANK1( TP 53 IN P1 ( Ch r1 0! CD C1 23 /C AMK 1D ( HHE X/ ID E( VP S2 6A ( ZMIZ 1( Ch r1 1! DU SP 8 (( KC N J1 1( KC N Q 1( Ch r1 2! CCN D2 ( HMG A2 ( HN F1 A(( TC F1 )( KL HD C5 ( TS PA N 8/ LG R5 ( Ch r1 3! SP RY2( Ch r2 0! HN F4 A( Ch r9 " CDK N 2A ( PT PRD ( TLE1 ( TLE4 ( Ch r1 5! AP3S 2( HMG 20 A( PR C1( ZF AN D6 ( Ch r1 6! BC AR1 ( Ch r1 7! HN F1 B(( TC F2 )( SRR( Ch r1 8" MC 4R( Ch r1 9! CIL P2 ! Ch r3 ! AD AMT S9 ( PP AR G( ST 64 G AL 1( UBE 2E 2( Ch r4 ! MA EA ( WF S1( Ch r5 ! AN KRD 55 ! Ch r6 ! KC N K1 6( ZF AN D3 ( Ch r7 ! DGK B( GC C1( JA ZF 1( KL F14( 1 Mo rris !A P!et (al.( Na t.( Gene t.(2 01 2(– (P MID :(22885922! 2 CA RD Io G RA Mp lu sC 4D !Consor :um !Na t.!Gene t.(2 01 3(– !P MID :(23202125 ( 3 Sc oA !RA !et (al. !Na t.( Gene t.(2 01 2(– !P MID :!22885924! 4 Man nin g!A K!et (al.( Na t.( Gene t.(2 01 2(– (P MID :!22581228! ( Ch r2 !( GC KR * ( G RB 14 /C O BL L1 *(
Ch r3 !! IG F2 BP 2 * ( AD CY 5* ( PP AR G * ( Ch r4 " PD GF C( FA M1 3A ( PD GF C( Ch r"10 !! TC F7 L2* ( AD RA 2A ( Ch r"11 !! MT N R1 B * ( CR Y2 ( ARA P1* ( Ch r1 3" KL ( Ch r1 5" C2 CD4 A/ B&VP S1 3C( Ch r5 !! ARL 15 ( ZBED3 * ( AN KRD 55 /MA P3 K1* ( Ch r6 !! CDK AL1 * ( RRE B1 ( Ch r7 !! GC K* ( D G KB /T ME M1 95* ( Ch r8 !! SL C30A 8 * ( PP P1 R3 B( Ch r"9 !! G LIS 3 * ( CDK N 2B * ( DN LZ( Ch r"16 !! FT O * ( Ch r"19 !! G IP R * ( PE PD * ( Ch r1 !! PR O X1 * ( LY PL AL 1( Ch r3 ( AMT ( SL C2A 2( Ch r4 ! TET2 (( Ch r1 3( PD X1 ( Ch r1 4! WA RS ( Ch r2 0! FO XA 2( Ch r2 ( G6PC 2 (( YSK4( DP YSL5 !! Ch r5 ! ERA P2 (( PC SK1 (( Ch r6 ! RS PO 3 (( U HRF 1B P1 ( Ch r7 ( G RB 10 ( HIP ( Ch r9 ( IK BK AP ( Ch r1 1( MA D D ( FA D S1 ( O R4 S1 ( Ch r1 2! P2 RX2 (( GL S2( IG F1 ( Ch r1 7! RA SD 1,(S MC R3 ,(P EMT ( SMG 6( UBE 2Z ( Ch r1 9! Ap oE &Ap oC 1( LD LR( Ch r2 1! KC N E2 !! Ch r6 ! KC N K5 ( PL G( SL C22A 3&LP AL2&LP A( TC F2 1 (( ANK S1A (( PHA CT R1 ( Ch r1 ! PP AP2B( IL 6R( PC SK9( SOR T1 (( MIA 3( Ch r9 ! ABO ! CDK N 2B AS1! Ch r7 ! 7q22( HD AC 9( ZC 3HC 1( Ch r3 ! MRA S( Ch r8 ! LP L( TRIB 1( Ch r1 0! KIA A1 46 2( CX CL1 2( LIP A( CY P1 7A 1,(C N N M2 ,(N T5 C2 ( Ch r4 ! ED N RA ( GUC Y1A3( Ch r5 ! AD AMT S7 ( SL C22A 4&SL C22A 5( Ch r1 2! SH2 B3 !! Ch r1 3! CO L4 A1 ,(CO L4 A2 ( FL T1 ( Ch r1 4" HHIP L1 ( Ch r1 5! FU RIN &F ES (Chr
. 2q
36.3
(I
RS
1
*)
Ch r2 0( TO P1 ( Ch r1 1! PD GF D ( ZN F2 59 ,(A PO A5 ,(A PO A1 (A.
!
B.
!
C.
!!
41
Figure 2: Linkage Disequilibrium Patterns Among Lead SNPs at Type 2 diabetes – Coronary Heart Disease Loci on Chromosomes 2 and 9
The left-hand y-axis of each panel indicates the linkage disequilibrium (LD), represented by the r2 value, among single nucleotide polymorphisms (SNPs) at the locus, with the brightness of each point proportional to the r2 value for that SNP. The right-hand y-axis indicates the recombination rate, plotted as the blue line, with high values indicating frequent recombination at that spot on the chromosomal position, plotted as the x-axis in each panel. LD data come from sequence-based SNP genotype data from the low-coverage sequencing pilot (Pilot 1) of the 1000 Genomes Project. This data set uses phased genotypes for 179 individuals from the HapMap CEU, YRI and JPT+CHB panels. Inter-SNP distances are measured in hg18 coordinates. Data were plotted using SNAP (Johnson A.D. et al., Bioinformatics 2008-PMID:18974171 [49]).
The top panel illustrates the chromosome 2q36.3 (left hand panel) and the IRS1 (right hand panel) locus. At 2q36.3, the SNP rs2943634 is in high LD with SNPs rs2943641, rs2943650, rs2943645 and rs2972146 (associated with coronary heart disease (CHD), type 2 diabetes (T2D), fasting insulin, waist circumference and triglyceride/HDL cholesterol ratio, all r2 >0.75), but in low LD with rs10167219 (ankle brachial index,
r2=0.05). At IRS1, SNP rs1801278 (CHD, insulin resistance) is ~593kb from rs2943634 and not in LD with any 2q36.3 SNP. Note the low LD and scarcity of SNPs in and around
IRS1, indicating relatively high conservation (low variation) of base pairs around this
important gene.
The bottom panel illustrates the chromosome 9p21.3-CDKN2A/B locus, with the region of SNPs associated with CHD (left hand panel) separated from the region of SNPs associated with T2D (right hand panel) by a large recombination peak (blue line). The lead SNP for CHD (rs1333049) is only ~8.6kb from but essentially uncorrelated with the lead SNP for T2D (rs10811661, r2=0.009). However, a potential additional SNP associated with T2D, rs944801, lies in the CHD region and is modestly correlated with rs1333049 (r2=0.35), indicating a potentially joint T2D – CHD genetic region upstream from the CDKN2A/B genes.
rs944801