SCHOOL OFCIVIL, ENVIRONMENTAL AND LANDMANAGEMENTENGINEERING
MASTER OFSCIENCE INENVIRONMENTAL ANDLANDPLANNINGENGINEERING
A
SSESSING THE VALUE OF
HYDROCLIMATIC SERVICES FOR
HYDROPOWER MEGADAMS
Master Thesis by:
Saoudi Yousra Matr. 898360
Advisor:
Prof. Matteo Giuliani
Co-Advisor:
Dr. Louise Crochemore
Acknowledgments
I would first like to thank my advisor Professor Matteo Giuliani who guided me during this thesis. His enthusiasm in sharing his knowledge and ideas have stimulated my in-terest in water resource management. This thesis would not have been possible without his great support, dedication, and patience.A special gratitude goes to Dr. Louise Crochemore from the Swedish Meteorological and Hydrological Institute who kindly provided us the forecast and climate scenarios data and helped us with precious advices in developing this work.
Many thanks to the all the research group of Environmental Intelligence for global change at Politecnico di Milano for sharing their tips.
I also want to thank my dearest friends Martina, Elisabetta, Laura, Sonia, Beatrice, and Roberta who have taken part in this journey. We shared joy and happiness during this five years and your unconditional love helped me to overcome difficult moments. I am very grateful to have met you. You have made me a better person.
Deep and special thanks go to my family who has always supported me to achieve this goal. To my parents, who have made a lot of sacrifices to allow me to pursue my dreams and have taught me to be patient in life. To my sister Leila and my brother Mohamed for their constant affection and encouragements. To my little sister Nora, who always reminds me the beauty of being a child.
Abstract
Population expansion, economic development, and increased frequency and intensity of extreme climate events are challenging water system management in many regions worldwide. These trends emphasize the need of accurate medium- to long-term predictions to timely prompt anticipatory water oper-ations. State-of-the-art forecasts proved to be skillful over seasonal and longer time scales especially in regions where climate teleconnections, such as El Niño Southern Oscillation, or particular hydrological characteristics, such as snow-and/or baseflow-dominance, enable predictability over such long lead times. Recent studies have investigated the value of seasonal streamflow forecasts in informing the operations of water systems in order to improve reservoir management strategies. However, how to best inform the operations of hy-dropower systems is still an open question because hyhy-dropower reservoir op-erations can benefit from hydroclimatic services over a broad range of time scales, from short-term to seasonal and decadal time horizons, for combin-ing daily and sub-daily operational decisions with strategic planncombin-ing on the medium- to long- term. In this work, we propose a machine-learning based framework to quantify the value of hydroclimatic services as their contribution to increasing the hydropower production of the Grand Ethiopian Renaissance Dam (GERD) in Ethiopia. The GERD, with an installed capacity of more than 6,000 MW is considered the largest hydroelectric power plant in Africa and the seventh largest in the world. Its construction is part of the Ethiopian strategic hydropower development plan that aims to serve the growing domestic and foreign electricity demands. The quantification of the forecast value relies on the Information Selection Assessment framework, which is applied to a ser-vice based on bias adjusted ECMWF SEAS5 seasonal forecasts used as input to the World-Wide HYPE hydrological model. First, we evaluate the expected value of perfect information as the potential maximum improvement of a base-line operating policy relying on a basic information with respect to an ideal operating policy designed under the assumption of perfect knowledge of fu-ture conditions. Second, we select the most informative lead times of inflowInput Selection algorithm. Finally, we assess the expected value of sample in-formation as the performance improvement that could be achieved when the inflow forecast for the selected lead time is used to inform operational deci-sions. In addition, we analyze the potential value of forecast information un-der different future climate scenarios. Results show that the GERD operation informed with seasonal forecasts leads to a small improvement in the annual hydropower production in both historical and future periods. This potential gain becomes larger when we focus on the performance during the heavy rainy season from June to September (Kiremt season), and it further amplifies in the future scenario. The added production obtained with the forecast-informed operations of the GERD may represent an additional option in the current ne-gotiations about the dam impacts on the downstream countries.
Riassunto
La crescita della popolazione, lo sviluppo economico e le condizioni climatiche sempre piú avverse stanno mettono a dura prova la gestione delle risorse idriche in molti bacini idrografici nel mondo. In questo contesto, la necessitá di avere previsioni accurate di medio-lungo periodo che consentano di anticipare le de-cisioni nella gestione dei sistemi idrici é in costante crescita. I recenti sistemi previsionali sono ormai capaci di fornire previsioni accurate su orizzonti sta-gionali, specialmente in regioni dove le teleconnessioni climatiche, come El Niño Southern Oscillation, o particolari caratteristiche idrologiche, consentono la prevedibilitá su periodi di tempo lunghi. Recenti studi hanno investigato il valore delle previsioni di afflusso stagionale per la gestione dei sistemi idrici. Tuttavia, si sa ancora ben poco di come meglio informare i sistemi idroelettrici in quanto essi traggono beneficio dai servizi idroclimatici su diverse scale tem-porali, dal breve periodo fino a orizzonti di tipo stagionale e decadale. In questa tesi, viene proposto una procedura basata su tecniche di Machine Learning con l’obiettivo di quantificare il valore dei servizi idroclimatici nel contribuire ad aumentare la produzione energetica della Grand Ethiopian Renaissance Dam (GERD) situata in Etiopia. La diga ha una capacitá installata di 6,000 MW ed é considerata il piú grande impianto idroelettrico in Africa e settimo al mondo. La sua costruzione fa parte del piano di sviluppo strategico etiope che ha lo scopo di fronteggiare la crescente richiesta domestica ed estera di elettricitá. La quantificazione del valore delle previsioni si basa sull’ Information Selection Assessment framework, applicato ad un servizio che dipende dalle previsioni stagionali fornite dal sistema SEAS5 dell’European Centre for Medium-Range Weather Forecasts usate come input al modello idrologico World-Wide HYPE. Inizialmente, abbiamo valutato il massimo potenziale miglioramento di una gestione del sistema basata su poche informazioni nei confronti di una polit-ica ideale che opera sotto la perfetta conoscenza delle condizioni future. Suc-cessivamente, abbiamo selezionato l’orizzonte previsionale piú rilevante uti-lizzando un algoritmo di input variable selection. Infine, abbiamo valutato l’effettivo aumento di produzione energetica che puó essere ottenuta quandotema. Abbiamo inoltre analizzato il potenziale valore che le previsioni sta-gionali avranno in futuro considerando diversi scenari di cambiamento cli-matico. I risultati mostrano piccoli spazi di miglioramento nella produzione energetica annua sia nelle condizioni storiche che in quelle future. Tuttavia, questo potenziale guadagno incrementa valutando la performance durante la stagione delle piogge da giugno a settembre (Kiremt season), e viene ulterior-mente ampliato nel futuro. Questa produzione energetica aggiuntiva puó pre-sentare un’opzione nella attuale negoziazione sugli impatti futuri che la diga avrá principalmente su Egitto e Sudan.
Contents
Acronyms XV
1 Introduction 1
1.1 Global context . . . 1
1.2 Objective of the Thesis . . . 3
1.3 Thesis Outline . . . 4
2 State-of-the-art 5 2.1 Forecast lead time . . . 6
2.2 Types of forecast models . . . 8
2.3 Forecast uncertainty . . . 10
2.4 Forecast value and skill . . . 11
2.5 Seasonal forecast in the Upper Blue Nile Basin . . . 12
3 Study Site 15 3.1 Ethiopia . . . 15
3.1.1 A growing country . . . 15
3.1.2 Energy and hydropower . . . 18
3.2 Grand Ethiopian Renaissance Dam (GERD) . . . 20
3.3 GERD Model . . . 26
3.4 Available data . . . 28
4 Methods and tools 33 4.1 Information Selection and Assessment (ISA) framework . . . 35
4.2 Methods and Tools . . . 38
4.2.1 Deterministic Dynamic Programming (DDP) . . . 38
4.2.2 Evolutionary MultiObjective Direct Policy Search (EMODPS) 38 4.2.3 Iterative input selection algorithm (IIS) . . . 41
4.2.4 Synthetic forecast generation . . . 45
5 Results 47 5.1 Historical conditions . . . 47 5.2 Future conditions . . . 55 5.2.1 Inflow projection . . . 55 5.2.2 Forecast projection . . . 59 5.2.3 Forecast value . . . 65
5.3 Comparison: historical and future conditions . . . 68
6 Conclusions 71 Bibliography 75 A Additional material 81 A.1 EMODPS: runtime analysis . . . 81
List of Figures
2.1 Representation of both El Niño and La Niña, figure by NationalOceanic and Atmospheric Administration. . . 7
2.2 Scatterplot of forecast quality of predicted crop productivity (y axis) and farmers’ crop decisions performance (x axis) under
dif-ferent forecast products. Figure by Li et al. (2017). . . 12
3.1 Ethiopian Gross Domestic Product. Data from WorldBank (2019). 17
3.2 Ethiopian Population. Data from UnitedNations (2019). . . 17
3.3 Ethiopian electricity demand. Historical data from (WorldBank, 2019), estimate demand data from Ethiopia Growth and
Transfor-mation Plan. . . 19
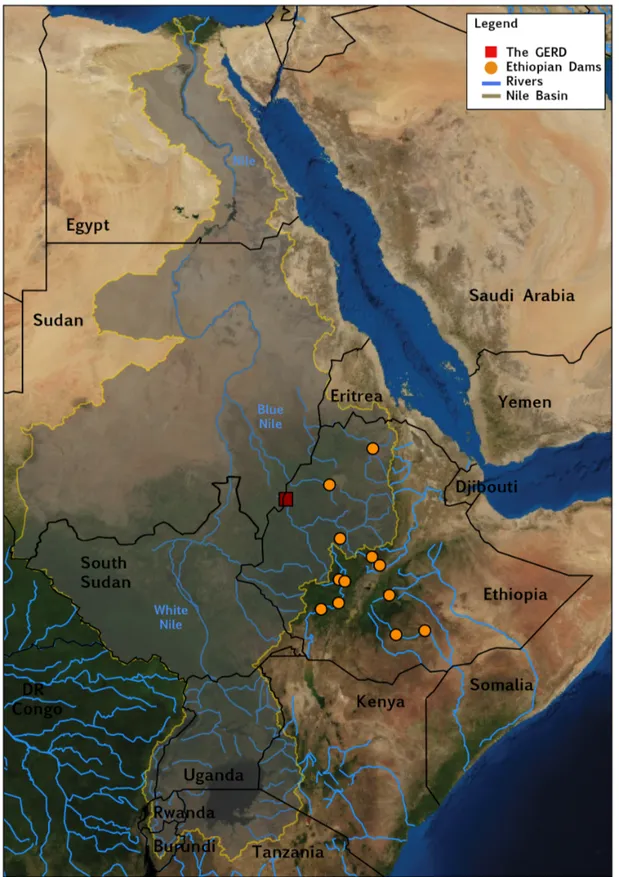
3.4 Map of the Nile River Basin and ethiopian dams. . . 21
3.5 Cross-section of the Grand Ethiopian Renaissance Dam with
as-sumed hydraulic capacities. Source: MIT (2014). . . 22
3.6 Monthly inflow: cyclostationary mean and historical data
(1965-2017). . . 29
4.1 Methodological flowchart of the thesis. . . 34
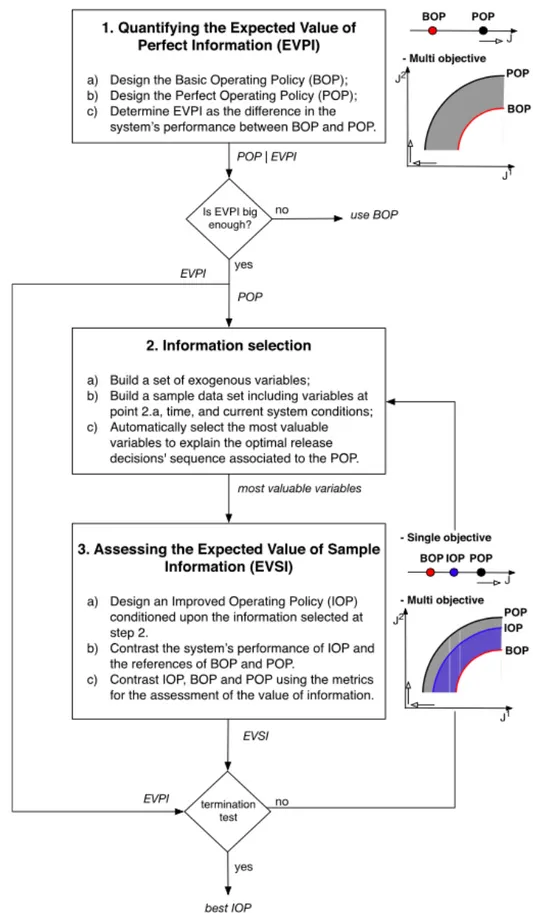
4.2 Flowchart of the Information Selection and Assessment (ISA)
frame-work. Figure from (Giuliani et al., 2015) . . . 37
4.3 Schematization of the evolutionary multiobjective direct policy search (EMODPS) approach; dashed line represents the model of the system and the gray box represents the MOEA algorithm.
Fig-ure from (Giuliani et al., 2016a) . . . 40
4.4 Flowchart of the Iterative Input Variable Selection (IIS) algorithm
(Galelli and Castelletti, 2013). . . 43
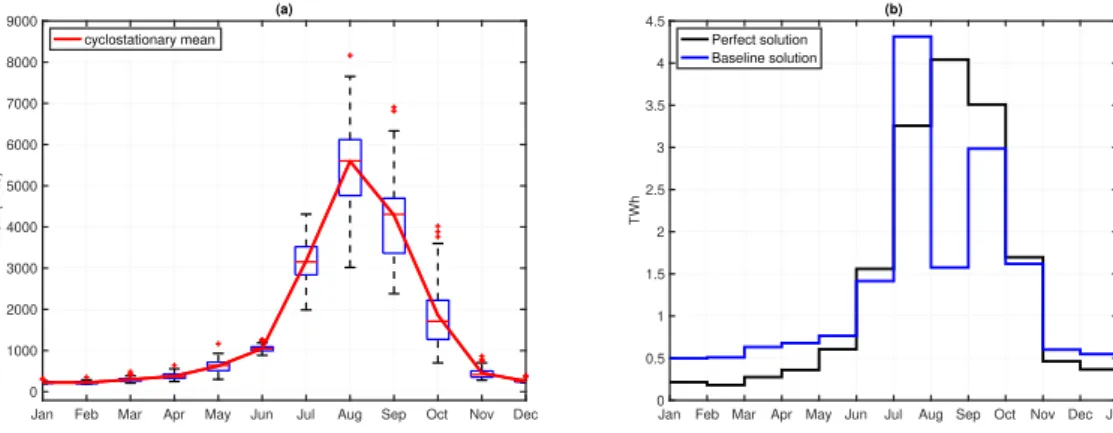
5.1 (a) Cyclostationary mean and boxplots of monthly inflow; (b) Cy-clostationary mean of the hydropower production obtained un-der the perfect (black) and baseline (blue) operating policy. Time
5.2 Information selection results obtained via 15 runs of the IIS
algo-rithm setting M= 500, K =19, nmin=20: (a) for each lead times, the
frequency of selection, the average position, and the average
rel-ative contribution in terms of coefficient of determination R2; (b)
Cumulated performance of the regression model for 12thrun. . . 49
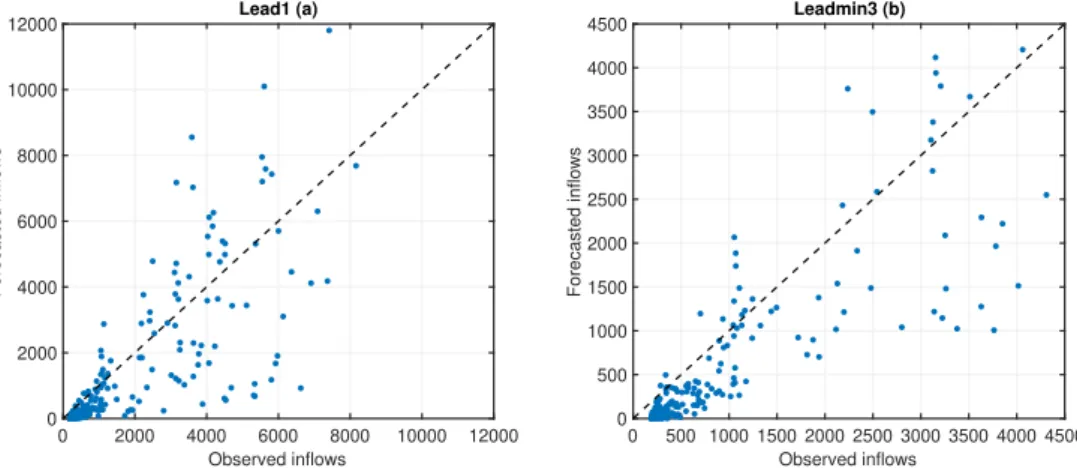
5.3 (a) Scatterplot between observed and forecasted inflow over one month; (b) scatterplot between observed and forecasted minimum
inflow over three months. . . 50
5.4 (a) Trajectory of observed and forecasted inflow over one month; (b) Trajectory of observed and forecasted minimum inflow over three months; (c) Cyclostationary mean of observed and forecasted inflow over one month; (d) Cyclostationary mean of observed and
forecasted minimum inflow over three months. . . 51
5.5 System dynamics under the perfect (black line) baseline (blue) and forecast (red) operating policies: (a) cyclostationary mean of GERD level; (b) cyclostationary mean of GERD release; (b)
cyclo-stationary mean of GERD hydropower production. . . 53
5.6 The system dynamics under the baseline (blue line), perfect (black line), and forecast (red line) operating policies for historical time period 1993-2013. (a) Gerd’s level; (b) Gerd’s release; (c) Gerd’s
hydropower production. . . 54
5.7 δ monthly mean value of expected percent change of water dis-charge for each climate scenarios: black lines represent δ values computed by different climate models, red line indicates the
me-dian value for each month. . . 56
5.8 Simulated historical inflows by each climate model compared with
the boxplots of historical observed inflows. . . 57
5.9 Cyclostationary mean of projected inflows for the RCP 4.5 (green line) and the RCP 8.5 (red line) scenarios in period 2071-2100 com-pared with the cyclostationary mean of historical inflows (blue
dashed line). . . 58
5.10 Annual projected inflows for the RCP 4.5 (green line) and the RCP 8.5 (red line) scenarios in period 2071-2100 compared with
histor-ical annual inflow (blue dashed line) 1993-2014. . . 58
5.11 Scatterplot presenting the forecasted inflow based on the observed inflow over one month Lead1 (top panel) and minimum inflow over 3 months Leadmin3 (low panel). Black triangles represent the historical data (1993-2014) and the red circles the synthetic
List of Figures
5.12 Relationship between the residual inflow and the observed inflow over one month Lead1 (top panel) and minimum inflow over 3 months Leadmin3 (low panel). Black triangles represent the his-torical data (1993-2014) and the red circles the synthetic forecast
generated for the time period (1965-2016). . . 61
5.13 Histogram with magnitude and frequencies of the residuals for both historical (1993-2014) and synthetic cases (1965-2016). Black represents the historical and red the synthetic generated inflow over one month Lead1 (top panel) and minimum inflow over three
months Leadmin3 (low panel). . . 62
5.14 Scatterplot presenting the forecasted inflow based on the observed inflow over one month Lead1 (top panel) and minimum inflow over 3 months Leadmin3 (low panel). Black triangles represent the historical data (1993-2014) and the red circles the synthetic fore-cast generated for the RCP 4.5 scenario in the time period
(2071-2092). . . 63
5.15 Scatterplot presenting the forecasted inflow based on the observed inflow over one month Lead1 (top panel) and minimum inflow over 3 months Leadmin3 (low panel). Black triangles represent the historical data (1993-2014) and the red circles the synthetic
fore-cast generated the RCP 8.5 scenario in the time period (2071-2092). 64
5.16 The system dynamics under the baseline (blue line), perfect (black line), and forecast (red line) operating policies for climate scenario RCP 4.5 in time period 2071-2091. (a) Gerd’s level; (b) Gerd’s
re-lease; (c) Gerd’s hydropower production. . . 66
5.17 The system dynamics under the baseline (blue line), perfect (black line), and forecast (red line) operating policies for climate scenario RCP 8.5 in time period 2071-2091. (a) Gerd’s level; (b) Gerd’s
re-lease; (c) Gerd’s hydropower production. . . 67
5.18 Comparison of the performance improvement between different operating policies under the historical and the future conditions
in terms of annual hydropower production. . . 69
5.19 Comparison of the performance improvement between different operating policies under the historical and the future conditions in terms of hydropower production during the wet (Kiremt) season. 69
A.1 llustration of how different metrics capture convergence, diver-sity, and consistency. (a) A good approximation to the reference set, is indicated by the dashed line. (b) Generational distance averages the distance between the approximation set and refer-ence set, requiring only one point near the referrefer-ence set to attain ideal performance. (c) The ε-indicator metric focuses on the worst case distance required to translate a point to dominate its nearest neighbor in the reference set. (d) Hypervolume rigorously cap-tures both convergence and diversity making it the most difficult
metric to satisfy (Reed et al., 2013) . . . 83
A.2 Results of the performance metrics for for the baseline policy
op-timization under historical conditions (1993-2014). . . 83
A.3 Information selection results obtained via 15 runs of the IIS
algo-rithm setting M= 500, K =19, nmin=50. . . 85
A.4 Information selection results obtained via 15 runs of the IIS
algo-rithm setting M= 500, K =19, nmin=40. . . 85
A.5 Information selection results obtained via 15 runs of the IIS
algo-rithm setting M= 500, K =19, nmin=30. . . 85
A.6 Information selection results obtained via 15 runs of the IIS
algo-rithm setting M= 500, K =19, nmin=20. . . 86
A.7 Information selection results obtained via 15 runs of the IIS
algo-rithm setting M= 500, K =19, nmin=10. . . 86
A.8 Information selection results obtained via 15 runs of the IIS
List of Tables
3.1 Operating and under construction (U.C.) dam in Ethiopia. . . 19
3.2 Grand Ethiopian Renaissance Dam’s data. . . 28
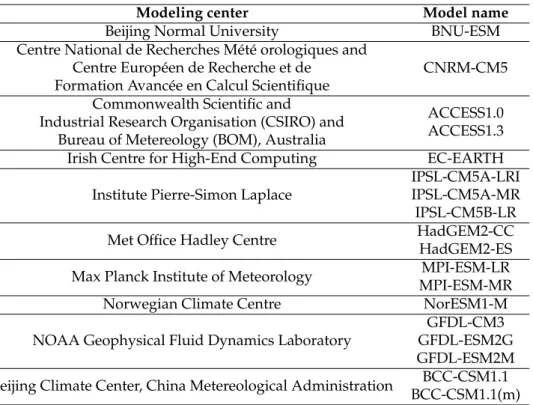
3.3 Grand Ethiopian Renaissance Dam’s elevation, storage and surface. 28 3.4 CMIP5 General Circulating Models considered reporting
model-ing center and model name. . . 31
4.1 Set of perfect seasonal inflow forecasts over different lead times. . 46
5.1 Expected value of perfect information: the performance improve-ment between the perfect and baseline solution considering an-nual hydropower production and June-September (Kiremt
sea-son) hydropower production. . . 48
5.2 The performance improvement between the Perfect and Baseline Solution and between Forecast and Baseline Solution consider-ing the annual hydropower production and the June-September
(Kiremt season) hydropower production. . . 52
5.3 Comparison of the performance improvement between different operating policies under the historical and the future conditions
in terms of annual hydropower production. . . 70
5.4 Comparison of the performance improvement between different operating policies under the historical and the future conditions in terms of hydropower production during the wet (Kiremt) season. 70
Acronyms
ANNs Artificial Neural Networks
BOP baseline operating policy
CGMs General Circulation Models
CMIP5 Coupled Model Intercomparison Project 5
DDP Deterministic Dynamic Programming
DPS Direct Policy Search
ECMWF European Centre for Medium-Range Weather Forecasts
EMODPS Evolutionary MultiObjective Direct Policy Search
ENSO El Niño-Southern Oscillation
ESP Ensamble Streamflow Prediction
EVPI Expected Value of Perfect Information
EVSI Expected Value of Sample Information
GDP Gross Domestic Product
GERD Grand Ethiopian Renaissance Dam
HydroGFD Hydro Global Forcing Dataset
IIS Iterative Input Selection
IOP informed operating policy
ISA Information Selection Assessment
IVS Input Variable Selection
KNN K-Nearest Neighbour
MISO multi-input-single output
MOEAs MultiObjective Evolutionary algorithms
NAO North Atlantic Oscillation
NWP Numerical Weather Prediction
POP perfect operating policy
RBFs Radial Basin Functions
RCP Representative Concentration Pathway
SDP Stochastic Dynamic Programming
SISO single-input-single output
SMHI Swedish Meteorological and Hydrological Institute
SSTs Sea Surface Temperatures
1
Introduction
1.1
Global context
The rapid transformations occurring worldwide are putting high pressure on the availability of freshwater resources (Rodell et al., 2018). One of the great
challenges of the 21stcentury is represented by climate change: constant rise in
average temperatures and changes in the precipitation pattern are altering the water cycle, thus leading to an increase in the intensity and frequency of ex-treme climate conditions. It is expected that water scarcity and stress cases will grow in many regions around the world. The tendency is to observe increased occurrences of more severe and less predictable flood and drought events re-sulting in negative impacts in the society such as poor health, low productivity, food insecurity, and constrained economic development (IPCC, 2014). In par-ticular, developing countries and third world countries will face the gravest risks from the changing climate since they are poorly equipped to adapt and prevent environmental threats.
On top of that, world population is expected to increase from current 7.6 billion to 8.6 billion in 2030, 9.8 billion in 2050 and 11.2 billion in 2100, with most of the population expansion concentrated in urban areas. While developed coun-tries are growing at slower rates, especially Europe, more than half of global population increase, between now and 2050, is expected to occur in Africa (United Nations, 2017). The pressure given by global population growth, urban-ization expansion, and rising economic prosperity will consequently increase food, energy, and water demands, thus further accentuating the stress on
fresh-water resources.
In this context, the importance of water-control structures, such as water reser-voirs is growing. Hydropower systems can play a significant role in decreasing vulnerabilities of water and minimizing conflicts among multiple water uses. Moreover, hydropower represents the major source of renewable energy, cor-responding to 58% of the total global renewable energy generation (IRENA, 2015b). However, managing existing water infrastructures more efficiently by adopting different technologies and methods, rather than planning new dams, represents a low-cost and flexible solution that can improve the resilience of the system against the increased variability of future extreme conditions (Castelletti et al., 2008; Giuliani et al., 2016b).
The recent advances in the skill of hydroclimatic services for the water sec-tor have created significant opportunity to adopt these tools in supporting decision-making. Climate services generate a wide range of information on past, present, and future climate and they have the potential of becoming a supportive and flourishing market providing products that can better inform decision makers at all levels, from public administrations to business operators, when taking decisions for which the implications of a changing climate are an issue (EC, 2015). Notably climate services can provide accurate medium-to long-term climate predictions that can be used in water systems medium-to timely prompt anticipatory operations, thus reducing the negative impacts given by extreme climate events.
Recent studies have investigated the value of seasonal streamflow forecasts in informing the operations of water systems to improve reservoir management strategies (e.g., Anghileri et al., 2016; Giuliani et al., 2019; Nayak et al., 2018). State-of-the-art forecasts proved to be skillful over seasonal and longer time scales especially in regions where climate teleconnections, such as El Niño-Southern Oscillation (ENSO), or particular hydrological characteristics, such as snow-and/or baseflow-dominance, enable predictability over such long lead times. However, how to best inform the operations of hydropower systems is still an open question. Hydropower reservoirs operate often for multiple purposes (e.g. domestic/agricultural water supply, environment protection, tourism, flood protection, etc.) and, for this reason, they can benefit from hydroclimatic services over a broad range of time scales. Short-term forecasts (from few hours up to 2-3 days ahead) can improve flood control, which may induce spill of wa-ter with losses of production and, consequently, of economic revenue; medium-range forecasts (up to 7-15 days ahead) can support the optimal management of the production; long-term predictions (months ahead) can help in anticipat-ing the effects of seasonal changes in water availability and implement drought
1.2. Objective of the Thesis
management plans (Ramos et al., 2019).
1.2
Objective of the Thesis
The purpose of this thesis is to evaluate the potential value of seasonal forecasts in informing the operation of hydropower megadams under historical condi-tions and future scenarios affected by climate change. The objective of the anal-ysis is to understand in which circumstances hydropower system can effectly benefit from long-term forecasts in terms of increasing hydropower production. The assessment of the forecast value relies on the Information Selection Assess-ment (ISA) framework (Giuliani et al., 2015), which consists of three steps:
1. Quantification of expected value of perfect information as the potential maximum improvement of a baseline operating policy relying on a basic information with respect to an ideal operating policy designed under the assumption of perfect knowledge of future conditions.
2. Selection of the most informative lead times of inflow forecast by employ-ing input variable selection techniques, namely the Iterative Input Selec-tion algorithm (Galelli and Castelletti, 2013).
3. Assessment of the expected value of sample information as the perfor-mance improvement that could be achieved when the inflow forecast for the selected lead time is used to inform operational decisions.
The quantification of the forecast value under historical conditions relies on seasonal streamflow forecasts generated by a hydroclimatic service based on bias adjusted ECMWF SEAS5 seasonal forecasts used as input to the World-Wide HYPE hydrological model (Arheimer et al., 2020); conversely, a synthetic forecast generation model was developed to simulates the existing forecast sys-tem under different climate change projections and estimate the future forecast value.
The proposed methodology is tested on a real case study, i.e. the Grand Ethiopian Renaissance Dam (GERD) in Ethiopia. The GERD has an installed capacity of more than 6,000 MW and is considered the largest hydroelectric power plant in Africa and the seventh largest in the world. The dam construction, started in 2011, is part of the Ethiopian strategic hydropower development plan that aims to serve the growing domestic and foreign electricity demands. More-over, the GERD reservoir is expeted to partially buffer the effects of extreme events (floods and droughts) currently occuring in the country given by the
high variability of hydro-meteorological process largely correlated to ENSO phenomenon.
1.3
Thesis Outline
The thesis is structured into the following chapters.
Chapter 2 provides an overview of the state-of-the-art about metereological and hydrological forecasting in water systems management. It explores the types of existing forecasts, discussing skill, lead time, uncertainty, and the rela-tion between forecast skill and forecast value. A focus on seasonal forecasting systems in the Upper Blue Nile Basin (Ethiopia) is also provided.
Chapter 3 reports a comprehensive description of the Grand Ethiopian Renais-sance Dam case study, analysing the socio-economic development of Ethiopia, the hydrological and climatological characteristics of the Upper Blue Nile Basin, and the benefits and concerns raised by the dam construction. Then, we pro-vide a description of the mathematical model of the system dynamics and the formulation of the objective function adopted for representing the interests of Ethiopia. Finally, the data used in the study are described.
Chapter 4 illustates the proposed methodology, which is composed of the fol-lowing three main blocks of the ISA framework: 1) Quantification of the ex-pected value of perfect information; 2) Lead time selection; 3) Assessment of the expected value of sample information. The procedure is repeated for both historical and future conditions.
Chapter 5 reports the results following the proposed 3-blocks framework for both historical and future conditions. A final comparison of the forecast value in the two periods is provided.
Chapter 6 summarizes the conclusions of this study and suggests possible di-rections for further research.
2
State-of-the-art
Most existing water reservoirs operating rules are conditioned upon a simple information set, including the day of the year and the storage, and, in few cases, also the previous day inflow (Hejazi et al., 2008). However, since these operat-ing rules are designed under a narrow range of forcoperat-ing conditions, this type of approach could lose reliability and performance when these conditions are not met.A practicable and zero-cost alternative to improve the management of most water systems is the direct use of observational data that describes the current conditions of the water system as indicated by Denaro et al. (2017). Their study, applied to a water reservoir that operates for flood control and water supply, showed that considering solely the Snow Water Equivalent (SWE) as additional information to the existing operating policy, allows for almost 10% improve-ment in the system performance. In fact, SWE informs the operating policies about the amount of water stored at high altitudes, which will be available during spring and allows to accumulate water for providing reliable irrigation over the summer.
However, relying on observational data to predict future conditions is not al-ways possible. It might happen that the equipment fails or that the basin is lo-cated in an area where the conditions are hard to be measured (Toth et al., 2000). In this context, forecast models or hydroclimatic services can provide advance information to potentially improve decision-making in water resource manage-ment and increase societal benefits, especially over the long term (Block, 2011). Along the past fifty years, there was a considerable improvement in weather
forecasting, with great advances in lead times, forecast skill and value. Fore-casts are expected to be even more helpful over the next years, when extreme weather conditions will be more frequent and intense due to climate change (Dai, 2011). Several studies have been decently published analysing the mul-tiples contributions of forecasting to the water resources operations, exploring different time horizons, different catchment types, and different operational objectives including flood control, water supply, hydropower generation, and combination among them.
2.1
Forecast lead time
Forecasts are usually divided in two categories: short-term and long-term or seasonal forecasts. The first range from one day to five days, rarely exceeding one week, while the second range from months to multiple years. Forecasts are usually skillful over short lead time and predictability tends to decrease over longer lead times (Denaro et al., 2017). However, the value of a forecast does not only depend on the time horizon but also on other factors such as reservoir capacity, the operating objectives, and the catchment type.
Short-term forecasts are more valuable when the reservoir has a capacity smaller than its annual inflow volume, and it is operated for short-term operation pur-poses such as flood protection (Saavedra Valeriano et al., 2010): a short lead time is generally sufficiently accurate to characterize the fast dynamics of the peak flow and to predict its magnitude and timing. Short-term forecasts can be based on direct observational data through the use of radars and gauges to capture the precipitation states or on more advanced models, such as numeri-cal weather prediction and ensemble prediction systems that ensures accuracy, quickness, reliability, and robustness of the forecast system (Adamowski, 2008; Cloke and Pappenberger, 2009).
Nayak et al. (2018) demonstrated the value of short-term forecasts for the opera-tions of Folsom Reservoir (California) for both flood control and water supply objectives. Results showed that water supply can be markedly improved with-out increasing the risk of floods due to the prediction of major flood events by a forecast model. However, they also found that longer-lead forecasts (30-day) do not improve performance much beyond the short-term (3-day) forecasts, even under perfect information.
On the other hand, long-term forecasts are more valuable for large reservoirs with medium to long-term operating objectives such as hydropower genera-tion and water supply (Anghileri et al., 2016). Long-term forecasts mostly rely on slow climate dynamics and, consequentially, require different weather
infor-2.1. Forecast lead time
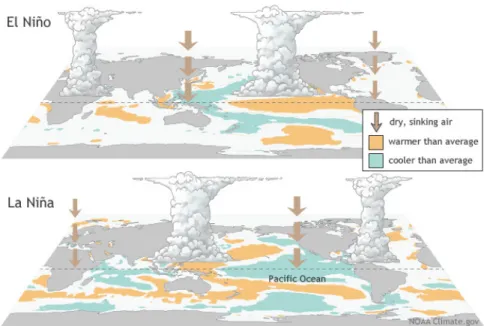
mation to be generated. Seasonal forecasts proved to be skillfull in some spe-cific areas where climate teleconnection, such as El Niño-Southern Oscillation (ENSO) may enable predictability over longer lead times. During the last few decades, there has been wide recognition that natural oscillations in areas of the Pacific Ocean have a significant impact on the patterns of weather and climate around the world (e.g., Eltahir, 1996; Zaroug et al., 2014). The most dominant among these oscillations is known as the El Niño Southern Oscillation, a cou-pled ocean-atmosphere phenomenon observed over the tropical Pacific Ocean with a 2-7 years return period. ENSO involves Sea Surface Temperatures (SSTs) oscillation along the years, with a warm-phase called El Niño and a cold-phase called La Niña (figure 2.1).
Several studies attempted to use oceanic and atmospheric variables as predic-tors in seasonal hydrologic forecasting. Forecasts based on ENSO were shown to keep the skill from 6 to 9 months of lead time for some regions along the coastline of the Pacific Ocean (Hamlet and Lettenmaier, 1999). However, while in some locations such as the United States (e.g., Hamlet and Lettenmaier, 1999), western South America (e.g., Poveda et al., 2011), or East Africa (e.g., Block and Rajagopalan, 2007), ENSO teleconnection is well defined, some regions are not substantially affected by ENSO. For example, in Europe local conditions de-pend on the concurrent state of other climate signals, particularly the North Atlantic Oscillation (NAO) (e.g., Kingston et al., 2006).
Figure 2.1: Representation of both El Niño and La Niña, figure by National Oceanic and Atmospheric
A recent study by Giuliani et al. (2019) detected the presence of potential tele-connections between multiple climate signals (e.i., ENSO and NAO), with the local precipitation in the Lake Como basin (Italy) and exploited these telecon-nections to generate skillful forecast of local meteorological variables on a sea-sonal time scale. Results showed that the use of streamflow forecasts improves the performance over the baseline solutions by 44%; this gain increases 59% when observed preseason SST is directly used in informing water system oper-ation.
Long term forecasts prove to be skillfull also in snow-dominated river basins as indicated by Anghileri et al. (2016). They developed a forecast-based adap-tive control framework for a water system characterized by large inter-annual variability in precipitation and temperature. Results showed that season-long Ensamble Streamflow Prediction (ESP) forecasts improved operations with re-spect to the baseline, remaining 35% below the perfect forecast value and that the inter-annual component of the ESP forecast contributes 20-60% of the to-tal forecast value. Moreover, they investigated which type of forecast could generated most value with respect to the baseline under the assumption of dif-ferent stress situations: for high demands with respect to the storage capac-ity or inter-annual carryover, only a perfect forecast would be able to prop-erly anticipate the streamflow; seasonal ESP forecast value is highest when the demand is medium-high and the reservoir is relatively small; inter-annual forecasts worked best for big storages while their contribution is negligible for small reservoirs.
2.2
Types of forecast models
Hydrologic forecasts are typically generated via either dynamic, process-based climate models with outputs (e.g., precipitation and temperature) fed into hy-drologic models, or via empirical, data-driven models which produce either meteorological forecasts to feed hydrologic models or directly predict future streamflows. The first approach models the physical dynamics between the principal interacting components of the hydroclimatic system (Yuan et al., 2015). A classical example is the numerical weather prediction (NWP). NWP focuses on taking current observations of weather and processing these data with com-puter models to forecast the future state of weather. However, there are lim-its to how far into the future NWP could perform, since they are sensitive to the initial conditions. Small errors in the initial conditions can lead to large errors in the forecast. Furthermore, predictability is limited by model errors due to the approximate simulation of atmospheric processes of the state-
of-2.2. Types of forecast models
the-art numerical models (Buizza, 2002). A way to overcome this problem is to conceive an ensemble of forecasts or an ensemble prediction system (EPS), in which multiple predictions of possible states are put together, providing differ-ent values of forecasting and thus giving an indication of the range of possible future climate state. The concept of ensembles can be applied also for stream-flow forecasting, called ensemble streamstream-flow prediction (ESP), where historical sequences of climate data (precipitation, potential evapotranspiration, and/or temperature) at the time of forecast are used to force hydrological models, pro-viding a plausible range of representations of the future streamflow states (Har-rigan et al., 2018).
Over the last decade, a new approach that combine the ESP with General Cir-culation Models (CGMs) into a climate model-based seasonal hydrologic fore-casting is receiving more attention. CGMs describe the global behaviour of atmosphere, ocean, and land in an integrated way and they are skillful in pre-dicting large-scale precursors, such as ENSO, over long lead times (Yuan et al., 2015). In general, physical models are accurate, since parameters of these mod-els have direct physical interpretation, and their values might be established through field or laboratory investigation and they can simulate a wide range of flow situations. However, they require more data to be constructed, and cannot integrate observed data directly to improve model results (Elsafi, 2014).
The second class of forecast models are the data-driven models, also known as black box models (Sharma, 2000). They are based on modeling the statistical relationship between input and output data, without explicitly considering the physical processes that are involved. An example of this approch is the linear regression model based on large-scale climate predictors correlated in a linear way. These forecasting models suffer from two main drawbacks. Regression coefficients are largely influenced by a small number of outliers due to limited data length and correlations between predictors and, moreover, nonlinear rela-tionships cannot be captured. An alternative proposed by Block and Rajagopalan (2007) was to use local polynomial regression model, a nonparametric meth-ods, to overcome the drawbacks of traditional linear regression. The method first identifies the K nearest neighbours (observed data points) in proximity of a specific point of interest, then it locally parametrizes the data with a poly-nomial function, and finally adds random residuals with the same standard deviation of the polynomial to generate an ensemble. This approach allows to minimize outliers’ disturbance, detection of local correlations, and elimination of multicollinearity.
Other non-linear, data-driven methods commonly used are the K-Nearest Neigh-bour Method (KNN) and Artificial Neural Networks (ANNs), where no a priori
relationship between parameters and observed values has to be hypothesised and no knowledge of the underlying process is needed. The KNN method ex-ploits the closeness between the most recent observations and K ’similar’ sets of observations chosen in an adequately large training sample (Toth et al., 2000). ANNs are computing systems inspired by the biological neural networks that are trained for recognizing relationships between a set of inputs and outputs. Many studies showed ANNs overcoming the more basic methods such as lin-ear regression (Toth et al., 2000; Elsafi, 2014). It is worth mentioning that despite data-driven hydrological methods are becoming increasingly popular in fore-casting applications due to their rapid development times, minimum informa-tion requirements, and ease of real-time implementainforma-tion, they are restricted to stationary data, which makes them potentially unreliable when projected into future conditions affected by climate change (Adamowski, 2008).
2.3
Forecast uncertainty
The last decade has seen growing research in producing probabilistic hydro-meteorological forecasts and increasing their reliability (Ramos et al., 2013). Fore-casts can better anticipate hydrologic extremes and can contribute to inform the operation of water systems in order to increase the performance of water man-agement strategies. However, they cannot provide an exact prediction of future conditions due to many sources of uncertainty, which especially increases with the increase of forecast lead time. Generally, the major source of uncertainty of a long-term forecast is the one related to the meteorological input (Cloke and Pappenberger, 2009). Observational uncertainty, related to data collection, is also relevant because of the temporal and spatial uncertainties that can alter the system. Moreover, the geometry of the system and approximations in the construction of forecast models can further reduce the forecast accurancy. However, knowing the uncertainty information can play an important role in the decision-making process as indicate by Ramos et al. (2013). Their study showed how decisions may differ when providing forecasted value with the associated uncertainty. The results suggested that the higher the uncertainty of a prediction, the more conservative and risk averse the decisions taken were. Moreover, with uncertain information, more optimal decisions were also taken, improving the overall performance of the system.
Another study by Giuliani et al. (2020) showed that the added value of a forecast might be undermined if end-users are not able to adequately interpret the un-certainty associated to the forecast ensemble. They explored increasing levels of risk aversion in the use of forecasts by informing the operating policy with
2.4. Forecast value and skill
the mean, the 25th and 10th percentiles, and the minimum of the forecast
en-semble. Their results showed that a solution that uses the ensemble minimum produces a 0.14% higher performance than using the ensemble mean, whereas
the 25thpercentile of the ensemble generates a 0.31% reduction of system
per-formance. These numerical results pointed out the importance of adopting in-tegrated frameworks that include decision models and account for end-user behavioral factors capturing different perception of risk and uncertainty.
2.4
Forecast value and skill
In the literature, the term forecast value indicates the operational value of us-ing a forecastus-ing system to support water management (Anghileri et al., 2016). The forecast value is measured in terms of system performance improvement as defined by the operating objectives (Murphy, 1993). The forecast skill is in-stead defined as the ability of a model to accurately predict the reality within given upper and lower bound (Hamlet and Lettenmaier, 1999).
Over the past 50 years, there has been a continuous improvement with the de-veloping of new technologies and models that contributed in greatly advancing forecast skills (Lynch, 2008). However, an increase in forecast skill does not nec-essarily translate into an improvement in the forecast value.
In a study on farmers decisions based on forecasts, Li et al. (2017) identified a clear non linear relationship between skill and value. Their study showed that some institutional forecast products attain both high forecast quality and high decision performance, but in many cases the decisions were still optimal even though farmers were informed by products with low forecast quality. More-over, farmers’ different perceptions of risk were shown to be a relevant variable influencing the system performance: while a risk-neutral profile presented an increase of 3% with respect to the baseline case, a risk-prone profile experienced 10% of increment.
In another study developed in the Lake Como system (Italy), a regulated lake operated for flood protection and irrigation supply, Giuliani et al. (2020) iden-tified an exponential relation between the increase in forecast skill and the re-sulting gain in system performance. Results showed a 10 to 1 relation between skill and forecast value, meaning that large gains in forecast skills are necessary to generate moderate gains in end-user profit.
Figure 2.2: Scatterplot of forecast quality of predicted crop productivity (y axis) and farmers’ crop
decisions performance (x axis) under different forecast products. Figure by Li et al. (2017).
2.5
Seasonal forecast in the Upper Blue Nile Basin
In the previous section, we saw how global climate oscillations and particu-larly ENSO may contribute to extending forecast lead times. Since the aim of this thesis is to assess the value of streamflow seasonal forecasts in informing the operation of the Grand Ethiopian Renaissance dam which is located on the Blue Nile river in Ethiopia, we briefly discuss in this section state-of-art studies applied in the Upper Blue Nile Basin (UBNB) in order to provide evidences of the potential of seasonal forecasting in this region.
ENSO is significantly correlated with rainfall variations over the eastern side of the African continent (Camberlin et al., 2001). Especially, Ethiopian seasonal precipitations are characterized by a strong intra- and interannual variability that are mainly driven by ENSO. This hydrologic variability resulting from low-frequency oscillations can produce extended periods of above- or below-normal precipitation making the country particularly vulnerable to the effects of flood and drought events. In this context, a successful seasonal forecasting system would have great economic and social value.
Interannual variability of precipitation within the UBNB has been investigated by previous researchers. Eltahir (1996) found that 25% of the natural variability
2.5. Seasonal forecast in the Upper Blue Nile Basin
in the annual flow of the Nile is associated with ENSO and proposed using this observed correlation to improve the predictability of the Nile floods. Amarasek-era et al. (1997) showed that ENSO episodes are negatively correlated with the floods of the Blue Nile. Abtew et al. (2009) found that high rainfall is likely to occur during La Niña years and low rainfall conditions during El Niño years. He also discovered that extremely dry years are highly likely to occur during El Niño years and extremely wet years are highly likely to occur during La Niña years. Seleshi and Zanke (2004) reported that the June-September rainfall in the Ethiopian Highlands is positively correlated to the Southern Oscillation Index (SOI) and negatively correlated to the equatorial eastern Pacific SST. Fi-nally, Zaroug et al. (2014) highlighted the impact of timing and sequence of El Niño and La Niña on the drought and flood conditions over the UBNB. Re-sults showed that ENSO exerts a significant influence on the June-September rainfall season and that 83% of El Niño events starting in April-June results in droughts while there is a 67% chance for occurrence of an extreme flood when an El Niño event is followed by a La Niña. They also recommended to use the main rainy season from June to September, called also the Kiremt season, in the seasonal forecasting of the Blue Nile due to its highly correllation with ENSO phenomenon.
Few studies attempted to use oceanic and atmospheric variables as predictors in seasonal hydrologic forecasting focusing on the June-September rainfall in Ethiopia. Elsanabary and Gan (2014) developed a rainfall predictive tool for
fore-casting June−September precipitations at weekly time steps in order to prevent
flood events. The framework combines a wavelet principal component analysis (WPCA) to identify regions of Sea Surface Temperatures (SSTs) that are strongly teleconnected to the seasonal rainfall, an artificial neural networks-genetic al-gorithm to forecast the rainfall season over the UBNB from the above-selected SSTs at one-season lead time, and a statistical algorithm to disaggregate the seasonal rainfall forecasts to weekly rainfall. Their results showed that the fore-casted seasonal rainfall agreed well with the observed data for the UBNB with a correlation value between 0.68 and 0.77. As an extension to their work, they used the disaggregated, weekly rainfall data to drive a basin-scale hydrologic (rainfall-runoff) to forecast the streamflow of the UBNB at up to one season lead time, which is useful for an optimal allocation of water among various competing users in the river basin.
Block and Rajagopalan (2007) developed a robust framework for generating en-semble forecasts of the Kiremt season precipitation in the UBNB. A suite of SST-related predictors that capture various aspects of the summer rainfall, in-cluding the large-scale ENSO teleconnections were first identified. Using the
best set of predictors, cross-validated ensemble predictions of the Kiremt sea-son rainfall were generated from a local polynomial regression model. The forecast ensembles demonstrated significant skills during extreme wet and dry years compared to climatological forecasts utilized by the Ethiopian National Meteorological Services Agency.
In another study, Block (2011) also demonstrated the improved economic value and reliability resulting from a seasonal climate forecast coupled with hydropower system applied to the Upper Blue Nile Basin in Ethiopia. He explored forecast value under different managerial risk preferences and he found that even risk-averse actions, if coupled with forecasts, exhibits superior benefits and reliabil-ity compared with risk-taking tendencies relying on climatology. Moreover, a hydropower sensitivity test revealed a propensity toward poor-decision mak-ing when forecasts over-predict wet conditions: if the forecast predicts a wetter than normal year and is wrong, the cost is higher than when the forecast pre-dicts a dryer than normal year and is wrong. If the reservoir operators release too much water downstream, expecting rainfall that doesn’t come, then the fol-lowing year there might not be enough water to meet production needs, while having held back too much water in expectation of a dry year that turns out to be wet has a smaller impact.
In summary, several studies explored the hydrologic variability of the Blue Nile river connected to ENSO, highlighting the potential for long-term fore-cast system in anticipating extreme events. However, just a few studies (e.g., Block, 2011) tried to assess the economic and social value of these forecasts in informing operational decisions and especially hydropower system operation. This quantification of the forecast value is however extremely important in a country like Ethiopia where hydropower represents the main source of energy and that can also contribute to the mitigation of adverse climate extremes.
3
Study Site
3.1
Ethiopia
Ethiopia, officially named the Federal Democratic Republic of Ethiopia, is a country located in the northeastern part of the Horn of Africa. As shown in fig-ure 3.5, it is bordered by Eritrea to the north and northeast, Djibouti to the east, Somalia to the east and southeast, Kenya to the south, Sudan and South Sudan to the west. With over 112 million inhabitants, Ethiopia is the most populous landlocked country in the world and the second-most populated nation on the
entire African continent after Nigeria. It occupies a total area of 1,100,000 km2,
and its capital, and also largest city, is Addis Ababa.
3.1.1 A growing country
Over the last decade, Ethiopia has made important development gains in edu-cation, health, food security, and economic growth. In 2015, the World Bank highlighted that the country had witnessed a rapid economic growth with Gross Domestic Product (GDP) increasing about 10.9% between 2004 and 2014, making the country one of the fastest growing economies in the world (fig-ure 3.1). This improvement was mostly driven by government investment in infrastructure, as well as sustained progress in the agricultural and service sec-tors. Despite all this progress, Ethiopia still remains one of the poorest countries in the world, with an estimated annual per capita income of $772 (WorldBank, 2019). According to the United Nations’ Committee for Development Policy (CDP, 2018), Ethiopia is listed among the least developed countries. Besides,
Ethiopia is also facing an increase in population which has grown from 18 mil-lions in 1950 to almost 100 milmil-lions in 2015, with a population growth rate of 2.85%, a birth rate of 36.5 births per 1,000 total population and, a death rate of 7.7 deaths per 1,000 total population (CIA, 2016). The most recent United Nations estimates predict an increase of the population from the actual 112 millions to 205 millions in 2050 and about 295 millions in 2100 (figure 3.2). Moreover, the country is home to the second largest refugee population on the continent, hosting 928,600 registered refugees from South Sudan, Somalia, Su-dan, Eritrea, and Kenya. Ethiopia is also experiencing a rapid urbanization with an increase in urban population of 8.1% from 1975 to 2000 and, from the most recent estimates, the phenomenon is destined to persist, with an urban-ization rate estimated at 4.64% between 2015 and 2020 (CIA, 2016). In addition, extreme climatic and weather conditions, such as droughts and floods, have become increasingly common and costly in the country, leading to severe im-pacts on agricultural production, livestock, water resources, and human health. In this context, Ethiopia has to provide services and guarantee a better quality of life for a constantly increasing population that continues to move from ru-ral to urbanized areas and that will be vulnerable to climate change impacts. This will require several economic investments, to ensure sufficient food, wa-ter availability, and easy access to electricity.
3.1. Ethiopia 1980 1985 1990 1995 2000 2005 2010 2015 2020 2025 Years 0 25 50 75 100 125 150 Billion US$ GDP of Ethiopia Historical GDP Projected GDP
Figure 3.1: Ethiopian Gross Domestic Product. Data from WorldBank (2019).
1950 1965 1980 1995 2010 2025 2040 2055 2070 2085 2100 Years 0 50 100 150 200 250 300 350 400 Millions of inhabitants Population of Ethiopia
Historical population Projected population
3.1.2 Energy and hydropower
Ethiopia has 14 major rivers, including the Nile, which flow from its highlands and represent the largest water reserve in Africa. Ethiopia’s hydropower capac-ity has been described as a blue gold that could contribute to economic growth of the country (Verhoeven, 2011). Ethiopia ranks second only to the Democratic Republic of Congo in economically feasible hydropower production among all the African nations (King and Block, 2014). According to CIA (2016), hydroelec-tric plants in the country represent around 86% of the total installed elechydroelec-tricity capacity, while the remaining electrical power is generated from fossil fuels (3%) and other renewable sources (11%). Several reasons are behind Ethiopia’s motivation to develop reservoir capacity and hydropower. First, the climate and hydrology of the country is extremely variable, on both interannual and intra-annual time scales, and floods and droughts are a recurring problem. A strong correlation between annual rainfall and the GDP growth rate has been demonstrated (Bank, 2006), and because the majority of Ethiopians rely on rain-fed agriculture, this variability leads to severe vulnerabilities. Therefore the de-velopment of storage may partially buffer the effects of such climate extremes (Zhang et al., 2015). Second, energy demand is expected to increase from 605 MW in 2012 to an estimated 2,540 MW in 2030 due to population, quality of life, and urbanization growth (figure 3.3). In this context, Ethiopia aims at be-coming a regional power hub by exploiting its exceptional renewable energy resource and is undertaking a larger program of dam construction on several rivers (Block and Strzepek, 2012). Currently, Ethiopia acquires the majority of its energy from 15 different hydropower plants ranging in capacity from 11.4 to 1,870 MW, totaling 4,336.6 MW. The Ethiopian Electric Power Corporation EEPCo (2013), state-owned electric power producer, is implementing additional hydropower projects, in order to increase the internal hydropower production of nearly 15 GW. Three dams are under construction (table 3.1) and the most ambitious of these projects is the Grand Ethiopian Renaissance Dam (GERD) on the Blue Nile River, that, with its 6 GW of nominal hydropower capacity, will increase the electricity generation capacity in the country of 138%.
3.1. Ethiopia 1970 1980 1990 2000 2010 2020 2030 Years 50 500 1000 1500 2000 2500 3000 Electricity demand (MW)
Energy demand of Ethiopia
Historical demand Projected demand
Figure 3.3: Ethiopian electricity demand. Historical data from (WorldBank, 2019), estimate demand
data from Ethiopia Growth and Transformation Plan.
Table 3.1: Operating and under construction (U.C.) dam in Ethiopia.
Dam 1stuse 2nduse Commissioned River Reservoir
Capacity (Km3) capacity (MW)Installed
Aba Samuel Hydropower Flood Control 1932 Akaki 0.035
-Koka Hydropower Flood Control 1969 Awash 1.9 42
Fincha Hydropower Drinking water 1973 Fincha 0.65 100
Melka Wakena Hydropower Drinking water 1989 Shebelle 0.75 153
Gibe I Hydropower Flood Control 2004 Gilgel Gibe 0.92 180
Beles Hydropower Irrigation 2010 Beles 9.12 460
Tekeze Hydropower Flood Control 2010 Tekeze 9.3 300
Gibe II Hydropower - 2010 Omo 0.92 420
Gibe III Hydropower Flood Control 2015 Omo 14.7 1870
Genale Dawa III Hydropower Flood Control 2017 Ganale 2.6 256
Genale Dawa VI Hydropower Irrigation U.C. Ganale 0.18 257
GERD Hydropower Flood Control U.C. Blue Nile river 74 6,000
3.2
Grand Ethiopian Renaissance Dam (GERD)
The GERD’s construction project started in 2011 and today is almost completed. The dam builder is the Italian company Salini Costruttori, which also served as primary contractor for the Gilgel Gibe II, Gibe III, and Tana Beles dams. The GERD, with an installed capacity of more than 6,000 MW and a catchment area
of nearly 200,000 km2(King and Block, 2014), is considered to be the largest
hy-droelectric power plant in Africa and the seventh largest in the entire world (IRENA, 2015a).
The GERD is located 700 km northeast of the capital city Addis Ababa, in the Benishangul-Gumaz region of Ethiopia, along the Blue Nile River and not far from the border with Sudan. The Ethiopian Upper Blue Nile Basin is the largest Ethiopian river basin in terms of discharge, the second largest in terms of area and it hosts the largest tributary of the Main Nile (Conway, 2000). The Blue Nile River begins at Lake Tana in the northwestern Ethiopia highlands and is joined by many tributaries before reaching the Sudanese border. Then, it con-tinues 650 km north-west until it converges with the White Nile in the city of Karthoum (Sudan), forming the Nile River. The Nile then enters Lake Nasser on the Sudanese-Egyptian border, created by the High Aswan Dam, and sub-sequently flows through Egypt to the Mediterranean Sea (figure 3.4). Although the White Nile Basin size is more than five times that of the Blue Nile Basin, the latter contributes significantly more streamflow to the main Nile River. Ac-cording to El-Fadel et al. (2003) and Conway (1997), the majority (about 80%) of the annual Nile flow to Lake Nasser originates from the Ethiopian highlands, and the Blue Nile alone, with its 1,450 km (800 of which are inside Ethiopia)
provides about 53% (50 km3) of the annual flow.
The flow of the Blue Nile varies considerably over its yearly cycle due to the large inter-annual variation in precipitation driven mainly by El Niño- South-ern Oscillation (ENSO) phenomenon (Block and Rajagopalan, 2007). Ethiopia is characterized by three main seasons (Avery and Eng, 2012):
• dry season from October to February (Bega season); • a light rainy season from March to May (Belg season);
• a heavy rainy season from June to September (Kiremt season).
During the dry season the natural discharge of the Blue Nile can be as low as
113 m3/s, while during the wet season the peak flow of the Blue Nile often
3.2. Grand Ethiopian Renaissance Dam (GERD)
Figure 3.5 shows some technical data of the GERD. The GERD reservoir is to be place in a deep gorge, producing a relatively small surface area considering its volume, and in a region with relatively cooler temperatures, allowing for a lower evaporation when compared to reservoirs further downstream, particu-larly those in desert locations (Taye et al., 2016). The main dam ground level will be at an altitude of about 500 m asl, corresponding roughly to the level of the river bed of the Blue Nile. Counting from the ground level, the main gravity dam will be 155 m high (from 500 to 655 m asl), 1,780 m long and composed of roller-compacted concrete. A curved 5.2 km long and 50 m high rock-fill saddle dam will support the main dam and reservoir. The reservoir will have
a storage capacity of 74 km3and a surface area of 1,874 km2, when at the full
supply level of 640 m asl. Hydropower generation can run between reservoir levels of 90 m, the so-called minimum operating level, and 140 m above ground level, the full supply level. The first 90 m of the height of the dam will be a dead height for the reservoir, leading to a dead storage volume of the
reser-voir of 14.8 km3. A system of three spillways safeguards the project against a
30,200 m3/s peak discharge, an event not considered to happen at all, as this
discharge volume is the so-called Probable Maximum Flood. All waters from the three spillways are designed to discharge into the Blue Nile before the river enters Sudanese territory. The first 2 spillways activates when the level reaches
140 m above ground level, while the 3rd one, located on the right abutment of
the saddle dam, activates at 142 m, when the combined discharge of the other two spillways equals the 1,000-year flood. Two powerhouses located at the toe
Figure 3.5: Cross-section of the Grand Ethiopian Renaissance Dam with assumed hydraulic capacities.
3.2. Grand Ethiopian Renaissance Dam (GERD)
of the dam will house 16 Francis turbines at 375 MW each, totaling 6,000 MW in capacity, for an expected annual generation of 15 TWh. Once completed, the reservoir will take from 5 to 15 years to fill with water and different filling and managing reservoir policies will directly impact the millions of people in downstream countries, who rely on the Blue Nile water (King and Block, 2014). Investments in large dam projects are often controversial. Supporters often de-note benefits such as flood control, water supply, and hydroelectric generation, while critics frequently highlight permanent ecosystem changes, modification of river flows, reduction of fish passage and sediment accumulation, and com-munity displacement (Taye et al., 2016). The GERD’s construction has been one of the most controversial issues in northern Africa, because of the potential neg-ative effects for Sudan and Egypt, whose populations also live in the Nile Basin and depend on its water. Due to its massive dimensions, the GERD will surely change the Nile water flow, decreasing the downstream water availability at least during its filling period, constituting a breach of the 1959 Nile Treaty. In 1959, in preparation for the construction of the High Aswan Dam, Egypt and an independent Sudan signed one of the most important agreements for the geopolitical situation of the region, the 1959 Nile Waters Agreement for full control utilization of the Nile waters. This agreement (Treaty, 1959) allocated
55.5 billion and 18.5 billion m3 of the Nile River water to Egypt and Sudan,
respectively. Moreover, annual water loss due to evaporation and other factors
were agreed to be about 10 billion m3and no consumptive allocations to other
upstream riparian countries (Ethiopia, Uganda, Kenya, Tanzania, Rwanda, Bu-rundi, Democratic Republic Congo (DRC), and Eritrea) were prescribed. The upstream Nile basin nations, including Ethiopia, contested these treaties (Wa-terbury, 2008) and, in 1999, all Nile Basin countries (Burundi, DRC, Egypt, Ethiopia, Kenya, Rwanda, Sudan, Tanzania, and Uganda) came together to form the Nile Basin Initiative (NBI, 2012) with the objective to establish a basin-wide water management institution (Conway, 2000). Since May 2010, Ethiopia and the other upper riparian states have launched the Cooperative Framework Agreement (CFA) to ensure an equitable and reasonable utilization of the Nile waters and the obligation to avoid significant harm to its riparian neighbors. However, Egypt and Sudan have opted not to sign the CFA, highlighting the tensions that existed even before the announcement of the GERD.
Here, we briefly summerize the potential benefits and concerns raised on the GERD’s construction. The GERD will be the hub for clean and renewable en-ergy supply for Ethiopia and other African countries. According to the Ethiopian government (MoFED, 2010), hydroelectricity from the GERD is expected to pri-marily satisfy national demand in order to reduce energy poverty among the almost 60% of Ethiopians who lack access to electricity, while surplus energy will be exported to East Africa countries to improve the coverage of the electric-ity. GERD’s benefits are not limited with power supply but the dam can bring advantages also to other sectors: the volume of the reservoir will be two to three times that of Lake Tana (Ethiopia), which allows to expect up to 7,000 tonnes of fish annually, representing a significant food and commercial source for the region. Moreover, the reservoir could become an hotspot for tourism (ENA, 2017) and navigation. The dam could also serve as a bridge across the Blue Nile, complementing another bridge that was under construction in 2009 further up-stream (Ethiopia, 2011). From a social point of view, the GERD will develop local industry, and it has already created up to 12,000 jobs during the construction phase (Yihdego et al., 2017). In addition, the dam’s ability to regulate hydro-logic variability will lead to a reduction in property losses due to flooding and will allow for increased agricultural production in downstream countries, es-pecially in Sudan, ensuring reliable all season supply to irrigation schemes, and reducing harvest losses caused by water shortages during dry periods. Water conservation is another major benefit given by the GERD which will minimize the evaporation losses from dams located in less favourable downstream desert locations. Since much of the Nile water is presently lost to evaporation and in-filtration as it flows north toward the Mediterranean Sea (Guariso and Whitting-ton, 1987), such losses can be significantly reduced storing water in Ethiopia. The evaporation rate in Ethiopian highlands is equal to 1,150 mm/year while in Sudan it reaches 2,500 mm/year (Block, 2011), which is similar to the one of High Aswan Dam (i.e. 2,400 mm/year) (Mulat and Moges, 2014). These dif-ferences may save 25% of the current evaporation losses conserving water in the GERD rather than the High Aswan dam (Egypt). Moreover, the GERD is expected to reduce sediment loads thus extending reservoir life in Sudan and Egypt and decreasing silt build-up in irrigation canals (Taye et al., 2016). It is estimated that Sudan could save $50 million per year in dredging costs (Tesfa, 2013) and that silt and sedimentation reduction could improve water quality and reduce treatment costs for drinking water supply (Taye et al., 2016).
However, one of the main issues in debate about the GERD construction is the time of filling the reservoir. Egypt and Sudan will be especially vulnerable to the time frame of filling the dam, which may take anywhere from 5 to 15 years.
3.2. Grand Ethiopian Renaissance Dam (GERD)
Egypt fears a temporary reduction of water availability thus impacting its hy-dropower, water supply, and irrigation systems. On the other hand, despite Sudan has recognized the benefits that the dam is likely to provide in the coun-try, there are concerns that the sediment yield reduction will decrease down-stream soil fertility, particularly affecting flood-recession agriculture with esti-mated losses in recession agricultural land on the order of tens of thousands of hectares (Taye et al., 2016). Moreover, the GERD will also bring some drawbacks even in Ethiopia itself. Exporting the electricity from the dam towards other countries would require the construction of massive transmission lines to ma-jor consumption centers such as the Sudanese capital Khartoum, located more than 400 km away from the dam. A cost of 4.8 billion US$ has already been spent for the GERD construction which corresponds to about 5% of Ethiopia’s GDP and adding power transmission lines will require more funding. More-over, the dam is displacing thousands of people in the Benishangul-Gumuz Region. An estimated 5,110 people were resettled from the downstream area in 2013 and close to 20,000 people are being relocated. The majority of the af-fected population are indigenous people of Gumuz and Berta, who live in some of the worst economic conditions with little access to development infrastruc-ture (Rivers, 2012).
Since the aim of this thesis is to asses the value of seasonal hydroclimatic ser-vices in informing the GERD operation to increase hydropower production, we neglect in the following analysis the presence of Sudan and Egypt and we assume that the GERD reservoir is already filled and operated in regime con-ditions.
3.3
GERD Model
The conceptual model of the GERD system is composed of the regulated GERD reservoir and its hydropower plant. The system dynamics is based on a mass balance equation of the water storage using a monthly timestep:
st+1=st+nt+1−rt+1 (3.1)
where stis the storage of the reservoir at time t, while nt+1is reservoir’s inflow
and rt+1is the released water volume from t to t+1. The time notation indicates
the instant when the variable is deterministically known. The reservoir storage is measured at time t, while the water volumes entering and exiting the reser-voir are evaluated in the time interval [t; t+1) and so they are known at time t+1. The released volume is a nonlinear function of storage, inflow, and the
re-lease decisions ut at each time step, which accounts for any possible deviation
of the actual release rt+1from the decision utdue to unintentional spills or any
other physical legal constraint (Soncini-Sessa et al., 2007). The effective release of the GERD is calculated as:
rt+1 =min(Rmax(st), max(Rmin(st), ut)) (3.2)
where Rmin and Rmax are the minimum and maximum monthly GERD release,
respectively, which integrate over the time step the instantaneous functions rmin
and rmax that depend on the reservoir’s level (ht), that is directly linked to the
storage (st), defined as:
rmin = 0[m3/s] ht ≤140m 22785.7[m3/s] ht ≤142m 24285.7[m3/s] ht >142m (3.3) rmax = 0[m3/s] ht ≤90m qTMax ht ≤140m 22785.7[m3/s] ht ≤142m 24285.7[m3/s] ht >142m (3.4)
where qTMax is the maximum turbine discharge, equal to 4,985.7 m3/s.
Ac-cording to equation 3.1, evaporation is neglected due to the lack of reliable