per l’Industria Chimica, Farmaceutica e Alimentare”
Ingegneria Chimica (XI Ciclo-Nuova Serie)
In silico and in vitro models
in pharmacokinetic studies
Supervisor
Ph.D. student
Prof. Giuseppe Titomanlio
Sara Cascone
Prof. Gaetano Lamberti
Scientific Referees
Prof. Werner Weitschies
Prof. Iztok Grabnar
Ph.D. Course Coordinator
Prof. Paolo Ciambelli
Le venne un'idea e, preso un sasso, lo gettò nella brocca.
Poi prese un altro sasso e lo gettò nella brocca.
Poi prese un altro sasso e lo gettò nella brocca.
Ne prese un altro e gettò anche questo nella brocca.
Piano piano vide l'acqua salire verso di sé, e dopo aver gettati altri sassi riuscì a bere e asalvare la sua vita.
"A poco a poco si arriva a tutto."
[I]
Abstract ... XV
Publication List ...XIX
Introduction... 1
1.1 Anatomy of the gastrointestinal tract _________________ 2
1.1.1 The stomach 2
1.1.2 The small intestine 5
1.1.3 The colon 7
1.2 Dissolution and absorption ________________________ 8 1.3 Pharmacokinetic modeling _______________________ 11
State of the art – in vitro and in silico models ... 15
2.1 USP apparatuses _______________________________ 16 2.2 Non USP apparatuses ___________________________ 21
2.2.1 The Sartorius absorption model 21
2.2.2 In vitro simulation of gastric digestion 22 2.2.3 A multicompartmental model simulating the stomach and small
intestine 23
2.2.4 Simulated biological dissolution and absorption system 26 2.2.5 Three staged gastrointestinal model 28 2.2.6 Use of hollow fiber to simulate the intestinal absorption 30
2.2.7 Dissolution test apparatus by Garbacz et al. 31 2.2.8 Stirring device for dissolution testing 33 2.3 Gastric motility ________________________________ 34 2.4 Pharmacokinetic models__________________________ 40
2.4.1 The first whole body physiologically based pharmacokinetic
model 40
2.4.2 The simplified model inspired by Jain et al. 42 2.4.3 Compartment Absorption and Transit model 43 2.4.4 Advanced Compartmental Absorption and Transit model 43 2.4.5 The Advanced Dissolution, Absorption and Metabolism model 44 2.4.6 Physiologically Based PharmacoKinetic model 46 2.4.7 Other physiologically based models 47
State of the art – Absorption models... 49
3.1 Absorption models ______________________________ 50 3.1.1 Absorption prediction from theory 50 3.1.2 In vitro methods for absorption predictions 52
3.1.3 Animal perfusion studies 68
3.2.4 Human perfusion studies 75
Aims ... 79
4.1 Aims of the thesis_______________________________ 80Materials and methods ... 81
5.1 Materials _____________________________________ 82 5.1.1 Active molecules 82 5.1.2 Polymers 88 5.1.3 Dissolution media 89 5.1.4 Membranes 90 5.2 Methods ______________________________________ 90 5.2.1 Tablet preparation 90 5.2.2 Dissolution methods 90
7.3 Realization of the in vitro device __________________ 134 7.4 Results and discussions _________________________ 135 7.4.1 Experimental setup and transport parameters evaluation 135
7.4.2 Conventional release pattern 138
7.4.3 Effect of the flow direction 139
7.4.4 Effect of the reciprocal flow direction 141
7.4.5 Effect of pH history 142
7.4.6 Release profile of an enteric fast release tablet 143
In vitro models: mechanical history ... 145
8.1 Design of the gastric motility_____________________ 146 8.2 Realization of the in vitro device __________________ 146 8.3 Results and discussions _________________________ 148 8.3.1 Release pattern in the artificial stomach 148 8.3.2 Effect of the frequency of the contractions 152
In silico pharmacokinetics... 155
9.1 Physiologically based pharmacokinetic model ________ 156 9.2 Influence of dissolution method ___________________ 159
9.2.1 Influence of pH history 159
9.3 Influence of inter-individual parameters _____________ 164 9.3.1 Model simulations 168 9.3.2 Model parameters 174
Conclusions ... 179
10.1 Conclusions _________________________________ 180 10.2 Future perspectives____________________________ 182References... 185
Short curriculum ... 195
[V]
Figure 6. USP apparatus 3 (reciprocating cylinder). ...18 Figure 7. USP apparatus 4 (flow – through cell)...19 Figure 8. USP apparatuses 5 and 6 (paddle over disc and rotating cylinder,
respectively)...20 Figure 9. USP apparatus 7 (reciprocating disk). ...20 Figure 10. Schematization of the sartorius Absorption Model...21 Figure 11. Sartorius dissolution model. a) plastic syringe, b) timer, c) safety
lock, d) cable connector, e) silicon tubes, f) silicon O-rings, g) metal filter, h) polyacril reaction vessel...22 Figure 12. pH decrease during in vitro gastric digestion of milk. n = number of experiments. A) 143 mM HCl, 1.5 mL/min, constant shaking; B) 143 mM HCl, 2.0 mL/min, constant shaking; C) 143 mM HCl, 2.0 mL/min, irregular stirring; D) 286 mM HCl, 3.0 mL/min, regular stirring. ...23 Figure 13. In vitro model developed by Minekus et al. a) gastric compartment; b) duodenal compartment; c) jejuna compartment; d) ileal compartment; e) basic unit; f) glass jacket; g) flexible wall; h) rotary pump; i) water bath; j) peristaltic valve pump; k) peristaltic pump; l, m) pH electrodes; n, o) syringe pumps; p) hollow fibre device. ...24 Figure 14. Simulation of the peristaltic waves in the Minekus model. 1) unit 2, 3) pressure chamber; 4) intermediate piece; 5) flexible wall; 6) space between rigid and flexible wall; 8, 9, 10, 11) connectors [20]. ...25 Figure 15. Simulated biological dissolution and absorption system by Tam and Anderson. ...27 Figure 16. First stage (the fundus) of the Wickham and Faulks model. ...29
Figure 17. Second stage (the antrum) of the Wickham and Faulks model. The movement of the piston simulates the high shear stress of the stomach bottom
part. ... 30
Figure 18. Elevation view of the Rozga and Demetriou artificial gut... 31
Figure 19. Schematic representation of dissolution stress test device developed by Gabacz et al. ... 32
Figure 20. Front view of the vessel with stirrer bar and beads when no stirring is applied. ... 33
Figure 21. The stomach geometry reconstructed by the use of MRIs [33]. ... 35
Figure 22. (a) Predicted gastric flow velocity vectors at one time instant, (b) Instantaneous streamlines, (c) Flow velocity along the z-axis shown in (a), plotted at 1 s intervals. The filled curve on the right is the maximum retropulsive flow velocity through the contractions as a function of time. The dotted line follows the propagation of the distal contraction in space–time [33]... 36
Figure 23. Effect of viscosity on the formation of the retropulsive-jet like motion and eddy structures [35]... 37
Figure 24. Streamlines of the fluid flow within the stomach’s middle plane. b) Newtonian fluid with viscosity of 1 Pa·s; c) Shear thinning fluid (k = 0.233 Pa·s, n = 0.59) [36]... 38
Figure 25. Predicted versus experimental velocity profiles along a horizontal line [35]... 40
Figure 26. Schematization of the Jain absorption model. ... 41
Figure 27. Algorithm employed for whole body PBPK model reduction... 42
Figure 28. ACAT model schematic. ... 44
Figure 29. Kinetic processes within each intestinal segmento f the ADAM model. ... 45
Figure 30. Schematic reproduction of the model proposed by Di Muria et al. ... 46
Figure 31. Physicochemical properties affecting intestinal absorption [10]. ... 50
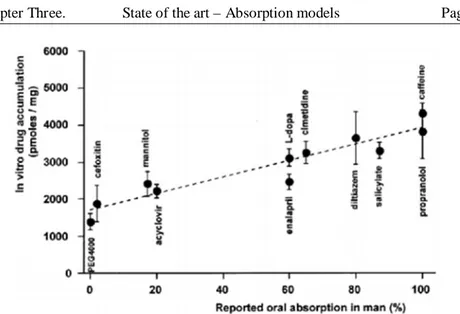
Figure 32. Correlation of oral availabilities in humans and measured uptake in vitro in everted intestinal rings [10]... 53
Figure 33. The Sweetana-Grass diffusion cell. The tissue is mounted between two acrylic half-cells. Buffer is circulated by gas lift... 54
Figure 34. Original Ussing chamber. The half cells with thermostated water jacket, gas lift, and potential diffedrence and current electoredes are shown. ... 55
Figure 35. Caco-2 cell monolayer cultured on polycarbonate filter [10]. ... 56
Figure 36. Transepithelial electrical resistance (■) and mannitol flux (○) as indices of monolayer integrity [10]. ... 57
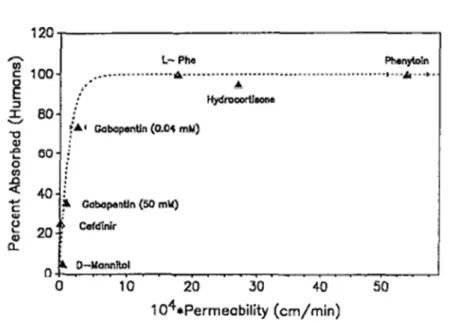
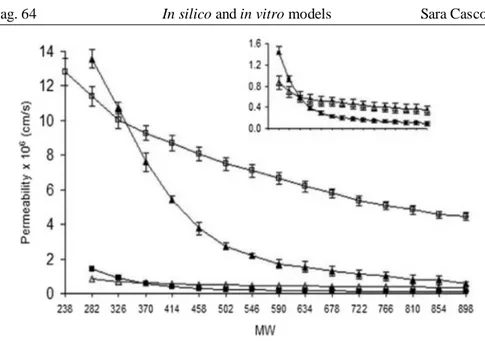
Figure 42. Permeability versus moleculare weight of PEG oligomers for different cell lines. (□) 2/4/A1 cells, (■) Caco-2 cells, (∆) MDCKII cells, (▲) human intestine [57]...64 Figure 43. Porosities constituted by large pores (grey) and small pores (black) in MDCKII, Caco-2, 2/4/A1 cell lines and human intestine [57]...65 Figure 44. Cross section of PAMPA sandwich assembly [59]. ...66 Figure 45. Absorption in humans versus PAMPA flux at pH 6.5 (a) and 7.4 (b) [58]. ...66 Figure 46. (A) GI-tract absorption of 32 drugs versus hexadecane membrane (HDM) log Pe at pH 6.8. (B) GI-tract absorption of 32 drugs versus hexadecane
membrane log Pe at pH range 4-8 [60]. ...67
Figure 47. Plot of permeability vs. dose number (Do) obtained by PAMPA and HTSA, respectively [61]. ...68 Figure 48. Schematic of the membrane transport barriers across the intestinal epithelium during a perfusion of the intestinal lumen [10]. ...69 Figure 49. Schematic of an in situ perfusion technique [52], R = reservoir, P = pump...69 Figure 50. Different perfusion flow patterns: (a) oscillating perfusion, (b)
recirculating perfusion, (c) single pass perfusion, (d) ligated intestinal loop...70 Figure 51. Correlation between oral absorption in humans and the permeability coefficients in vascularly perfused rat intestine [63]. ...71 Figure 52. Schematic illustration of the vascularly perfused rat intestinal
preparation and the perfusion apparatus. A pair of mesenteric vessels supplying an intestinal segment (or the superior mesenteric artery and portal vein) were cannulated [52]. ...72
Figure 53. Schematic diagram of intestinal vascular perfusion without
obstruction of mesenteric or portal blood flow [52]. ... 73
Figure 54. Schematic illustration of the vascularly perfused rat intestinal-liver preparation and the perfusion apparatus [52]. ... 74
Figure 55. The multichannel tube system with double balloons enabling segmental jejunal perfusion in man [64]. ... 76
Figure 56. Schematic of the Loc-I-Gut perfusion technique [64]... 77
Figure 57. The effective permeability of various drugs evaluated using CaCO-2 monolayer, rat jejunal segment in Ussing chamber, the perfused rat jejunum, and the human jejunum [10]... 78
Figure 58. Theophylline structure. ... 82
Figure 59. Diclofenac structure... 83
Figure 60. Propranolol structure. ... 84
Figure 61. Vitamin B12 structure. ... 86
Figure 62. Bovine Serum Albumin structure. ... 87
Figure 63. HPMC chemical structure. ... 88
Figure 64. Schematic of a Franz cell. ... 92
Figure 65. Schematic of the exchange system: A=Acceptor compartment, D=Donor compartment, F=Filter. ... 94
Figure 66. Example of spectra collected and subtracted. ... 96
Figure 67. Typical chromatogram of a theophylline solution in pH 6.8 phosphate buffer. The dotted curve is the baseline of the peak. ... 97
Figure 68. Relation between the concentration and the integral values for a theophylline solution in pH 6.8 phosphate buffer... 98
Figure 69. Relation between the concentration and the integral values for a diclofenac solution in pH 6.8 phosphate buffer. ... 99
Figure 70. pH history in the gastrointestinal tract. During the first two hours the pH decreases from a value of 4.8 to 1.0, then the environment was neutralized... 103
Figure 71. pH set point evolution in the gastrointestinal tract and pH reproduced with the new device. ... 104
Figure 72. Release pattern of HPMC/theophylline tablet obtained following the conventional method. The dashed vertical line represents the time of neutralization (120 min). ... 105
Figure 73. Release pattern of a commercial diclofenac tablet (EG). The dashed vertical line represents the time of neutralization (120 min). ... 106 Figure 74. Comparison between the release patterns of diclofenac in a matrix of an enteric co-polymer synthetized in our labs (triangles) and in a commercial
Figure 80. Comparison between the release patterns of diclofenac in a matrix of an enteric co-polymer synthetized in our labs obtained with the conventional dissolution method (▲) and with the pH history (∆)...112 Figure 81. Release pattern of an enteric coated, fast release commercial tablet of diclofenac following the conventional USP method (black squares) or the modified release patter (empty circles). The vertical line represent the time at which the medium is neutralized. ...113 Figure 82. Thophylline concentrations profile in the donor (cD) and in the
acceptor (cA) compartments. ...116
Figure 83. Logarithm of the concentration differences versus time for theophylline. The dotted line represent the linear fitting of the experimental
data. ...118 Figure 84. Predicted concentration profiles compared with the experimental
value. ...119 Figure 85. Logarithm of the concentration differences versus time for
diclofenac. The dotted line represent the linear fitting of the experimental data. ....120 Figure 86. Diclofenac concentrations profile in the donor (cD) and in the
acceptor (cA) compartments. The lines in figure are the model curve. ...120
Figure 87. Logarithm of the concentration differences versus time for
propranolol. The dotted line represent the linear fitting of the experimental data. ..121 Figure 88. Propranolol concentrations profile in the donor (cD) and in the
acceptor (cA) compartments. The lines in figure are the model curve. ...122
Figure 89. Logarithm of the concentration differences versus time for vitamin B12. The dotted line represent the linear fitting of the experimental data. ...123 Figure 90. Vitamin B12 concentrations profile in the donor (cD) and in the
Figure 91. Logarithm of the concentration differences versus time for BSA. The
dotted line represent the linear fitting of the experimental data. ... 124
Figure 92. BSA concentrations profile in the donor (cD) and in the acceptor (cA) compartments. The lines in figure are the model curve. ... 125
Figure 93. Comparison between in vivo and measured permeability (the upper graph) and dependence of in vitro permeability from the stokes radius of the molecules. a = -0.067; b = 0.378; R2 = 0.891. ... 126
Figure 94. The two parts of the mass exchanger in which the artificial membrane is inserted. ... 128
Figure 95. The assembled mass exchanger and the flow pattern... 129
Figure 96. Geometry of the mass exchanger implemented in Comsol... 130
Figure 97. Mesh used for the fluid dynamic simulation... 130
Figure 98. Velocity field into the mass exchanger (blood side). ... 132
Figure 99. Velocity field into the mass exchanger (intestinal side). ... 133
Figure 100. Sketch of the model: the donor, acceptor and membrane compartments are shown with their fluxes. ... 135
Figure 101. Theophylline concentration evolutions in donor and acceptor compartments varying the flow rate. Donor: full squares; Acceptor: open circles; Mass entrapped in the membrane: full triangles. The lines are the model simulations (continuous = donor, dashed = acceptor, dotted = mass in the membrane). ... 138
Figure 102. Evolutions of theophylline masses for conventional dissolution test (full stars), in the donor vessel (full squares) and in the acceptor vessel (open circles). Flow rate = 20 mL/min. ... 139
Figure 103. Release patterns of a theophylline tablet in the case in which the acceptor solution has a straight flow (closed symbols) or a lateral flow (open symbols) through the filter. The reference curve is the release pattern without the exchange system. In this graph also line guides are reported (grey = lateral direction of the fluid rich in drug content; black = straight direction of the fluid rich in drug content). On the right the two different layouts are shown. ... 140
Figure 104. Comparison between the release patterns of a diclofenac commercial tablet (DOC) using a co-current or a counter-current flow following the conventional USP method. On the right the two different layouts are shown... 141
Figure 105. Diclofenac release profile (DOC) in the donor and acceptor compartment following the conventional dissolution method and the pH evolution modified. The reference is the release profile using the conventional method without mass exchange. On the right the layout of the experimental device is shown. ... 142
Figure 106. Release patterns for enteric fast release diclofenac (co-current flow). On the right the layout of the experimental device is shown. ... 143
% release is evaluated on the basis on the drug content in the tablet. ...151 Figure 112. Release at the bottom of the artificial stomach varying the frequency of the contractions. The % release is evaluated on the basis on the drug content in the tablet. ...152 Figure 113. Complete release pattern varying the frequency of the contractions compared with the conventional release. The % release is evaluated on the basis on the drug content in the tablet. ...153 Figure 114. Schematic of the in silico model. ...156 Figure 115. Fitting of the release patterns of a diclofenac tablet obtained with the conventional dissolution method (■ experimental data; continuous curve: fitting) and with the pH history (□ experimental data; dotted line: fitting). ...160 Figure 116. Plasma profile of diclofenac after oral administration of a 50 mg dose [91]. Symbols are experimental data, line is the model prediction after
parameter optimization. ...161 Figure 117. The plasma profiles obtainable: if the real in vitro release kinetics would be the one observed using the conventional dissolution method (the continuous line), and if the real in vitro release kinetics would be the one observed using the novel apparatus (the dotted line). The horizontal dashed lines represent the minimum effective concentration (the lower one, [92]) and the minimum toxic concentration (the higher one, [93]), therefore they identify the therapeutic window. ...162 Figure 118. Comparison between the gastrointestinal concentration profile
reproduced in vitro (on the left) and simulated in silico (on the right). ...164 Figure 119. In vitro release kinetic of verapamil [95]. ...165 Figure 120. Plasma concentration of S-verapamil (left) and S-norverapamil
Figure 121. Plasma concentration of S-verapamil (left) and S-norverapamil
(right) for elderly males (EM). ... 168 Figure 122. Plasma concentration of S-verapamil (left) and S-norverapamil
(right) for young females (YF)... 169 Figure 123. Plasma concentration of S-verapamil (left) and S-norverapamil
(right) for young males (YM). ... 169 Figure 124. Plasma concentration of R-verapamil (left) and R-norverapamil
(right) for elderly females (EF). ... 170 Figure 125. Plasma concentration of R-verapamil (left) and R-norverapamil
(right) for elderly males (EM). ... 170 Figure 126. Plasma concentration of R-verapamil (left) and R-norverapamil
(right) for young females (YF)... 171 Figure 127. Plasma concentration of R-verapamil (left) and R-norverapamil
(right) for young males (YM). ... 171 Figure 128. Hepatic clearance of verapamil and norverapamil for all the groups of subjects. ... 174 Figure 129. Absorption kinetic constant in the large intestine of verapamil and norverapamil for all the groups of subjects. ... 175 Figure 130. Absorption kinetic constant in the large intestine of verapamil and norverapamil for all the groups of subjects. ... 175 Figure 131. Elimination kinetic constant in the large intestine of verapamil and norverapamil for all the groups of subjects. ... 176 Figure 132. Elimination kinetic constant in the plasma of verapamil and
norverapamil for all the groups of subjects. ... 176 Figure 133. Elimination kinetic constant in the small intestine of verapamil and norverapamil for all the groups of subjects ... 177 Figure 134. Plasma volume for R-isomer (left) and S-isomer (right). ... 177
[XIII]
Table 4. Chemical, physical and pharmacokinetic data of propranolol...85
Table 5. Chemical, physical and pharmacokinetic data of vitamin B12. ...87
Table 6. Chemical and physical data of BSA. ...88
Table 7. Characteristics of the hollow fiber filter. ...90
Table 8. Franz cell dimensions. ...92
Table 9. Active molecules and their wavelengths studied with the Franz cell...93
Table 10. HPLC method to detect theophylline. ...97
Table 11. HPLC method to detect diclofenac...98
Table 12. Theophylline concentrations versus time...117
Table 13. Diclofenac concentrations versus time...119
Table 14. Propranolol concentrations versus time. ...121
Table 15. Vitamin B12 concentrations versus time. ...122
Table 16. BSA concentrations versus time. ...124
Table 17. In vitro and in vivo permeability of several molecules. ...125
Table 18. Physical characteristic of the blood in the portal vein. ...131
Table 19. Physical and fluid dynamic characteristics of the portal vein [87], [88]. ...131
Table 20. Physical characteristics of the intestinal content. ...132
Table 21. Physical and fluid dynamic characteristics of the small intestine. ...133
Table 23. Function parameters for the equation fitting the release kinetic both for the conventional dissolution method ( rconv(t) ) and for the novel dissolution
method ( rmod(t) ). ... 160
Table 24. The model parameters used to describe the diclofenac
pharmacokinetics obtained. ... 162 Table 25. Michaelis-Menten kinetics parameters. ... 167 Table 26. Area under curve of the experimental data and of the model for
verapamil and norverapamil (S-isomer). The error is reported. ... 172 Table 27. Pharmacokinetic parameters of the experimental data and of the
model for verapamil and norverapamil (S-isomer). The error is reported. ... 172 Table 28. Area under curve of the experimental data and of the model for
verapamil and norverapamil (R-isomer). The error is reported. ... 173 Table 29. Pharmacokinetic parameters of the experimental data and of the
[XV]
coupled with a control system was used. The temperature was kept constant using the USP apparatus, a pH probe was inserted in the dissolution medium to measure the pH. The measured pH was compared (by a software) with a set point. Proportionally at the mean error, a quantity of an acidic or basic solution was inserted, by pumps, in the dissolution medium adjusting the pH at the desired value. Using the real pH history of the gastrointestinal tract, which provide a decrease in the pH value from 4.8 to about 2.0 during the first two hours of dissolution, and then an increase to 6.8, the release pattern from tablets was evaluated. The release patterns of these tablets obtained with the new device were compared with those obtained using the conventional method (which provides a pH 1 during the first two hours of dissolution, and then the neutralization at pH 6.8) and it was found that the drug released during the first two hours was higher in the case in which the real pH history was reproduced. This is due to the fact that the higher pH in the first stage damages the coating of the tablet.
Once the chemical and thermal conditions were reproduced, the reproduction of the transport across the intestinal membrane was faced. An high throughput device which is able to reproduce continuously the exchange between the compartments has been necessary. The USP apparatus was equipped with a device composed by an hollow filter (which simulate the intestinal wall) and two pumps for the fluids simulating the intestinal content and the circulatory system surrounding the gastrointestinal tract content. The fluids enter in contact in the filter and the fluid rich in drug content (that simulates
the intestinal content) gives the drug to the fluid poor in drug (simulating the blood content). The release patterns obtained by the use of this device were studied and compared with those obtained following the conventional dissolution method. Moreover these release patterns obtained using the real pH evolution were coupled with the effect of mass exchange and compared with those obtained using the conventional methods. The results showed that the effect of the real history of pH is higher in the first stage of dissolution, than the effect of the mass exchange is dominant.
The reproduction of the mechanical history of the stomach is than faced. The peristaltic waves were reproduced using a lattice bag (elastic and compressible) connected to a camshaft which, with its rotation ensured the contraction of the bag. The bag was shrunk by connectors and the right position was ensured by guides. Changing the rotation speed of the shaft, the frequency of the contractions could be adjusted. The release pattern of a commercial tablet in the new device was evaluated and compared with the conventional one. The results showed that the non-perfect mixing of the stomach was satisfactory reproduced and this lead to a release pattern completely different. Moreover, the effect of the frequency of the contractions on the release pattern was evaluated.
Second, but not secondary, aim of the thesis was to develop an in
silico model (physiologically based) which is able to simulate the
plasma concentration of drugs.
The model is composed by seven compartments, which simulate the human organ, tissue, or a group of them. The compartments are interconnected between them and seven differential equations (with their initial conditions) describe their behavior. Once the parameter are obtained (by fitting or in literature), using an in vitro release pattern, the model is able to simulate the concentrations in all the compartments, including the plasma compartment.
The plasma concentration are simulated both in the case in which the new release pattern (with the real pH history) is used as input, and the case in which the conventional one is used. The results show that in the real case the plasma concentration is very different both in value and in shape than the expected.
The model then was used to simulate the fate of several molecules simultaneously in the human body (i.e. if a racemic mixture is
[XIX]
vitro simulation of drugs intestinal absorption”, International
Journal of Pharmaceutics, 439(1-2) 165-168 (2012).
2. G. Lamberti, S. Cascone, G. Titomanlio, “An engineering approach to biomedical sciences: advanced testing methods and pharmacokinetic modeling”, Translational Medicine @ UniSa, 4 (4) 34-38 (2012).
3. S. Cascone, F. De Santis, G. Lamberti, G. Titomanlio, “The influence of dissolution conditions on the drug ADME phenomena”, European Journal of Pharmaceutics and Biopharmaceutics, 79 382-391 (2011).
4. M. Grassi, G. Lamberti, S. Cascone, G. Grassi, “Mathematical modeling of simultaneous drug release and in vivo absorption”,
International Journal of Pharmaceutics, 418 (1) 130-141 (2011).
5. S. Cascone, G. Lamberti, G. Titomanlio, “A rule of thumb in designing in-vitro systems to simulate the intestinal absorption”, submitted to Heat and Mass Transfer.
Conference proceedings concerning this activities:
1. Cascone S., Lamberti G., Titomanlio G.,"Modelli in silico ed in vitro per analisi farmacocinetiche" Proceedings of GRICU 2012 Montesilvano (PE), Italy, 16-19 settembre 2012
2. Cascone S., Dalmoro A., Lamberti G., Barba A.A. "Metodi innovativi di preparazione e testing per sistemi farmaceutici", Proceedings of GRICU 2012 Montesilvano (PE) Italy, 16-19 settembre 2012
3. Cascone, S.; De Santis, F.; Lamberti, G.; Titomanlio, G.; Barba, A.A.; "Alternatives to Laboratory Animals: In Vitro and In Silico Approaches", Proceedings of 8th CESPT, Graz, Austria, September 16th-18th 2010.
4. Cascone S.; Lamberti G.; Paolucci F.; Lamberti G.; Titomanlio G.; "In vitro and in silico approaches to reproduce pharmacokinetic relevant phenomena", Proceedings of 8th World
Meeting on Pharmaceutics, Biopharmaceutics and Pharmaceutical Technology, Istanbul, Turkey 19-22 March, 2012
[1]
gastrointestinal tract is described. The main concepts of dissolution and absorption are briefly illustrated. Moreover the pharmacokinetic modeling is depicted.
Pharmaceutical industry uses several hundred thousand of animals for in vivo pharmacokinetic studies. Furthermore, during clinical trials, a large number of humans are used to test novel drugs and formulations. However, the basic principle in all in vivo studies is that no unnecessary human or animal-based research should be done. The reduction of tests involving animals or humans can be achieved by developing of in vitro and/or of in silico models. To do this, the biology, the chemistry and the physics of the in vivo test have to be reproduced with the highest accuracy.
1.1 Anatomy of the gastrointestinal tract
The knowledge of the physicochemical features and the motility characteristic of the gastrointestinal tract is necessary to develop an in
vitro and/or an in silico model.
The motor function of the digestive system helps to achieve three main objectives: mechanical shredding and digestion of the dietary nutrients (in conjunction with the secretory function), maximal exposure of the products of digestion to the absorptive surface of the small bowel, and clearance of residues and bacteria from the gut. Thus the stomach largely liquefies the meal (digestive function) and delivers it into the intestine at the rate that matches the processing capability of the intestine (reservoir function). The motility of the small bowel spreads out chime, rapidly expanding the absorptive area, and it subjects the luminar contents to a movement which facilitates mixing and absorption. During the interdigestive periods, cyclic episodes of intense motor activity clear residues from the stomach and the small intestine.
1.1.1 The stomach
Anatomically, the stomach can be divided into three major regions:
fundus (the most proximal), corpus and antrum. The region close to
the esophagus and duodenum are called cardias and pylorus, respectively.
Figure 1. Stomach physiology.
The main function of the stomach is to process and to transport foods. After feeding, the contractile activity of the stomach helps to mix, grind, and eventually evacuate small portions of chime into the small bowel, while the rest of the chime is mixed and ground. Four major types of secretory epithelial cells cover the surface of the stomach and extend down into gastric pits and glands: mucous cells which secrete an alkaline mucus, parietal cells which secrete hydrochloric acid, chief cells which secrete pepsinogen, and G cells which secrete the hormone gastrin. The stomach absorbs very few substances, although small amounts of lipid soluble compounds can be taken up, including aspirin, other nonsteroidal anti-infiammatory drugs, and ethanol. Concerning the physiological aspect, the stomach may be divided into two regions: the proximal reservoir which consists in the fundus and the upper portion of the body, and the distal active region which includes the distal part of the body, the antrum, and the pylorus. The proximal stomach sustained contractions that are responsible for generating a basal pressure. These contractions also generate a pressure gradient from the stomach to the small intestine which is responsible for gastric emptying. In fact, a narrow zone of raised pressure has been found at the gastroduodenal junction by experiments carried out on fasted dogs [1]. Swallowing of food and consequent gastric distention inhibit contraction in this region of the stomach, allowing it to balloon out and to form a large reservoir without a significant increase in pressure, this phenomenon is called
“adaptive relaxation”. Thus, increased volume of food do not result in a rapid rise in intragastric pressure due to the ability of the fundus to relax.
The distal stomach develops strong peristaltic waves of contraction that increase in amplitude as they propagate toward the pylorus. These powerful contractions constitute a very effective gastric grinder; they occur about 3 times per minute. Liquids readily pass through the pylorus in spurts and the rate of emptying of liquids depends on the gradient between the stomach and the duodenum. Conversely, the solids must be reduced to a diameter of less than 1-2 mm before passing the pyloric gatekeeper. Larger solids are propelled by peristalsis toward the pylorus, but then they are refluxed backwards when they fail to pass through the pylorus, this continues until they are reduced in size sufficiently to flow through the pylorus. Thus, the main role of the distal stomach is not to affect emptying of digestible solid, but to provide continence for, and trituration of, these solids. The time required for trituration would be avoided if solids were homogenized before ingestion [2]. The distal stomach has a minor role in gastric emptying of liquids.
When the stomach is filled, peristaltic waves are decrease. The presence of fat in a meal can completely stop these movements for a short period until it is diluted with gastric juice or removed from the stomach. Peristaltic waves start as weak contractions at the beginning of the stomach and progressively become stronger as they near the distal stomach regions. The waves help to mix the stomach contents and propel food to the small intestine.
In spite of the large amount of studies about the stomach movements and physiology, a study of the literature revealed such a diversity of opinions on the subject that further investigations appeared advisable. A detailed description of the peristaltic movements and their implications could be found in MCrea et al. [3].
The rate of stomach emptying is influenced by the pH, by the osmolarity, by the hormones, and by the volume of ingested foods. When an indigestible solid is ingested with a digestible solid, the emptying of the indigestible solid is delayed because feeding decreases the movements [2].
The emptying of solid foods may depend more on physical characteristic such as specific gravity and viscosity. A review about
Figure 2. Gastrointestinal tract physiology.
The small intestine is made up of duodenum, jejunum, and ileum. In human beings, duodenum measures approximately 20 cm, while jejunum and ileum are approximately 2.5 and 3 m long respectively. The small intestine is strategically located at the interface between the systemic circulation and the environment, and it plays a major role as a selective permeability barrier. It permits the absorption of nutrients such as sugar, amino acids, peptides, lipids, and vitamins and it limits the absorption of xenobiotics, digestive enzymes, and bacteria. It is approximately 2.5-3 cm in diameter. Digested foods are able to pass into the blood vessels across the intestinal walls by diffusion. The small intestine is the site where most of the nutrients from ingested food are absorbed. The inner wall, or mucosa, of the small intestine is lined with simple columnar epithelial tissue. Structurally, the mucosa is covered in wrinkles or folds called plicae circulares, which are considered permanent features in the wall of the organ. From the
project. The individual epithelial cells also have finger-like projections known as microvilli. The function of the plicae circulares, the villi and the microvilli is to increase the surface area available for the absorption of nutrients.
Each villus has a network of capillaries and fine lymphatic vessels called lacteals close to its surface. The epithelial cells of the villi transport nutrients from the lumen of the intestine into these capillaries (amino acids and carbohydrates) and lacteals (lipids). The absorbed substances are transported via the blood vessels to different organs of the body where they are used to build complex substances such as the proteins required by the body. The food that remains undigested and unabsorbed passes into the large intestine.
Most drugs are weak organic acids or bases, existing in un-ionized and ionized forms in an aqueous environment. The un-ionized form is usually lipid soluble (lipophilic) and diffuses readily across cell membranes. The ionized form has low lipid solubility (but high water solubility – e.g., hydrophilic) and thus cannot penetrate cell membranes easily. The proportion of the un-ionized form present (and thus the drug's ability to cross a membrane) is determined by the pH and the drug's pKa (acid dissociation constant). The pKa is the pH at which concentrations of ionized and un-ionized forms are equal. When the pH is lower than the pKa, the un-ionized form of a weak acid predominates, but the ionized form of a weak base predominates. Thus, in plasma (pH 7.4), the ratio of un-ionized to ionized forms for a weak acid (e.g., with a pKa of 4.4) is 1:1000; in gastric fluid (pH 1.4), the ratio is reversed (1000:1). Therefore, when a weak acid is given orally, most of the drug in the stomach is un-ionized, favoring diffusion through the gastric mucosa. For a weak base with a pKa of 4.4, the outcome is reversed; most of the drug in the stomach is ionized. Theoretically, weakly acidic drugs (e.g., aspirin) are more readily absorbed from an acid medium (stomach) than are weakly basic drugs (e.g., quinidine). However, whether a drug is acidic or basic, most absorption occurs in the small intestine because the surface area is larger and membranes are more permeable.
The knowledge about the normal transit of chime along the small bowel and its regulation is still lacking. The reasons for the relative ignorance are the variability of the chime input into the small bowel is variable and its dependence from the gastric emptying. Some parts of the meal pass through the colon faster than others. Therefore,
this marker are characterized by a complex sequence of phases of rest, slow movements, and rapid movements. Behavior of drugs and delivery systems in the intestine depends on many physiological factors including fluid volume, fluid composition, transit, motility,
bacteria, and pH, which are further influenced by food, gender, and
age.
1.1.3 The colon
The colon is the part of the intestine from the cecum to the rectum, it is also called large intestine or large bowel. It consists of cecum, ascending colon, transverse colon, descending colon, sigmoid colon, and rectum. The colon in humans measures approximately 1.5 m in length, its diameter varies between 6 cm (in the cecum) and 2.5 cm (in the sigmoid colon). The colon is constituted of four layers which, from the inner to the outer, are represented by the mucosa, the
submucosa, the muscularis, and the adventitia. There are many
similarities in the histological structure of the mucosa in the colon and in the small intestine. The most important difference is that the
mucosa of the large intestine is devoid of villi. The large intestine is
mainly responsible for storing waste, reclaiming water, maintaining the water balance, and absorbing some vitamins. By the time the chime has reached this part of intestine, almost all nutrients and 90% of the water have been absorbed by the body. As the chime moves through the large intestine, most of the remaining water is removed, while the chime is mixed with mucus and bacteria and becomes feces. The large intestine produces no digestive enzymes because chemical digestion is completed in the small intestine. The pH in the colon
varies between 5.5 and 7. Like the small intestine, movements through the colon is not continuous, and in the transverse colon, the dosage forms were observed to be often at rest; spending 5 – 30 min periods with no or minimal propagation [7]. A mass movement was observed starting 6 h post ingestion, which transported the capsule from the distal ascending colon, to the descending colon in one movement within less than 1 minute.
Diakidou et al. [8] analyzed and characterized the contents of ascending colon to which drugs are exposed after oral administration in healthy adults under fasting and fed state. They found that free water content, pH, surface tension, and isobutyrate levels were lower in the fed than in fasted subjects. On the other hand, buffer capacity, osmolarity, acetate, and butyrate were higher in fed subjects. Carbohydrate content, protein content, and the levels of long chain fatty acid and of cholesterol are not significantly affected by the fed state. In conclusion, they found that composition of fluids in the ascending colon is affected by feeding. This may influence the performances of a dosage form designed to release in the colon.
With the aim to simulate the composition of biorelevant media as closely as possible to the composition and to the physicochemical characteristics of the gastrointestinal fluid, a set of four dissolution media was presented [9]. These media was found to be able to simulate the condition of the fasted stomach, of the postprandial stomach, and of the upper small intestine both in the fasted and in the fed condition.
1.2 Dissolution and absorption
The oral route is the most important drug administration route. Oral bioavailability is a fundamental requisite for any orally administrated drug to be effective. Systemic bioavailability is influenced by a variety of factors, which are summarized in Table 1.
Pharmacokinetic factors
GI and liver metabolism Chemical instability Absorption
Distribution and elimination
Physiochemical properties
Lipophilicity Solubility
Degree of ionization Molecular size and shape Hydrogen-bonding potential
The key phenomena involved in the administration of a solid dosage forms are the dissolution and the absorption of the drug. Dissolution is defined as the process by which a solid substance enters in the solvent to yield a solution. To determine the dissolution rate of the drugs from solid dosage forms, several physicochemical processes in addition to the dissolution of pure chemical substances have to be considerate. The first step consists of the contact between the solvent and the solid surface (wetting), which leads to the production of a solid – liquid interface. The breakdown of the molecular bonds of the solid (fusion) and passage of molecules of the solid – liquid interface (solvation) are the second and third steps, respectively. The final step implies the transfer of the solvated molecules from the interfacial region into the bulk solution (diffusion) [11]. The physical characteristics of the dosage form, the wettability of the dosage unit, the penetration ability
of the dissolution medium, the swelling process, the disintegration and deaggregation of the dosage form are some of the factors that influence the dissolution features of the drug.
The dissolution and the absorption of the drug are the main phenomena involved in the administration of a solid dosage form. Indeed, the Biopharmaceutical Classification System (BCS) identifies the solubility and the permeability as the key parameters to describe the drug fate once ingested. According to BCS, drug substances are classified as: Class 1 drugs (high solubility and high permeability), class 2 drugs (low solubility and high permeability), class 3 drugs (high solubility and low permeability), and class 4 drugs (low solubility and low permeability) [12], as shown in Figure 3.
Figure 3. BCS substances classification in term of solubility and permeability.
According to these criteria, drugs are considered highly soluble when the highest dose strength of the drug substance is soluble in less than 250 mL of water over a pH range of 1-6.8; drugs are considered highly permeable when the extent of absorption in humans is determined to be greater than 90% of the administered dose.
When a solid dosage form arrives in the gastrointestinal tract, there are two possibilities of rate – limiting step. The solid form must first dissolve and then the drug in solution must pass through the gastrointestinal membrane. Freely water soluble – drugs dissolve rapidly, making the passive diffusion of the drug or its active transport
formulation and manufacturing process parameters, whereas the dissolution from drug particles mainly reflects the effects of solubility and particle size, which are properties of the pharmaceutical raw material, but the dissolution can also be influenced significantly by processing and formulation. Therefore, dissolution testing provides the means to evaluate the critical parameters such as adequate bioavailability and it provides information necessary to the formulator in development of more effective dosage forms.
Hence, dissolution analysis of pharmaceutical dosage forms has emerged as the most important test that will ensure the quality and the bioavailability of a product. The knowledge of critical operating variables for a dissolution testing device is important for product development, quality control, and research application.
The development and the use of in vitro dissolution tests to evaluate and to describe in vivo dissolution and absorption is useful to screen potential drugs and their formulations for their dissolution and absorption characteristic and to improve the quality control procedures.
1.3 Pharmacokinetic modeling
The prediction of the drug concentration in the blood, tissue, and organs is the goal of the in silico pharmacokinetic modeling. The approaches to the modeling of the physiological phenomena can be different on the basis of the details used. The description of the phenomena taking place in the body is much closer to the real physiology if more details are considered.
The processes which a drug follows after the administration are absorption, distribution, metabolism, and excretion (ADME); these processes determine the evolution of the drug concentration in the body. The route of administration, the physical and chemical properties of the substance, the characteristics of the dosage form, and the physiological conditions are the factor with the most important effect on the entity and the rate of the ADME phenomena. The age, the gender, and the weight of the subject influence the ADME phenomena.
The absorption of a drug is rapid and complete in the case of intravenous injections, while it is generally delayed and incomplete in the case of oral administration. The absorption is characterized by the mechanisms of passive diffusion, facilitated diffusion, and active transport. The fraction of the drug which overcomes the biological barriers by passive diffusion enhances with the increase of the solubility of the drug in the gastrointestinal fluid, with the increase of the affinity of the substance for the phospholipids which constitute the living membrane, with the decrease of the drug molecular weight, and with the increase of the residence time in the gastrointestinal tract. The rate of the absorption phenomenon increases with the increase of the diffusion coefficient of the drug and with the decrease of the dimensions of particles which constitute the pharmaceutical formulation. The facilitated diffusion and the active transport are more complex absorption mechanism in which a carrier is involved.
The distribution of a drug is faster if the rate of absorption increases: the time of appearance of the drug in tissues and organs is lesser in intravenous injections than in oral assumptions. The mechanisms by which the drug is distributed in the organs and in the tissues are the same which characterize the passage through the gastrointestinal
mucosa. Therefore, in the passive diffusion, a higher affinity for the
constituent of the biological membranes causes an increase in the rate of the phenomenon. The amount of the drug which can be contained in a tissue or an organ increases as the real volume of the tissue or organ increases and as the fraction of the species bound to the plasma proteins decreases. The higher is the blood perfusion in the tissue or organ, the faster is the drug reaching and leaving it.
The metabolism of the drug is strongly dependent on the route of administration: if the substance is taken by intravenous injection, it is introduced in the systemic circulation and directly distributed to the
The liver metabolizes the species by secretion, the kidneys by filtration (passive transport) and by secretion (active transport). The more hydrophilic are the substances administered, the higher is the percentage of the dose excreted. The rate of elimination increases with the increase of the unbounded to plasma and tissue proteins.
All these transport phenomena described must be taken into account in the development of an in silico model.
Three different approaches can be followed to build an in silico model to predict the fate of administered drug:
1. The pure compartment modeling. The compartment
approach is based on the schematization of the body by a system of interconnected volumes, the compartments, which can be easily identified as chemical reactors or as a physical contacting units. In the pure compartmental models, the compartments do not represent necessary anatomical units. 2. The physiologically based pharmacokinetic modeling
(PBPK). In the physiologically based models, the compartments are representative of a tissue, an organ or a group of organs, each with a specific function, and the interconnection between the compartments reproduces the effective one between tissue and organs.
3. The purely mathematical modeling. The pure mathematical models are able to correlate the results of an in vitro dissolution tests to the in vivo drug concentration in the blood. Such correlations are the IVIVC (in vitro/in vivo correlations).
The IVIVC are classified in four levels: level A, level B, level C, and multiple level C correlations [14]:
1. A level A correlation is a point to point relationship between the in vitro dissolution profile and the in vivo plasma evolution of a drug.
2. A level B correlation is a relationship between the mean in
vitro dissolution time and the mean in vivo residence time,
obtained by considering the full profile of in vitro dissolution and the full in vivo plasma evolution.
3. A level C correlation is a single point relationship between a dissolution parameter (e.g. the percent dissolved after 4 h) and a PK parameter (e.g. the maximum of plasma concentration). 4. A multiple level C correlation is a relationship between several
points of the dissolution profiles with several PK parameters. Regulatory boards (FDA, USP) accept only Level A IVIVC for Scale-Up and Post-Approval Changes (SUPAC) which can be justified without the need for additional human studies. A PK model able to correlate the in vitro dissolution profile and the in vivo plasma evolution, will play the same role of a Level A IVIVC, but it is of great interest since it is more physically based.
[15]
In this chapter the analysis of the in vitro models found in literature, both USP and not USP approved, is faced. Moreover, several models used to simulate the gastric motility are described. Furthermore, the analysis of the in silico pharmacokinetic models found in literature is faced.
2.1 USP apparatuses
It has long been recognized that solid drug orally administrated are not immediately available to the biological system since they are absorbed only from a solution. During the development of the dosage form, the
in vitro tests serve as a guide in estimating the amount of drug
released per unit time in a given dissolution medium. In vitro dissolution tests seems to be the most sensitive and reliable predictors of in vivo performances and they offer a meaningful indication of physiological availability.
Many devices have been reported for determination of the dissolution rate, some of them accepted and classified by the Pharmacopeia(s). The procedures differ in degree rather than in basic principles. The apparatuses used for dissolution testing are the USP (United States Pharmacopeia) apparatuses 1, 2, 3, 4, 5, 6, and 7 [15].
The USP Apparatus 1 (basket apparatus) consists of a wire-mesh basket that is attached to a rotation shaft, which is then immersed into a dissolution vessel for the duration of the dissolution test. Since the dosage form is in direct contact with the basket, the physical dimensions and the motion of the basket can have a strong impact on the dissolution rate of the solid dosage unit. The basket height, the diameter of the basket opening, height of the open screen, and size of the mesh are specified in USP chapter <711>.
Figure 4. USP apparatus 1 (basket apparatus).
The advantages of this apparatus are the breadth of experience in its use, the possibility to obtain easily pH changes during a test, and the ease of automation, which is important for routine investigations. On the other hand, the dosage form is subjected to
Figure 5. USP apparatus 2 (paddle method).
Instead of the simplicity of use, its high degree of standardization, and its robustness, this apparatus is characterized by ease to realize pH changes and the fluid dynamic is very complex and can vary with site of dosage form in the vessel and therefore may significantly affect drug dissolution.
The USP apparatus 3, the reciprocating cylinder, was based on the recognition of the need to establish in vitro - in vivo correlation (IVIVC), since the dissolution results obtained with USP apparatuses 1 and 2 may be affected by mechanical factors, such as shaft wobble, location, centering, deformation of the basket and paddles, and presence of bubbles in the dissolution medium. The design of this
apparatus provides capability agitation and media composition changes during a run as well as full automation of the procedure.
Figure 6. USP apparatus 3 (reciprocating cylinder).
Furthermore, the reciprocating cylinder allows to obtain a good correlation for extended-release formulations because of the ease of sampling, and because of the ease of pH changing during the test run which offers the advantage of mimicking the changes in physiochemical conditions. The deformation rates are higher than those of the apparatuses 2 but the apparatus 3 is less diffused and used.
The USP apparatus 4, also known as the flow – through cell, is composed by a small volume cell containing the sample solution which is subjected to a continuous stream of dissolution medium. The dissolution medium flows through the cell from bottom to top. The pulsating movement of the piston pump supplies the need of further stirring or shacking elements. A filtration device at the top of the cell retains all the undissolved material. The flow-through cell system usually operated as an open loop, therefore new dissolution medium is continuously introduced into the system. In this way, all the drug dissolved is immediately removed along the flow of the dissolution medium. This apparatus is reliable not only for the determination of the dissolution rate of tablets but also of capsules, semisolids, powders, and granules.
solvent volume, minimizing downtime between two tests, ability to adapt test parameters to physiological conditions, and retention of undissolved particles (without of additional step of filtration or centrifugation). Instead of the fact that the apparatus is very versatile, the realized fluid dynamic is very far to the real one, it requires high volume of dissolution media, and deareation is necessary.
Transdermal or patching testing is carried out using USP method 5 (paddle over disc) or USP method 6 (rotating cylinder). With paddle over disc, the transdermal patch is placed between a glass disc and an inert mesh. This is placed at the bottom of the vessel, with the meshing faced upwards, under a rotating paddle. Unlike dissolution testing, transdermal testing is carried out at 32°C to reflect the lower temperature of the skin. Other variables such as the height setting and sampling requirements are the same as dissolution testing. The rotating cylinder is very similar to USP method 1 (the rotating basket). With USP method 6, however, the basket assembly is replaced by a solid stainless steel cylinder. The cylinder consists of two parts that fit together: the main shaft/cylinder assembly plus an extension. The extension is used when the transdermal patch requires a larger area.
Figure 8. USP apparatuses 5 and 6 (paddle over disc and rotating cylinder, respectively).
The advantage of these apparatuses is the possibility to use a standard equipment (paddle) but, conversely, the disk assembly restricts the patch size.
Originally introduced in the USP as small-volume option for small transdermal patches, the USP apparatus 7 (reciprocating disk apparatus) was later renamed the reciprocating holder apparatus with the adoption of four additional holders for transdermal system, osmotic pumps and other low dose delivery systems.
Figure 9. USP apparatus 7 (reciprocating disk).
With this apparatus, switch to different pH buffer is easy and provides deformation rates higher than apparatus 2 but it is less diffused and used.
2.2.1 The Sartorius absorption model
The Sartorius Absorption Model was introduced in 1973 [17].
Figure 10. Schematization of the sartorius Absorption Model.
It simulates concomitant release from the dosage form in the gastrointestinal tract and drug absorption through the lipid barrier. The most important features of this model are the two reservoirs for holding different media at 37°C, a diffusion cell with an artificial lipid barrier of known surface area, and a connecting peristaltic pump which aids the transport of the solution or the media from the reservoir to the compartment of the diffusion cell. The two media typically used include Simulated Gastric Fluid and Simulated Intestinal Fluid. The drug substance under investigation is introduced, and its uptake in the diffusion cell is governed by its hydrophilic-lipophilic balance.
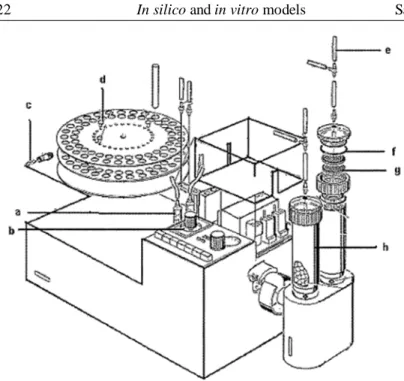
Figure 11. Sartorius dissolution model. a) plastic syringe, b) timer, c) safety lock, d) cable connector, e) silicon tubes, f) silicon O-rings, g) metal filter, h) polyacril reaction vessel.
Despite the simulation of both the dissolution and the absorption, the fluid dynamic of the system is very far from the real one and the pH changes are very difficult to be realized.
2.2.2 In vitro simulation of gastric digestion
Savalle et al. [18] proposed a simple in vitro method to simulate the gastric emptying of digestive product in 1989. To overcome the accumulation of digestion product and inhibition of proteolysis, a method based on the enzymatic hydrolysis of proteins with simultaneous dialysis of digested products was developed to simulate the pancreatic digestion. The aim of this work was to simulate several of the most important phenomena observed in vivo in the stomach during digestion of milk proteins, to obtain an in vitro model for studying gastric digestion of proteins. The gastric digestion unit was composed of a thermostated fermentor regulated at 37°C. Acidification of the medium and enzyme supply were ensured through two peristaltic pumps with variable flow rates and the pH of the incubation medium was measured, but not controlled, during digestion. HCl was added at constant flow rate together with diluted
Figure 12. pH decrease during in vitro gastric digestion of milk. n = number of experiments. A) 143 mM HCl, 1.5 mL/min, constant shaking; B) 143 mM HCl, 2.0 mL/min, constant shaking; C) 143 mM HCl, 2.0 mL/min, irregular stirring; D) 286 mM HCl, 3.0 mL/min, regular stirring.
The choice of pH conditions is a very important factor affecting the enzymes activity and thus the composition of the evacuated products. The slow decrease of the pH is necessary to ensure emptying of intact proteins or large peptides. Finally, the authors, by means of biochemical techniques, followed and reproduced the kinetics of the gastric digestion of milk proteins. This apparatus is very simple and pH changes are very easily obtained, even if only a constant adding of acid is allowed. However, the agitation and the fluid dynamic are very far from the real one.
2.2.3 A multicompartmental model simulating the stomach and small intestine
Minekus et al. [19] developed a completed and detailed in vitro model which simulates the dynamic physiological processes which occur in the lumen of stomach and small intestine of men in 1995. They described this model and its accuracy and reproducibility in
simulating gastrointestinal transit, pH, bile salts concentrations and the absorption of glucose. The model consists of four successive chambers simulating the stomach, duodenum, jejunum, and ileum.
Figure 13. In vitro model developed by Minekus et al. a) gastric compartment; b) duodenal compartment; c) jejuna compartment; d) ileal compartment; e) basic unit; f) glass jacket; g) flexible wall; h) rotary pump; i) water bath; j) peristaltic valve pump; k) peristaltic pump; l, m) pH electrodes; n, o) syringe pumps; p) hollow fibre device.
Each compartment is formed by two connected units consisting of a glass jacket with a flexible wall inside. Water is pumped from a bath into the glass jacket around the flexible walls to control the temperature in the unit. This ensure also the mixing of the chime by alternate compression and relaxation of the flexible wall.
3) pressure chamber; 4) intermediate piece; 5) flexible wall; 6) space between rigid and flexible wall; 8, 9, 10, 11) connectors [20].
In fact, the space between the rigid and the flexible wall of the chamber has been filled with a liquid or a gas under pressure and, as a result, the flexible wall is pinched. The mixture of the substances which was present in the hose of the pressure chamber will be driven out of this hose and forced through the intermediate piece into the unpinched hose of the pressure chamber. Then, the liquid is discharged through the outlet and the same operation is repeated for the other chamber. In this way, the substances present inside the flexible wall will flow back again. With this continuous movement, the peristaltic movements of the stomach and the intestinal tract are simulated and homogenization is ensured.
The compartments are connected by peristaltic valve-pumps. The pH values are controlled via computer by secreting acidic or basic solutions. The jejunal and ileal compartments are connected with hollow fibers to absorb digestion products and water from chyme and to modify electrolyte and bile salt concentration. The accuracy and reproducibility of the model was verified, as well as its ability to mimic the gastrointestinal transport of chyme. The model mimics gastrointestinal peristalsis, which results in physiological mixing. The pH and the enzymes and bile salts concentrations simulate the dynamic physiological patterns found in vivo. The hollow fiber devices appeared almost as efficient at absorbing glucose as the active process in vivo.
The authors tested the model reliability to reproduce predetermined physiological parameters, such as meal size and duration, pH, gastric and intestinal secretions, gastrointestinal transit, and adsorption of digested product and water [19]. Water and metabolites were absorbed adequately through hollow – fibre membranes inside the compartments. Experiments were performed to demonstrate that the short chain fatty acid could be dialyzed efficiently and that their concentration could be maintained within physiological limits [21]. The stability of the microflora in the system was tested after inoculation with fresh fecal samples and after inoculation with a
microflora that was maintained in a fermenter. This in vitro model
was used for several studies including the absorption of the products of digestion, the bioavailability of minerals, the survival rate of microorganism, the composition and enzymatic activities of the
microflora, and the functionality of recombinant microorganism in the
digestive environment [22]. This apparatus was also used to evaluate
in vitro – in vivo correlation [23].
Despite the accurate reproduction of the biochemistry of the gastrointestinal tract, the fluid dynamic, particularly in the stomach compartment, is still far from the real one.
2.2.4 Simulated biological dissolution and absorption system
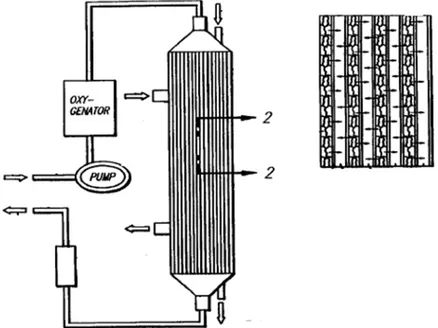
Tam and Anderson developed a method for assessing simulated biological dissolution of a pharmaceutical formulation and absorption of a pharmaceutically active compound [24].
According to the invention, this system comprises a dissolution chamber for determining the dissolution profile of the pharmaceutical formulation in a medium to be supplied to the apical surface of a cell monolayer, and a cell culture chamber wherein absorption may occur.
Figure 15. Simulated biological dissolution and absorption system by Tam and Anderson.
Medium is provided from an apical medium source chamber to a dissolution chamber using a gradient and flow control. Parameters such as pH and osmolarity may be measured by the gradient and flow control system. The apical medium will include bile salts, lipid or carbohydrates. The basal medium, which flows to the basal chamber of the cell culture chamber, may be of any type used to support cultured cells, and may comprise growth media, sera, buffers, minerals, nutrients, hormones, growth factors, and antibiotics. An automatic flow control system controls the temperature and partial pressure of the gas. In the dissolution chamber a dosage form is dissolved in the apical medium. The mixing rate in the dissolution chamber influences the unstirred water layer surrounding the dosage form, and thus is under automated control. Only a portion of the medium enters in the cell culture chamber to maintain a standard flow rate and to prevent excess shear stresses on the cell monolayer within the cell culture chamber. A filtration device may be incorporated into the dissolution chamber to control the size of the particles leaving the dissolution chamber. The basal surface of the cell monolayer is exposed to basal medium through the filter which is permeable to media.
Transepithelial electrical resistance analysis means may be used to determine the viability or integrity of the cell monolayer. Rotation of the filter ensures good mixing and minimizes the unstirred water layer adjacent to the cell monolayer.
![Figure 39. Correlation between apparent permeability of Caco-2 e MDCK for actively transported compounds (□), passively transported compounds (♦), and efflux substrates (○) [54]](https://thumb-eu.123doks.com/thumbv2/123dokorg/7198196.75379/84.892.342.678.559.911/correlation-permeability-transported-compounds-passively-transported-compounds-substrates.webp)
![Figure 48. Schematic of the membrane transport barriers across the intestinal epithelium during a perfusion of the intestinal lumen [10]](https://thumb-eu.123doks.com/thumbv2/123dokorg/7198196.75379/93.892.133.598.316.558/schematic-membrane-transport-barriers-intestinal-epithelium-perfusion-intestinal.webp)
![Figure 53. Schematic diagram of intestinal vascular perfusion without obstruction of mesenteric or portal blood flow [52]](https://thumb-eu.123doks.com/thumbv2/123dokorg/7198196.75379/97.892.247.520.217.574/figure-schematic-diagram-intestinal-vascular-perfusion-obstruction-mesenteric.webp)
![Figure 54. Schematic illustration of the vascularly perfused rat intestinal-liver preparation and the perfusion apparatus [52]](https://thumb-eu.123doks.com/thumbv2/123dokorg/7198196.75379/98.892.336.696.572.898/schematic-illustration-vascularly-perfused-intestinal-preparation-perfusion-apparatus.webp)
