SHAKE TABLE TESTS ON A OBELISK IN THE
FRAME OF THE EUROPEAN PROJECT
PERPETUATE
R. DʼIMPERIOENEA – Unità Tecnica Sviluppo di Applicazioni delle Radiazioni Laboratorio Micro e Nano strutture per la Fotonica
Centro Ricerche Frascati, Roma D. RINALDIS
ENEA - Unità Tecnica Caratterizzazione, Prevenzione e Risanamento Ambientale Centro Ricerche Casaccia, Roma
G. DE CANIO, M. MONGELLI, I. ROSELLI ENEA – Unità Tecnica Tecnologie dei Materiali Laboratorio Qualificazione Materiali e Componenti
Centro Ricerche Casaccia, Roma
AGENZIA NAZIONALE PER LE NUOVE TECNOLOGIE, LʼENERGIA E LO SVILUPPO ECONOMICO SOSTENIBILE
SHAKE TABLE TESTS ON A OBELISK IN THE
FRAME OF THE EUROPEAN PROJECT
PERPETUATE
R. DʼIMPERIO
ENEA – Unità Tecnica Sviluppo di Applicazioni delle Radiazioni Laboratorio Micro e Nano strutture per la Fotonica
Centro Ricerche Frascati, Roma D. RINALDIS
ENEA - Unità Tecnica Caratterizzazione, Prevenzione e Risanamento Ambientale Centro Ricerche Casaccia, Roma
G. DE CANIO, M. MONGELLI, I. ROSELLI ENEA – Unità Tecnica Tecnologie dei Materiali Laboratorio Qualificazione Materiali e Componenti
I contenuti tecnico-scientifici dei rapporti tecnici dell'ENEA rispecchiano l'opinione degli autori e non necessariamente quella dell'Agenzia.
The technical and scientific contents of these reports express the opinion of the authors but not necessarily the opinion of ENEA.
I Rapporti tecnici sono scaricabili in formato pdf dal sito web ENEA alla pagina http://www.enea.it/it/produzione-scientifica/rapporti-tecnici
SHAKE TABLE TESTS ON A OBELISK IN THE FRAME OF THE EUROPEAN PROJECT PERPETUATE
R. D’IMPERIO, G. DE CANIO, M. MONGELLI, D. RINALDIS, I. ROSELLI
Abstract
This report is presenting results of shake table tests performed on the frame of the European project PERPETUATE. The focus of PERPETUATE is the evaluation of the vulnerability of historical buildings to earthquake loading. In order to undertake an accurate evaluation it is important that the earthquake loading be defined in an appropriate manner. In section 1 main goals of PERPETUTE are briefly described. Section 2 discusses the hazard framework used for historical assets, including a brief overview of time-dependent hazard assessment. Generally hazard is assessed in terms of strong-motion. No new analysis is presented in this section, which is based on a review of existing literature. Section 3 is dealing with the design of shaking-table input (both original and LEMA-DES), describing the performed tests and giving a list of them. In particular Section 3.2 is dealing with the validation of Shake-Table tests and data interpretation. Section 4 is discussing the obtained results specially for LEMA-DES time-histories. Appendix A (section 6) shows the recorded time-histories for performed tests. Appendix B (section 7) the FAS of recorded time-histories.
Keyword: shake table tests, vulnerability of historical buildings, seismic input characterization.
Riassunto
Questo rapporto presenta i risultati di prove su tavola vibrante effettuate nell’ambito del progetto europeo PERPETUATE. Lo scopo di PERPETUATE è la valutazione della vulnerabilità degli edifici storici al carico sismico. Al fine di effettuare una corretta valutazione è importante che il carico sismico sia definito in modo adeguato. Nella parte 1 sono descritti brevemente i principali obiettivi di PERPETUATE. La parte 2 illustra il quadro di riferimento della sismicità storica utilizzato per la definizione del rischio sismico. Generalmente la pericolosità viene valutata in termini di accelerogrammi strong motion. Nessuna nuova analisi viene presentata in questa parte del rapporto, che si basa su una revisione della letteratura esistente. La parte 3 si occupa della progettazione dell’ input (sia originale e LEMA-DES), e descrive le prove eseguite. In particolare il paragrafo 3.2 si occupa della validazione delle prove e dell’interpretazione dei dati. La parte 4 discute i risultati ottenuti con particolare attenzione per quelle LEMA-DES. L’appendice A (parte 6) mostra le storie temporali registrate per gli esperimenti. L’appendice B (parte 7) le FAS corrispondenti.
INDEX
1. Introduction... 7
2.
SEISMIC HAZARD EVALUATION
... 82.1 HISTORICAL ANALYSIS... 8
2.2 STATISTICAL ANALYSIS... 10
2.3 THE SELECTED TIME-HISTORIES ... 12
3.
SHAKE TABLE TESTS
... 153.1 THE MECHANICAL SIMILARITY ... 15
3.2 SHAKE TABLE TESTS VALIDATION. ... 16
3.2 TEST WITH LEMA-DES TIME-HISTORIES: OBTAINED RESULTS. ... 18
4. CONCLUSIONS ... 20
5. REFERENCES ... 20
6. APPENDIX A: recorded TH ... 21
1. INTRODUCTION
The research program PERPETUATE (PERformance-based aPproach to Earthquake proTection of cUlturAl heriTage in European and mediterranean countries) is a project financed by the European Commission on the frame of the Seven Framework Program (FP7). The focus of PERPETUATE is the evaluation of the vulnerability of historical buildings to earthquake loading. In order to undertake an accurate evaluation it is important that the earthquake loading be defined in an appropriate manner. Historical buildings are generally considerably different than the type of structures covered by current seismic design codes and they present great variability as a group. Therefore, it is necessary to consider carefully what description(s) of earthquake loading needs to be considered for which type of historical building. Current seismic design codes for new structures are invariably based on acceleration response spectra, perhaps with the ability to conduct nonlinear time-history analysis for some important structures (e.g. Eurocode 8, EC8). However, it is not clear that this type of description is sufficient for all types of structures considered in PERPETUATE. In addition, the hazard framework (e.g. in terms of return periods and deterministic or probabilistic approaches) prescribed in current design codes may not be appropriate for historical assets due to, for example, their cultural and artistic importance.
WP4 of PERPETUATE is seeking to provide a framework for seismic hazard evaluation that is appropriate for historical assets. The deliverable D10, the first of WP2, seeks to provide a brief introduction to the task of classifying structures covered by PERPETUATE into a few categories by the characteristics of earthquake loading that could be important for a correct assessment of their performance. Besides the structural type, some topographic and soil conditions that are often specific to historical buildings can affect also significantly the seismic response and are not well covered by design codes for modern buildings. Consequently, in this deliverable these specific situations were discussed. In PERPETUATE WP4 it is planned to apply the recovered seismic hazard for the analysed area, to define earthquake actions in terms of selected time-histories. Furthermore, and besides the selection of appropriate seismic loading descriptors for different categories of monuments, it is necessary to define the probabilistic and deterministic framework on which these descriptors will be based.
Deliverable D4 of PERPETUATE (WP1, Task1.1) provides a detailed classification of cultural heritage assets by the type of damage mechanisms that they can suffer under earthquake actions (see, e.g., Table 4.3 of that report). Seven main asset classes are defined: A) assets subjected to prevailing in-plane damage, B) assets subjected to prevailing out-of-plane damage, C) assets damaged by high combined axial and bending loads, D) arched structures subjected to in-plane damage, E) massive structures to which local failure of masonry prevails, F) blocky structures subjected to overturning and sliding and G) built systems subjected to complex damage. This report adopts this classification for consistency and the following discussions are based on these seven asset classes.
This report is subdivided in 7 section: Section 1 discusses the hazard framework used for historical assets, including a brief overview of time-dependent hazard assessment. Generally hazard is assessed in terms of strong-motion. This section presents some conclusions and work to be undertaken in the following two tasks. The seismic historical compilations considered in this study are the new data sets recently made available to the scientific community by the INGV-DPC S1-Project, particularly the Parametric Catalogue of Italian Earthquakes CPTI04 [CPTI Working Group, 2004] and the related database of macroseismic intensity observations in Italy BDMI04 [DBMI Working Group, 2007]. The INGV-DPC S1-Project diffused the Uniform Hazard Spectra (S1-UHS) calculated for a 5 km wide mash covering the whole Italian territory and with a return-period of 475 years, that are statistically analysed together with the Local Elastic Spectra defined by the shape-parameters annexed in the new Italian seismic regulation [DM January 14, 2008]. For the seismotectonic characterization of the Latium area the Seismogenetic Zonation of the national territory ZS9 is adopted [Meletti et al., 2008]. Section 2 discusses the hazard framework used for historical assets, including a brief overview of time-dependent hazard assessment. Generally hazard is assessed in terms of strong-motion. No new analysis is presented in this section, which is based on a review of existing literature. Section 3 is dealing with the design of shaking-table input (both original and LEMA-DES)[Lenti & Martino, 2009], describing the performed tests and giving a list of them. The selected specimen is an obelisk. In
8
2. SEISMIC HAZARD EVALUATION
2.1 HISTORICAL ANALYSIS
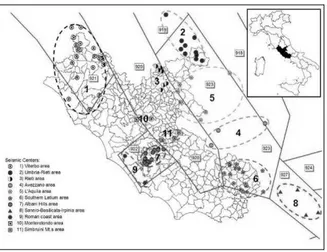
In order to evaluate the maximum local intensity felt in each Municipality and the seismological parameters of related earthquakes to be used as query-keys in the selection of ground-motion recordings from international accelerometric Data-Bases, the historical seismicity of Latium Region is analysed. The first step individualizes earthquakes with intensity observations higher than the damage threshold defined by the VI degree of the MCS scale within the Regional territory. In this way 103 events result selected; the spatial analysis of the epicentres overlapped to the ZS9 zones (Figure 1) highlights clusters of earthquakes that, for their level of magnitude, shape and distribution of intensities, can be considered representative of seismotectonically homogeneous areas, here called Seismic Centres (SC).
Figure 1 Distribution of historical seismicity
Each SC can be described as follows: the ZS9 n. 923 (referred as the area of greatest release of seismic energy in Center-Southern Apennine, with wide extensional seismogenetic structures and high magnitude earthquakes) includes the SC4 “Avezzano area” and SC5 “L’Aquila area” with 6.5-7.0M events and epicentral intensities (Io) between IX-X and XI MCS; SC2 “Umbria-Rieti area” (6.0-6.5M and Io between X and XI MCS); SC6 “Southern Latium” (6.0-6.5M and Io between IX-X and X MCS). The ZS9 n. 927 (outward Regional boundary but influencing the levels of Latium local shaking and characterized by an extensive tectonics and representing the area of maximum release of seismic energy in Southern Apennine) includes SC8 “Sannio-Basilicata-Irpinia area” (6.5-7.0M and Io between X and XI MCS). In ZS9 no. 920 (coincident with the Tyrrhenian sector of Apennine with extensive tectonics, characterized by a low energy seismicity and few events with relatively elevated magnitude) are located the SC3 ”Rieti area” (5.5-6.0M and Io between VII-VIII and VIII-IX MCS) and two Seismic Centres, SC10 “Monterotondo area” and SC11 “Monti Simbruini area”. The latter are characterized by a local seismicity (5.0M and Io between VI and VII) furnish a non negligible contribution in the definition of the local seismicity levels. Finally, the n. 921 and 922 ZS9 (related to the volcanic districts of the northern Latium and the Albani Hills respectively) include the areas of the Tyrrhenian Central Italy side with an elevated heat-flow and characterized by a diffused seismicity with a moderate energy release and very few peak-magnitude events. The ZS9 n. 921 includes SC1 “Viterbo area” (5.0-5.5M and Io between VII and VIII MCS) while in ZS9 n 922 are located the SC7 “Albani Hills area” (5.0-5.5M and Io between VI-VII and VII-VIII MCS) and the SC9 “Roman coast area” (5.0-5.5M and Io between VI and VII MCS), characterized by predominantly local events.
To obtain a reliable evaluation of the spatial intensity distribution as to minimize the influence of site geological-morphogical characteristics on each local intensity level and to get a realistic areal spread of macroseismic data points, we tried the application of intensity-epicentral distance decay models, particularly the Blake’s classical relationship [Blake, 1941] with the parameters esteemed for Central Italy, and some new
formulations adopted during the INGV-DPC Project-S1 [Gómez Capera et al., 2007], i.e. a model that hypothesizes a decay proportional to the cubic root of the epicentral distance [Gómez Capera, 2006] and a log-linear type scaled on a specific definition of epicentral intensity [Pasolini et al., 2007a–b]. Tests performed by some of the selected events furnished unsatisfactory results as the distribution of residuals between observed and theoretical intensities appeared widely variable both is in terms of epicentral distance and azimuth. This result can be ascribed to the basic hypothesis in all adopted attenuation models of an isotropic intensity decay, while the macroseismic fields, particularly for the events in the Apennine area, show a strong anisotropy, i.e. the intensity decay seem to be lower in NW-SE Central Apennine chain direction than in orthogonal SW-NE one. For this reason the spatial distribution of the intensities is modelled by manually traced isoseismal maps. Each SC is analyzed separately starting from the strongest earthquakes characterized by the higher level of Io and more homogeneous distribution of local intensity data points. As a result, 29 of 103 selected earthquakes confirm an important influence in the assessment of local historical seismic hazard in Latium Region area.
Figure 2 Maximum historical intensity distribution in Latium Region
Subsequently, the isoseismal maps has been geographically referred and elaborated by ArchGIS® in order to identify, in every Municipality, the maximum value of local intensity and the seismic parameters of generating events in terms of Io, Magnitude and epicentral distance, considering separately the contribution of each SC. In case of identical maximum local intensity due to several earthquakes, the ones related to events with the closest epicentre are selected. Finally, merging the contribution of all SC, for each Municipality the maximum values of historical intensity are selected. The geographical distribution of these values is shown in Figure 2. According with the structural and seismotectonic features in Central Italy, these values form a series of bands parallel to the Apennine chain axis; the higher intensities are located close to Rieti and Southern Latium SC. An ample band with intermediary intensity, between VI-VII and VII MCS, occupies the central section of the Latium Region, including the SC of Viterbo and Albani Hills, as well as the smallest SCs located near Monterotondo and Simbruini Mountains areas. Finally, by the coast the lowest intensities values are located.
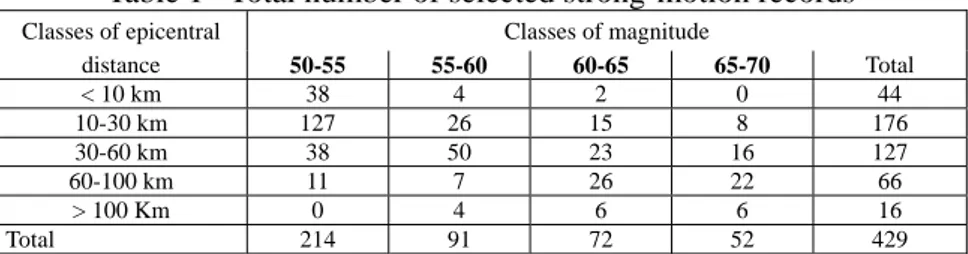
Table 1 Total number of selected strong-motion records
Classes of epicentral Classes of magnitude
distance 50-55 55-60 60-65 65-70 Total < 10 km 38 4 2 0 44 10-30 km 127 26 15 8 176 30-60 km 38 50 23 16 127 60-100 km 11 7 26 22 66 > 100 Km 0 4 6 6 16 Total 214 91 72 52 429
10
Magnitude: 5.0-5.5, 5.5-6.0, etc.; epicentral distance: 0-10km, 11-30km, 30-60km, 60-100km, >100km). Considering that the maximum historical intensity for each Municipality can derive from the contribution of several SCs, at the end of this analysis are obtained 10 Municipality affected by 4 SCs (and consequently are related to 4 different SI); 33 Municipalities by 3 SCs; 144 by 2 SCs and 239 by only one SC. To verify the real influence of different SCs on the hazard level of each Municipality with more than one SI, the probable level of local shaking computed in terms of Predicted Spectrum of Acceleration (PSA), is obtained by the attenuation model [Sabetta and Pugliese, 1996]: in this case the PSAs are calculated by the upper-bound values of magnitude and epicentral distance Classes related to the SI, for a seismic bedrock. As final result for each Municipality the triplets of Io, magnitude and epicentral distance values are obtained and used as search-keys in querying the international accelerometric data-bases. Table 1 shows the number of strong-motion recordings selected according to these criteria.
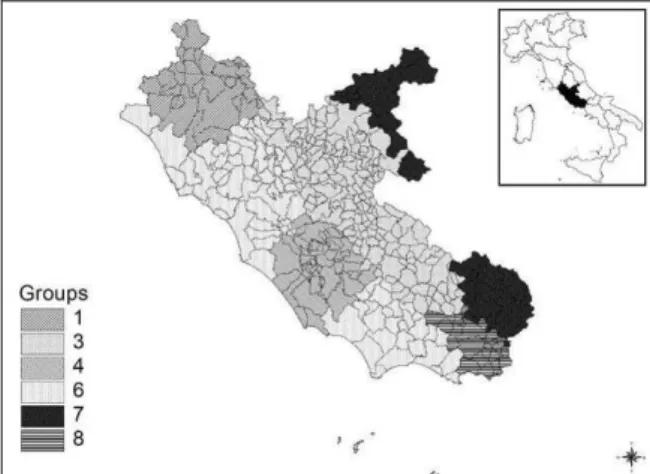
Figure 3 Groups of Municipalities from statistical cluster analysis
2.2 STATISTICAL ANALYSIS
Main goal of the statistical cluster analysis is to achieve an hazard zonation at a Municipality level, both statistically significant and consistent with other information on seismicity of the region (supervised
clustering). In this light, after try-and-error attempts, a kernel density algorithm (non parametric cluster) is
chosen,. In kernel density clustering, each group is fixed as a region surrounding a local maximum of the probability density function, with no specific assumption on its shape. For a better spectra classification incremental ratios of a particular interpolating function are used instead of original absolute acceleration values. On this purpose, for every Uniform Hazard Spectra (S1-UHS) related to each mesh-points of the grid defined by INGV-DPC S1-Project, a fitting operation is performed by a non-linear Pearson IV equation, regressing acceleration response (y) on period (x). The fit result shows a good interpolation (mean R2 near 0.99).
(a) S1-UHS (b) Elastic response spectra Figure 4 Comparison between cluster analyses on S1-UHS and spectra from seismic Regulation
After performing kernel density cluster, an optimal number of 7 clusters can be fixed. Subsequently, to get an administrative boundary by a grid-point classification, an inductive process is made by both visual and statistical criteria, such as geographical contiguity of each point (Figure 3).
Secondly, as the new seismic Regulation [DM January 14, 2008] furnish formulae and parameters (ag, TC and
F0) to draw up the elastic response spectra in the same grid-points defined by INGV-DPC S1-Project, most
evident discrepancies between this kind of estimates and S1-UHS data are studied. The analysis is performed by the same statistical technique used to treat S1-UHS. Figures 4(a-b) show the comparison of these calculations. The maps clearly show some discrepancies nearby Tuscany and Campania border and in Albani hills area, while in Latium central area and nearby Abruzzo border these difference no negligible.
In order to obtain a more convenient framework for both spectra shape data-set achieved the average spectra values for each Cluster are calculated. The clusters showing a negative difference in spectra value are especially significant because adopting regulations parameters in a limited frequency interval the local seismicity is underestimated. For instance in group n. 6, within the 0.6–1.5 seconds range period, regulations tend to undervalue the acceleration, particularly for the 1 second period where the negative gap is more than 10% (Figure 5).By exploring difference distribution by clusters an evidence of spatial autocorrelation is shown: this kind of error is not casual but systematic one, related to peculiar territory features, being positive in some clusters and negative in others.
0.04 0.06 0.08 0.10 0.12 0.14 0.16 0.18 0.20 0.22 0.24 0.26 0 0.5 1 1.5 2 Period M ea n uni fo rm ha za rd r es pons e s p ec tr INGV Regulations
Figure 5 Comparison between seismic Regulation and S1-UHS data for cluster n. 6
90° percentile of 6 Clusters 0 0.1 0.2 0.3 0.4 0.5 0.6 0.7
Agt000 Agt010 Agt015 Agt020 Agt030 Agt040Agt050 Agt075 Agt100 Agt150 Agt200
1 3 4 6 7 8
12
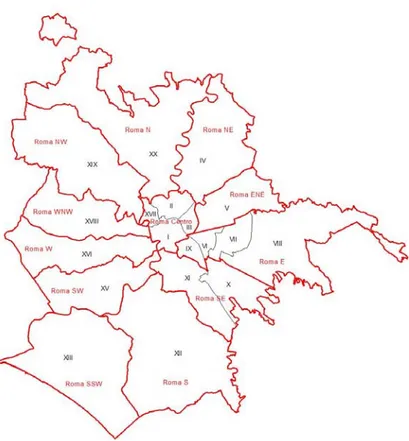
Figure 6b: Municipalities of Rome
2.3 THE SELECTED TIME-HISTORIES
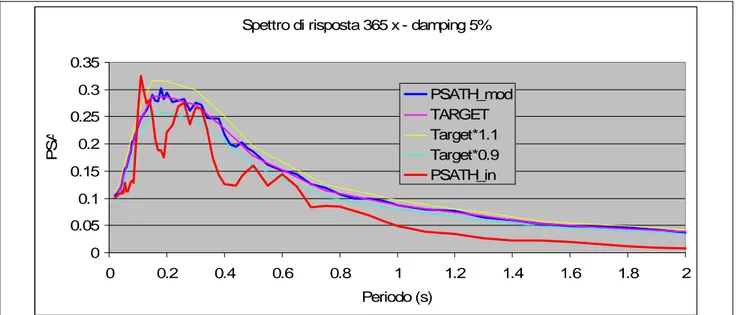
The new Italian seismic law [DM January 14, 2008] admits the use of registered accelerograms, when their choice is representative of the site seismicity; besides must be adequately justified by the seismogenic characteristics of the source, and the conditions of site registration, the magnitude, distance from source and at maximum horizontal acceleration. The accelerograms registered must be selected and scaled in order to approximate the spectra response within the periods of interest. The result of historical and from statistical analysis is collected in lists of events and ground-motion recordings, selected by the SI for each administrative cluster and the relationship between these SI and 6 spectral shapes (Fig. 6a) selected by the statistical analysis. The algorithm to generate time-histories takes account of such constraints. Schematically to define the accelerometric records, first of all a defined Municipality is selected; then the spectrum of the group to which the Municipality belongs and the SI are identified, and then, based on the SI chosen, the events divided by class of magnitude and the relative real accelerometric records are selected [Rinaldis et al., 2008]. Figure 7a shows the response spectrum of the selected t.h. for a return period of 475 years (Arienzo, Campano-Lucano Earthquake 23 November 1980, Ms = 6.9) compared to the UHS of the Municipality (Rome Down Town: see fig. 6b). Figure 8a shows instead the related time history. Figure 7b shows instead the response spectrum for a return period of 2475 years and fig. 8b the related time history.
Spettro di risposta 365 x - damping 5% 0 0.05 0.1 0.15 0.2 0.25 0.3 0.35 0 0.2 0.4 0.6 0.8 1 1.2 1.4 1.6 1.8 2 Periodo (s) PS A PSATH_mod TARGET Target*1.1 Target*0.9 PSATH_in
Figure 7a. Acceleration Response Spectrum of Arienzo (NS component) compared to the target UHS RP= 475. 0,00 0,10 0,20 0,30 0,40 0,50 0,60 0,70 0,00 0,20 0,40 0,60 0,80 1,00 1,20 1,40 1,60 1,80 2,00 PS A PERIODS (s) Titolo del grafico
TARGET PSATH_in TARGET*0,9 TARGET*1,1
PFigure 7b. Acceleration Response Spectrum of Arienzo (NS component) compared to the target UHS RT = 2475.
14
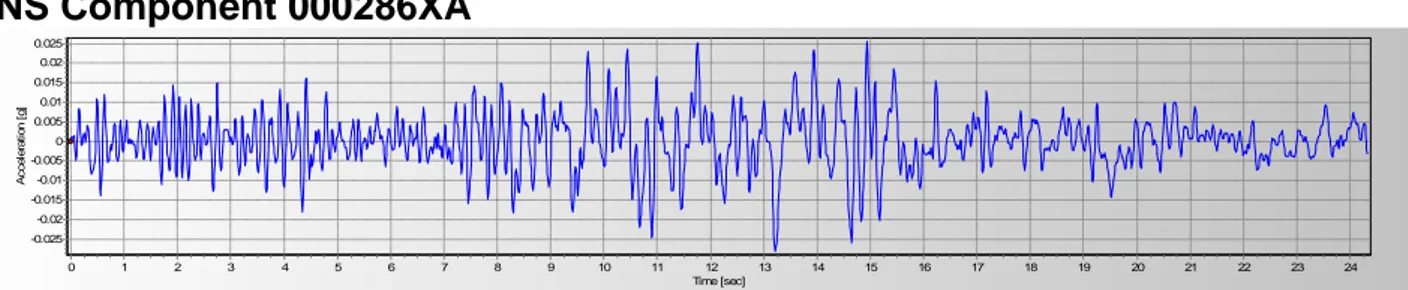
NS Component 000286XA
Time [sec] 24 23 22 21 20 19 18 17 16 15 14 13 12 11 10 9 8 7 6 5 4 3 2 1 0 A c c e le ra ti o n [g ] 0.025 0.02 0.015 0.01 0.005 0 -0.005 -0.01 -0.015 -0.02 -0.025
Duration 24.32sec; Amax=0.02812236g a 13.22sec. - Arias Intensity: 0.01794586m/sec
EW Component 000286XA
Time [sec] 24 23 22 21 20 19 18 17 16 15 14 13 12 11 10 9 8 7 6 5 4 3 2 1 0 A c c e le ra ti o n [g ] 0.03 0.025 0.02 0.015 0.01 0.005 0 -0.005 -0.01 -0.015 -0.02 -0.025 -0.03 -0.035
Duration 24.29sec; Amax=0.03634569g a 12.17sec. - Arias Intensity: 0.02175771m/sec
UP Component 000286XA
Time [sec] 24 23 22 21 20 19 18 17 16 15 14 13 12 11 10 9 8 7 6 5 4 3 2 1 0 A c c e le ra ti o n [g ] 0.015 0.01 0.005 0 -0.005 -0.01 -0.015 -0.02
Duration 24.31sec; Amax=0.02156714g a 10.42sec. - Arias Intensity: 0.00879848m/sec
Figure 8a. Acceleration time histories recorded at the station of Arienzo (Campano-Lucano Earthquake 23rd November 1980, Ms=6.9) (RP=475).
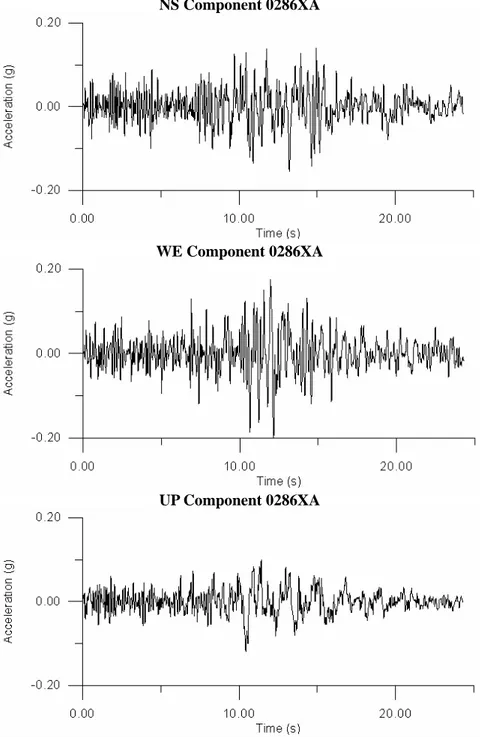
NS Component 0286XA
WE Component 0286XA
UP Component 0286XA
Figure 8b. Acceleration time histories recorded at the station of Arienzo (Campano-Lucano Earthquake 23rd November 1980, Ms=6.9) (RP=2475).
3. SHAKE TABLE TESTS.
Shake-table tests are, at the today state of the art, the unique experimental tool where linear and non-linear behaviour of structures could be studied, excluding direct seismic events recordings. Unfortunately, due to the reduced table payload, the weight of specimens do not allow full-scale tests on very large buildings; shake-table tests are limited, as well, because of peak displacement limits (at the ENEA facility is ± 12.5 cm). In this condition, if the design spectra or time-histories corresponds to PGD > 12.5 cm, to have comparable results of tests and numerical analysis, two solutions are possible: specimens on shake-table are full-scale and time-histories
16
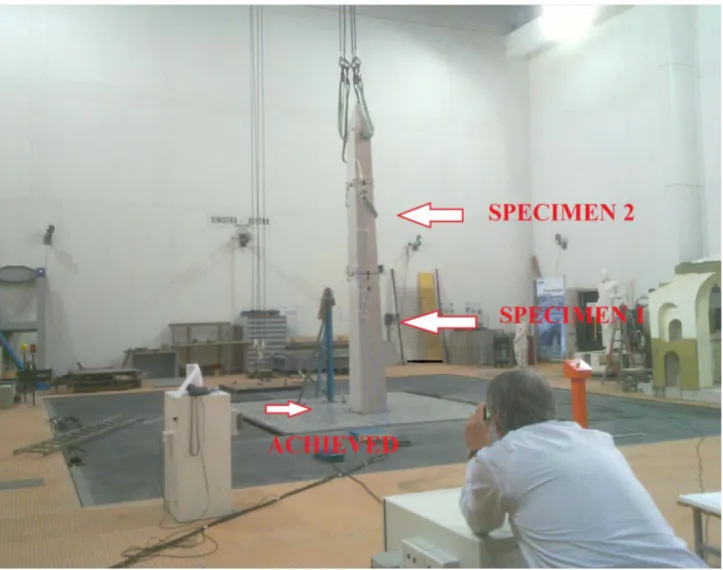
3.1 THE MECHANICAL SIMILARITY.
The selected recordings of the Campania and Lucania earthquake of November 23, 1980 at Arienzo obtained for a return period of 475 years (see deliverable D12 Perpetuate seismic input) and the same for a return period of 2475 years and from those obtained by applying the same methodology LEMA_DES (see Lenti L. and Martino S., 2009), are the input of the structure. At the last meeting (October 11, 2011) it was decided to conduct tests on the shaking table considering the structure as a representative of an obelisk is that of a 1:1 scale 1:6 scale model that represents the Lateran obelisk in Rome. For the first do not need modification of the acceleration time histories that will be provided to a sampling step of 0.01 seconds. Regarding the second test, the conditioning of the time histories, in order to transfer the results of the stress on the 1:6 scale model of the real structure requires a preliminary study of the conditions of mechanical similarity between the two structures (real and the scaled model). Appendix A shows plots of recorded time-histories obtained for all designed tests when Appendix B contains the corresponding plots of FAS. In particular tests were executed on 11th , 12th , 20th and 23rd of January 2012.
* * *
In the description of the physical phenomena involved the consideration of various physical quantities that can be divided into classes of homogeneous quantities: within each class, each element can be represented as a function of any other element of the same class taken as a standard and which gives the name of the measurement unit. So if for example, [Q] is the unit of measure, the size of each element of the class Q can be represented by the product
Q= q [Q]
Where q is a pure, positive real number (in most cases entire) who is said to measure the item considered in relation to the selected unit.
When you are dealing with a variety of physical quantities of different species, linked by a physical law, instead of defining each, regardless of the other, a unit of measure is necessary to define the unit of measurement of only some of them and determine the unit of measure of the remaining quantities depending on the other. We consider the quantities A, B, C of different species and corresponding measures a, b, c in their respective units [A], [B], [C]. Any other quantity, different from previous, is said derived from those if it is defined as a function of a, b, c. So if α, β, γ are rational numbers, the measure d of D is defined by the relation:
d=a
αb
βc
γThis relationship is based on dimensional analysis that is a procedure used to obtain information about physical systems too complex to obtain from the mathematics analysis a complete description of the above metionned system or otherwise satisfactory. An application of dimensional analysis is Buckingham's theorem, also called theorem Π: given a set of physical quantities x 1, x 2, ..., xn, for which there is only one complete mathematical relationship that tie F (x 1, x 2, ..., xn). If the relationship of the n dimensional quantities are expressed as a function of their measures a, b, c, then the relation F can always be expressed using an arbitrary function of n-m products π1, π 2 …, π n-m independent dimensionless, constructed with the n parameters. This theorem assumes a particular importance for tests on a vibrating table model in scale 1:λ. In particular if the corresponding parts of the real system and the scale are made of the same material and forces agents compare the weight (and if the field is the same accelerations) applies the rule of Newton: stated as λ the geometrical similarity ratio to match any size Q formula, dimensional L M T and its unit of measure q is expressible in the formula:
Q=q λ
α+3β+γ/2(1)Bearing in mind the dimensionless relationship of acceleration, density, force and inner tension and considering that Sa=1, Sσ=1 (with Sx is defined as the factor x for which goes divided the real system to get the similarity
with the scaled model) we obtain
St=λ
0.5, Sf= λ
−0.5, Sρ=1 , Sp= λ
3 and the forceSF= λ
3.3.2 SHAKE TABLE TESTS VALIDATION.
Large servohydraulic shake tables, such us the ENEA-CASACCIA facility, are complex systems designed to
1If we have Sσ=1 then should be [ML‐1T‐2]=1 and L/Lλ=λ; further if Sa=1 then should be [LT‐2]=1 and in the
LαMβTγ to verify the first relationship: Mβ=λ3β and to verify the second one Tγ=λγ/2
subject structures to seismic loads such us the acceleration records obtained during the major earthquakes that struck the Italian territory. A typical shake table system includes a variety of mechanical, hydraulic and electronic apparatous. The size of specimens and the severity of the ground motion input require a well designed system controller: ENEA shake table may operate in displacement control mode (dispacement feedback). To increase the accuracy in reproducing the prescribed acceleration records (in our experiment the input for the obelisk), the displacement control strategy is usually augmented with additional control gains acting on the velocity and/or acceleration command signals. Unfortunately, due to external causes, for the actual experiment the table operate on acceleration control mode.The process of “tuning” the shake table to improve the accuracy in reproducing the prescribed input, require to adjust several parameters. Another parameter to take in account is the mass of the specimen that will interact with the shake table. Ideally, a tuned shake table will have a total transfer function with gain 1 and phase shift 0. Some authors studied for their systems tests (Luco & al., 2010) or algorithms (Ceresa & al., 2012) to try to recover measurments errors to correct their results. An approach to validate the results from shake table tests, for the ongoing experiment, may be proposed: this approach is based on a comparison between the achieved acceleration time-history at the specimen basement and the desired signal (drive). Figure 8 shows a blow-up of the FFT of the acceleration amplitude in the frequency range 0-10 Hz. As it is possible to state
differences between the drive and the achieved records of the full scale test runned the 12th of January 2012 and
repeated the 19th are negligible in the frequency range between 1 and 10 Hz. Since the difference in the amplitude
in the 0-1 frequency interval are due to a system inner limit (the table will work as a high-pass filter reducing the drive frequency content in the roll-off interval in such a way that a(ω)/ω=k; this effect is considerably reduced when testing the obelisk structure as 1:6 scaled model: see figure 11) that will not affect the results of the test, is then possible to state that in the selected frequency interval rusults are reliable and, within a certain error, repeteable. Figure 10 shows instead that outside the above mentionned frequency range the experiment it is not reliable nor repeteable.
0.50 1.00 1.50 2.50 3.00 3.50 4.50 5.00 5.50 6.50 7.00 7.50 8.50 9.00 9.50 0.00 2.00 4.00 6.00 8.00 10.00 0.00 0.01 0.02 0.03 0.04 0.05 FFT AMPLITUDETEST OF 12 January
FFT AMPLITUDE TEST OF 19 January ______
FFT AMPLITUDE TEST OF 19 January ______ (DRIVE)
SMOOTHING 5 TIMES
18 2.50 5.00 7.50 12.5015.0017.50 22.5025.0027.50 32.5035.0037.50 42.5045.0047.50 0.00 10.00 20.00 30.00 40.00 50.00 0.00 0.01 0.02 0.03 0.04 0.05 FFT AMPLITUDETEST OF 12 January
FFT AMPLITUDE TEST OF 19 January ______
FFT AMPLITUDE TEST OF 19 January ______ (DRIVE)
SMOOTHING 5 TIMES
Figure 10. FFT of Acc. Test of Obelisk as 1:1 structure 0-50 Hz
0.00 4.00 8.00 12.00
0.00 0.01 0.02 0.03
DRIVE LON TEST 11 January
ACHIEVED LON TEST 11 January
Fugure 11 : FFT of Acc. Test of Obelisk as 1:6 structure 0-10 Hz
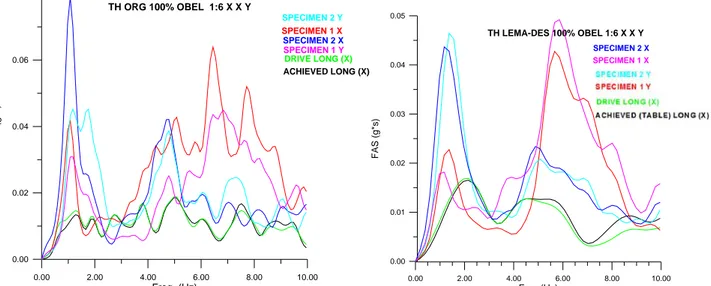
3.3 TEST WITH LEMA-DES TIME-HISTORIES: OBTAINED RESULTS
First, the comparison between the FAS of the acceleration occurs in the frequency range 0-10 Hz, it is certainly the most significant for the structure. However, it is well know that the above these frequencies are the contributions due to the vibrating table and the reaction mass which makes little use of the analysis of the results. In the range where you want to validate the testing done you can do the following notations:
- The spectral values of the drive signal and that obtained on the shaking table (Achieved) could be considered coincident, then these frequencies of interest to be transferred to the energy input required (for this point the LEMA-DES also behaves better than ORG), see figure 13. You can do the same considerations, comparing the
figures of Appendix B for the same type of experiment: e.g. FAS-INPUT-80% ORG XYZ-OUT-Y, page 98, and FAS-INPUT-80% LEMA XYZ-OUT-Y, page 105).
- The values of the frequencies of the first resonance of the obelisk measured on the first ashlar obelisk in the X direction (specimen 1 X) seem to coincide in the spectra obtained with the two signals, even if the amplitude and the bandwidth are slightly different.
- The same thing happens for the Y direction (specimen 1 Y) where, however, a reversal of the value of the frequency at which the peak occurs (ie ORG while the lowest frequency at which the peak occurs is obtained in the X direction for LEMA-DES have it in the Y direction, however it should be noted that the peaks are very close and that the difference could be caused by the operation of smoothing).
- The spectral values measured for the first resonance on the second ashlar both in the X direction (specimen 2 X), which in the Y direction (specimen 2 Y) are, of course, much higher. If LEMA-DES are both lower and higher bandwidth, in addition to LEMA-DES peak in the Y direction seems higher than in the X direction, but much less than ORG in which two peaks appear close together and overlapping .
In general, however, seems to me that the results obtained are encouraging, both for the detection of resonance frequencies of the structure stressed that for excitation levels obtained. Obviously, these results are preliminary, waiting for analyzing the recordings of the other tests for both the considered structure 1:6 scale than for that in a 1:1 scale. It seems to be even more challenging analyzes of trials with dimensional stresses in three-dimensional view of the structural response to an axial stress.
20 0.00 2.00 4.00 6.00 8.00 10.00 Freq. (Hz) 0.00 0.02 0.04 0.06 0.08 F AS (g* s ) DRIVE LONG (X) ACHIEVED LONG (X) SPECIMEN 1 X SPECIMEN 2 Y TH ORG 100% OBEL 1:6 X X Y SPECIMEN 2 X SPECIMEN 1 Y 0.00 2.00 4.00 6.00 8.00 10.00 Freq.(Hz) 0.00 0.01 0.02 0.03 0.04 0.05 FAS ( g *s ) TH LEMA-DES 100% OBEL 1:6 X X Y SPECIMEN 2 X SPECIMEN 1 X
Figure 13: comparison between FAS (smoothing with Hanning window 5 times) the acceleration of the drive and recorded on the table (Achieved) and on the obelisk (specimen) to 100% of the peak value for the recording of Arienzo (TR = 2475 years) the original (ORG) or LEMA-DES. The registration for ORG refers to Test on the scale model 1:6 of 18 January 2012 with excitation along the X axis (longitudinal) and the recording along the axes X and Y. Registration for LEMA-DES instead was made on January 23 for the same conditions
4. CONCLUSIONS
The selected procedure to shake-table tests validation (comparison between the achieved acceleration time-history at the specimen basement and the desired signal), since the difference in the amplitude in the 0-1 frequency interval are due to a system inner limit (the table will work as a high-pass filter reducing the drive frequency content in the roll-off interval in such a way that a(ω)/ω=k) and shake-table resonance frequencies dissipate input energy an error in the test procedure should be extimated; this effect is considerably reduced when testing the obelisk structure as 1:6 scaled model: so those limits will not affect the results of the test, is then possible to state that in the selected frequency interval rusults are reliable and, within a certain error, repeteable. Results obtained, by LEMA-DES inputs, are encouraging, both for the detection of resonance frequencies of the structure stressed that for excitation levels obtained. Obviously, these results are preliminary, waiting for analyzing the recordings of the other tests for both the considered structure 1:6 scale than for that in a 1:1 scale. It seems to be even more challenging analyzes of trials with three-dimensional stresses in three-dimensional view of the structural response to an axial stress.
5. REFERENCES
Blake, A. (1941). On the estimation of focal depth from macroseismic data. Bulletin of the Seismological
Society of America 31:3, 225-232
CPTI Working Group (2004). Catalogo Parametrico dei Terremoti Italiani, versione 2004 (CPTI04), INGV, Bologna, Italy. Available at http://emidius.mi.ingv.it/CPTI04/.
DBMI Working Group (2007). Database macrosismico utilizzato nella compilazione di CPTI04. INGV, Milan, Italy. Available at http://emidius.mi.ingv.it/DBMI04/.
DGR Lazio 766 August 1, 2003. Riclassificazione sismica del territorio della Regione Lazio in applicazione dell’Ordinanza del Presidente del Consiglio dei Ministri n° 3274 del 20 marzo 2003. Prime disposizioni. pubblicato sul Bollettino della Regione Lazio Parte I del 10 ottobre 2003.
DM January 14, 2008. Nuove norme tecniche per le costruzioni, pubblicato sulla Gazzetta Ufficiale n. 29 del 4 febbraio 2008 - Suppl. Ordinario n. 30. Available at http://www.cslp.it/.
Gómez Capera, A.A. (2006). Seismic Hazard Map for the Italian territory using macroseismic data. Earth
Gómez Capera, A.A., Meletti, C., Rebez, A. and Stucchi, M. (2007). Mappa di pericolosità sismica in termini di intensità macrosismica ottenuta utilizzando lo stesso impianto metodologico di MPS04. Progetto DPC-INGV S1, Deliverable D7, available at http://esse1.mi.ingv.it/d7.html (in Italian).
INGV-DPC Project S1, (2004). Agreement between National Institute of Geophysics and Volcanology and Civil Protection Department, 2004-2006)
Meletti, C., Galadini, F., Valensise, G., Stucchi, M., Basili, R., Barba, S., Vannucci, G. and Boschi E. (2008). A seismic source zone model for the seismic hazard assessment of the Italian territory. Tectonophysics 450, 85–108.
OPCM 3519 April 28, 2006. Criteri generali per l'individuazione delle zone sismiche e per la formazione e l'aggiornamento degli elenchi delle medesime zone. Pubblicato sulla Gazzetta Ufficiale del 11 Maggio 2006 – Serie Generale n. 108 n. 30.
Pasolini, C., Gasperini, P., Albarello, D., Lolli, B. and D’Amico, V. (2007a). The attenuation of seismic intensity in Italy part I: theoretical and empirical backgrounds. Bulletin of the Seismological Society of
America 98:2, 682-691.
Pasolini, C., Albarello, D., Gasperini, P., D’Amico, V. and Lolli, B. (2007b). The attenuation of seismic intensity in Italy part II: modeling and validation. Bulletin of the Seismological Society of America 98:2, 692-708.
Rinaldis, D., Clemente, P., Pugliese, A., Sabetta F. (1994). Low frequency content of Italian strong-motion records. Proceedings 10th European Conference on Earthquake Engineering, Vienna.Balkema, Rotterdam,Vol.1,
195-201
Rinaldis, D., Martini, G., Paciello, A., Paolini, S., Fabrizio, F., Zini, A. (2008). Analisi della sismicità regionale ai fini dell’individuazione di classi di comuni con situazioni omogenee di scuotibilità in occasione di eventi sismici - Final Report, Rome, Italy (in Italian).
Sabetta, F. and Pugliese, A. (1996). Estimation of response spectra and simulation of nonstationary earthquake ground motions. Bulletin of the Seismological Society of America 86:2, 337-352.
Silva, J.W., 1984. WES RASCAL Code for synthesizing earthquake ground motions. U.S. Army Corps of Engineers.
Lenti L., Martino S., (2009). “New procedure for deriving multifrequential dynamic equivalent signals (LEMA_DES): a test-study based on Italian accelerometric records”. Bull Earthquake Eng., Springer, DOI 10.1007/s10518-009-9169-7.
Luco J.E:, Ozcelik O., Conte J.P., (2010) “Acceleration Tracking Performance of the UCSD-NEES Shake Table” . Journal of Structural Engineering, ASCE, Vol. 136, N° 5, 481-490.
Ceresa P., Brezzi F., Calvi G.M., Pinho R., (2012). “Analytical modeling of a large-scale dynamic testing facility”. Earthquake Engineering and structural Dynamics, Vol. 41, 255-277.
Benedetti D., Carydis P., Pezzoli P., (1998). “Shaking table tests on 24 simple masonry buildings”. Earthquake Engineering and Structural Dynamics, VOL. 27, 67-90.
6. APPENDIX A
Starting from the 12th up to 23rd January 2012 the following tests were performed:
- five series of seismic tests (t.h. of Arienzo scaled at PGA TR of 2475 years and LEMA-DES) 11th January:
specimen 1:1
three-dimensional XYZ 100% achieved XYZ : obel_th_org _ACHIEVED_XXX_.TXT obel_th_org _DRIVE_XXX_.TXT XXX=long,lat,vert
obel_th_org _SPECIMEN_YY_.TXT YY=Tx,Ty,Tz specimen 1:6
three-dimensional XYZ 100% achieved XYZ : obel_th_org_S_ACHIEVED_XXX_.TXT obel_th_org_S_DRIVE_XXX_.TXT XXX=long,lat,vert
obel_th_org_S _SPECIMEN_YY_.TXT YY=Tx,Ty,Tz
monodimensionale X 100% achieved X: obel_th_org_S_X _ACHIEVED_Long_.TXT obel_th_org_S_X _DRIVE_Long_.TXT, obel_th_org_S_X _SPECIMEN_Tx_.TXT
22
specimen 1:6
one-dimensional X 100% achieved X: obel_th_org_x New _ACHIEVED_.TXT, obel_th_org_x New _DRIVE_.TXT, obel_th_org_x New _SPECIMEN_.TXT.
1.) Two series: three-dimensional XYZ e one-dimensional X, obelisk scaled 1:1 scaling the t.h. amplitude of 40%, 60%, 80%, 100%.
2.) Two series: as the previous one, obelisk scaled 1:6 scaling the t.h. amplitude of 40%, 60%, 80%, 100%, 120%, 130%.
The tests were stopped when the obelisk oscillations were significant. - Four series of shock-tests (LEMA-DES)
1.) three-dimensional XYZ e one-dimensional X obelisk scaled 1:1 scaling the t.h. amplitude of 40%, 60%, 80%, 100%, 120%.
2.) three-dimensional XYZ e one-dimensional X obelisk scaling the t.h. amplitude of of 40%, 60%, 80%, 100%, 120% 130%.
Plots of time-histories are catalogued as: specimen 1:N
three-dimensional XYZ nn% acquisition XYZ : obel_th_kkk _WHAT_XXX_.TXT obel_th_kkk _DRIVE_XXX_.TXT XXX=long,lat,vert - N= ,S – nn=40-60-80-100, kkk=org, shk(LEMA-DES) , WHAT=ACHIEVED, DRIVE, SPECIMEN, in the case of SPECIMEN
obel_th_kkk _SPECIMEN_YY_.TXT YY=Tx,Ty,Tz or
one-dimensional X nn% acquisition X: obel_th_kkk_S_X _ACHIEVED_Long_.TXT obel_th_kkk_S_X _DRIVE_Long_.TXT, obel_th_kkk_S_X _SPECIMEN_Tx_.TXT.
APPENDIX A – JAN 18TH 2012 TESTS
APPENDIX A – JAN 20TH 2012 1:6 SCALE TESTS
APPENDIX A – JAN 23TH 2012 LEMA_DES TESTS
APPENDIX A – JAN 23TH 2012 LEMA_DES 1:6 SCALE TESTS
7. APPENDIX B
Appendix B contains the FAS of all records obtained in the tests listed in Appendix A.
96
104
Edito dall’
Servizio Comunicazione
Lungotevere Thaon di Revel, 76 - 00196 Roma
www.enea.it
Stampa: Tecnografico ENEA - CR Frascati Pervenuto il 8.2.2013