and dreamt that life was joy. I awoke and saw that life was service. I acted and behold, service was joy (Tagore)
to my grand-parents, my family,
all my angels, for their support
This thesis is the result of an intense research activity performed at Depart-ment of Electronics, Computer Sciences and Systems (DEIS) of the University of Calabria with the support of a number of people to which I want to express my thankfulness.
My first “thank you” goes to my advisor, prof. D. Sacc`a, whose personality and deepness has always been the light to follow in this research experience, without him anything would have been the same, the lighthouse of this re-search world! Secondly I’d like to thank Elio Masciari he started to support me when I was just a student, and because of him I’m able to finish this awesome research program.
I’m also very grateful to prof. Luigi Palopoli for his careful guidance as PhD program coordinator.
Furthermore I can not forget all my friends ICAR-CNR institute, which supported me in every situation and helping to make me stronger: thanks to Gianni, Ettore, Francesco, Eugenio, Giuseppe, Agostino, Massimo, they have been so precious, and Alfredo who guided me in my first years of this PhD course.
Foremost, I owe a special thank to my mother and my father, they promote me in all situations and in every difficulties, they always encouraged me to overcome problems and sadness, making me much more motivated and enthu-siastic. Thanks to my incomparable and inimitable sister, always a true and real support for everything and to my cousin Michele, my “missing brother”; thanks to my best friends Damiano, Eliana and Serena who have been always kind and encouraging me everytime
A real thanks to all my ‘American’ friends I met at UCLA and most of all to prof. Carlo Zaniolo who made my seven months experience at Computer Science department the best I could ever had.
The latter but not the last, a special thanks to Angela, my little curly angel, who supported, tolerated and endured me with her beautiful smile and love.
1 Introduction . . . . 1
1.1 Background and Motivations . . . 1
1.2 Main Contributions of the Thesis . . . 4
1.3 Thesis Organization . . . 6
2 Querying and Answering Multidimensional Static Data . . . . 9
2.1 Introduction . . . 9
2.1.1 Storage of Data: Normalized VS Dimensional Approach 9 2.2 On Line Analytical Processing (OLAP) . . . 10
2.3 Advanced OLAP Visualization Using Hierarchies . . . 12
2.3.1 Dimension Flattening . . . 13
2.3.2 Hierarchy-Driven Compression of Two-Dimensional OLAP Views . . . 14
2.3.3 Experimental Study . . . 18
2.4 Compressing Data Cubes under Simultaneous Queries . . . 21
2.4.1 The Compression Process . . . 25
2.4.2 Experimental Results . . . 29
3 Privacy and OLAP . . . 33
3.1 Introduction . . . 33
3.2 Privacy Preserving Techniques in OLAP . . . 37
3.3 Security techniques in OLAP . . . 39
3.4 A Robust Sampling-Based Technique for Privacy Preservation in OLAP Environment . . . 40
3.4.1 Theoretical Model . . . 41
3.4.2 Computing the Privacy Preserving Synopsis Data Cube 45 3.4.3 Experimental Results . . . 48
4 A Data Stream Overview . . . 55
4.1 Data Streams: Definition and Characteristics . . . 55
4.2 Issues on Query Execution . . . 57
4.3 Continuous Queries . . . 58
4.3.1 CQ and Blocking Operators . . . 60
4.3.2 Order . . . 62
4.4 Approximate Query Answering . . . 62
4.4.1 Sliding Window . . . 62
4.4.2 Other Approximation Techniques . . . 64
4.5 Continuous Query Languages for DSMS . . . 65
4.5.1 The Power of UDAs . . . 65
4.6 Query Plan: DBMS vs DSMS . . . 66
4.7 DSMS Optimization: QoS and Scheduling . . . 67
4.7.1 Approaches for Scheduling Continuous Queries in DSMS 68 4.8 Quality of Service and Load Shedding . . . 69
4.9 Complex Event Processing (CEP) and DSMS . . . 69
4.10 DSMS Projects . . . 70
4.11 SensorGrid System . . . 72
4.11.1 Experimentation . . . 77
5 Data Stream Mining . . . 83
5.1 Introduction . . . 83
5.2 Mining Trajectories: Proposal Using Frequent Itemsets Techniques . . . 85
5.2.1 Defining Regions of Interest . . . 87
5.2.2 Principal Component Analysis . . . 87
5.2.3 The Trajectory Regioning algorithm . . . 89
5.3 Mining Frequent Pattern . . . 90
6 Pattern Queries . . . 93
6.1 Introduction . . . 93
6.1.1 Match oriented approaches . . . 94
6.1.2 Index oriented approaches . . . 95
6.2 Efficient Pattern Matching over Streams . . . 96
6.2.1 Importance of Kleene-* in continuous queries . . . 97
6.2.2 Real-world example . . . 97
6.2.3 KMP and OPT . . . 98
6.2.4 Brief overview and contributions . . . 98
6.2.5 The Problem . . . 99
6.2.6 Architecture overview . . . 101
6.2.7 Query ordering . . . 102
6.2.8 The index . . . 103
6.2.9 Query Execution Manager . . . 104
6.2.10 Indexing of Klene Closure and functions . . . 106
6.2.11 Dealing with stars . . . 107
6.2.12 Dealing with functions . . . 108
6.2.14 Experiments . . . 110
6.2.15 Effects of query strength . . . 112
7 Conclusions . . . 113
7.1 Summary . . . 113
7.2 Conclusions and Further Research . . . 114
2.1 Merging OLAP hierarchies . . . 14
2.2 Modeling Splitting Strategy . . . 15
2.3 Accuracy metrics w.r.t query selectivity . . . 20
2.4 Accuracy metrics w.r.t compression ratio . . . 20
2.5 Visualization metrics w.r.t depth of HRQ . . . 21
2.6 An example of Generalized Partition Gℓ(L) (a) and a possible corresponding Pℓ(L) (b) . . . 26
2.7 ARE vs query selectivity ∥Q∥ on the benchmark data cube TPC-H (left) and on the real-life data cube USCensus1990 (right) with r = 10% . . . 31
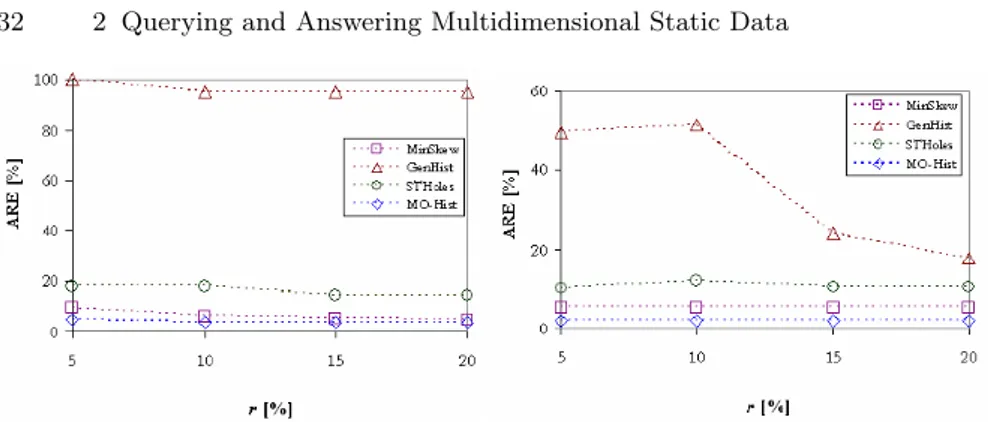
2.8 ARE vs compression ratio r on the benchmark data cube TPC-H with∥Q∥ = 750 × 700 (left) and on the real-life data cube USCensus1990 with∥Q∥ = 350 × 300 (right) . . . 32
3.1 Access control mechanism on a ROLAP data cube . . . 37
3.2 Experimental results for the privacy factor ((a) on a CVA data cube, (b) on a SKEW data cube) and the accuracy factor ((c) on a CVA data cube, (d) on a SKEW data cube) w.r.t the sparseness coefficient of synthetic data cubes . . . 51
3.3 Experimental results of the effectiveness analysis on a CVA data cube (a) and on a SKEW data cube (b) with respect to the selectivity of queries . . . 52
3.4 Experimental results of the sensitivity analysis on a CVA data cube ((a), (c), (e)) and on a SKEW data cube ((b), (d), (f)) w.r.t. the space bound . . . 53
4.1 A Sliding Window . . . 64
4.2 Query Processing in a DSMS vs DBMS . . . 67
4.3 Sensorgrid Overview . . . 73
4.4 the Aggregation Hierarchy and the Multi-level Aggregation Scheme . . . 74
4.5 the Grid Snapshot Protocol . . . 75
4.6 the Multi Resolution Data Stream Summary . . . 76
4.7 Two-dimensional representation and querying of summarized readings . . . 77
4.8 Experimental results for Window Queries . . . 80
4.9 Experimental results for Window Queries . . . 81
5.1 A set of example trajectories . . . 86
5.2 Principal eigenvalues identified by PCA . . . 88
5.3 Augmented f p− tree to support sequential patterns. . . 91
5.4 A kid database of sequence transactions. . . 92
6.1 Query evaluation . . . 100
6.2 System Architecture . . . 102
6.3 Workflow of the execution manager . . . 104
6.4 Optimal Search for K (32K Queries) . . . 106
6.5 Hash VS index graph showing costs according to different hashes107 6.6 Regular Expression Permutation . . . 107
6.7 Indexing speed and Kleene closure . . . 108
6.8 Memory usage of Kleene closure . . . 109
4.1 Main differences between DBMS and DSMS . . . 57 6.1 Typical query on which it is possible to run experiments . . . 111 6.2 Parameters for synthetic query generation . . . 112
Introduction
1.1 Background and Motivations
How can a manager get out of a data-flooded mire? How can a confused decision maker navigate through a maze? How can an over-bursty stream of data be queried? How can is possible to better show data in a mess cuboid? How can the best moment to invest be found in the Stock Market trends?
The answer to all of these is challenging, last years saw many contribu-tions from many research groups, trying to find the best way to manage huge amount of data, in all scenarios real life can avoid. Data management sys-tems are becoming every day critical for companies and most of them trust innovative techniques to support decision in their business processes.
Decision making support frameworks and all related technologies innova-tive strategies are rising up introducing improvement and efficiency in query-ing, analysing and extracting information from data. All of these improve-ments are providing great perspectives to marketing research initiatives and investigations, network data storage management, massive data querying ca-pabilities and knowledge retrieval from huge amount of raw data.
All these techniques are able to turn data into money; transform informa-tion into intelligence; change patterns into profit; and convert relainforma-tionships into resources. To obtain knowledge, one must understand the patterns that emerge from information. Patterns are not just simple relationships among data; they exist separately from information, as archetypes or standards to which emerging information can be compared so that one may draw inferences and take action. Over the last 40 years, the tools and techniques used to pro-cess data and information have continued to evolve from databases (DBs) to data warehousing (DW), to Data Mining. DW applications, as a result, have become business-critical and can deliver even more value from these huge repositories of data.
Although technologies are deeply widespread in many economical and so-cial environment, considerable differences related to ‘how ’ to manage poten-tially unbounded data when they arrive with a very high rate with respect to
the processing capabilities of system, and the storage space is always limited. It is clear that systems which deal with bursty data need to take into account policies to process incoming data very fast and if needed to shed load when it is too much to be processed. It is straightforward at this point that it is possible to identify two main areas strictly related one another, which try to study new aspects, technologies, algorithms when manipulating static data -data that reside in a classical Database Management System (DBMS) / Data Warehouse (DW) - and dynamic data which are characterized by data streams which need to be processed.
These two areas received and receive today as well, great attention from research groups. The basic issue related to these two areas is that techniques to process and analyse static data using classic DBMS and DW systems, might not be applied to do the same kind of job considering data streams. The main motivation is that data streams are not bounded - information flood can be infinite - therefore it is not possible to store such kind of data in a classical DBMS which has a finite - even if large - storage capacity. Moreover data streams are often generated in sensor networks which are usually involved for monitoring activities, i.e. in geographical areas, network traffic, trend analysis etc.
Starting from these assumptions the problem of provide efficiently answers to queries which involve massive data, in case of static and dynamic data is challenging, and as stated above, techniques are reasonably different.
Static data are often analysed i.e. when a company (or corporation) needs to provide a realistic evaluation of the next marketing plan, to extract knowl-edge from them, perform data mining processes like classification, when a support to decision making process is needed.
The latter case is one of the most interesting aspects and it is usually performed adopting the well-known-in-literature on line analysis techniques, also known as On Line Analytical Process (OLAP). OLAP analysis is very efficient particularly when it is needed to process hierarchical data - i.e. date (day-month-year), job position (simple employer - project manager - area manager etc.) - and aggregate ones (i.e. querying using aggregate operators like SUM, AVG, etc), because it provides operators which are particularly efficient to change data visualization in such a way as searched information is much easier to get. About OLAP systems there are some interesting aspects to be considered, like the querying problem, related to how much the answer approximation has to deal with exactness, if time constraints are hard; the way how data are represented and processed and above all how to represent data inside OLAP systems. The last cited point is very challenging and tricky but at the same time it adds great value to decision making support frameworks, in fact it is much easier to analyse data when they are better shown to the user (or application). Also data compression can provide great improvements in query answering process time execution, in fact it is possible to consider different policies that show recent data or data with certain characteristics in order to meet application requirements.
Strictly connected with these aspects, OLAP systems are very critical in privacy issues management. Many literature works have shown that malicious users can easily get sensible information from the datacube exploiting OLAP operators in manipulating data visualization. To this end, techniques aim-ing to protect sensitive information have been proposed and many of them exploit different aspects related to privacy preservation in OLAP and Data Warehousing in general.
It is clear that static data needs to be managed trying to improve perfor-mances in query answering, when queries involve huge amount of data and/or query complexity need too much calculate power to be performed.
Recently researchers are trying to apply benefits of multidimensional anal-ysis of static data to systems dealing with dynamic ones, which have however a considerably different kind of architecture. As already said above, a new class of applications has emerged that requires managing data streams, i.e., data composed of continuous, real-time sequence of items. Moreover, database management systems were originally developed to support business applica-tions. The data in such applications is changed as a result of human-initiated transactions. Similarly data is queried as a result of human-initiated queries. The database management system acts as a passive repository for the data, executing the queries and transactions when these are submitted. However, this model of a database management system as a repository of relatively static data that is queried as a result of human interaction, does not meet the challenges posed by streaming applications.
A data stream is a possibly unbounded sequence of data items. Streaming applications have gained prominence due to both technical and business rea-sons. Technologically data is now available from a wide variety of monitoring devices, including sensors that are extremely cheap. Data from such devices is potentially unbounded and needs to be processed in real-time.
Streaming applications pose new and interesting challenges for data man-agement systems. Such application domains require queries to be evaluated continuously as opposed to the one time evaluation of a query for traditional applications.
Streaming data sets grow continuously and queries must be evaluated on such unbounded data sets. The monitoring aspect of many streaming appli-cations requires support for reactive capabilities in real-time from data man-agement systems. These, as well as other challenges, require a major rethink of almost all aspects of traditional database management systems to support streaming applications.
Key themes are related to compression of data, i.e. “ancient” data could be less important than “newer” ones, and therefore the challenging trade off between accuracy and exactness in answering queries.
In sum , the motivation of the thesis is to investigate the problem of provid-ing effective support to handlprovid-ing huge amount of data and enablprovid-ing spreadprovid-ing share and delivery of contents. To achieve this ambitious goal, different is-sues must to be dealt with such as: methods and algorithms to aggregate
raw data using lossy compression (size resilience), amenities to disseminate information by removing privacy concerns in information exchange (privacy resilience), and tools for managing data streams (dynamicity resilience). The thesis does not offer a unified framework to the problem, for a solution is too far to be achieved; it rather gives insights on how to proceed toward such a solution and put some lights to all facets of the problem, by presenting novel results on each of them, which are relevant ”per se” and may eventually represent a step forward a more comprehensive ways to manage continuous streams of large amount of data.
1.2 Main Contributions of the Thesis
This thesis is focused on management of data considering both the case of static and dynamic data. It proposes a number of novel contributions aiming at easing query optimization in the fields of OLAP data compression and privacy preservation, and approximate query answering in data streams, also in case of queries defined using a pattern syntax.
OLAP systems have been deeply investigated and analysed with partic-ular regard to techniques related to intelligent and efficient compression and visualization techniques, in order to perform querying process with great per-formances. In the first case it has been proposed a novel top-down compression technique for data cubes, which takes into account the case in which multi-ple Hierarchical Range Queries (HRQ), a very useful class of OLAP queries, must be evaluated against the target data cube simultaneously. As result of the study, an innovative multiple-objective OLAP computational paradigm, and a hierarchical multidimensional histogram, has been shown, whose main benefit is meaningfully implementing an intermediate compression of the in-put data cube able to simultaneously accommodate an even large family of different-in-nature HRQ.
Another very interesting aspect has been taken in consideration, in the same area, it is a semantics-driven compression technique for efficiently sup-porting advanced OLAP visualization of multidimensional data cubes. One of the main contribution this thesis present consists in the amenity of using the data compression paradigm as a way of visualizing multidimensional OLAP domains, in order to overcome the natural disorientation and refractoriness of human beings in dealing with hyper-spaces. Experimental results conducted on several kind of synthetic data sets clearly confirm the effectiveness and the efficiency of this technique, also in comparison with state-of-the-art proposals. As stated above, OLAP systems are very vulnerable if they contain sensi-ble information. Literature proposed many works on this, and here it is pre-sented a robust sampling-based framework for privacy preserving OLAP. The most distinctive characteristic of the proposed framework consists in adopt-ing an innovative privacy OLAP notion, which deals with the problem of preserving the privacy of OLAP aggregations rather than the one of data
cube cells, like in conventional perturbation-based privacy preserving OLAP techniques. This results in a greater theoretical soundness, and lower com-putational overheads due to processing massive-in-size data cubes. Also, per-formances of this privacy preserving OLAP technique is compared with the one of the method Zero-Sum[SLXN06], the state-of-the-art privacy preserving OLAP perturbation-based technique, under several perspectives of analysis. The derived experimental results confirm to us the benefits deriving from adopting our proposed framework for the goal of preserving the privacy of OLAP data cubes.
In Data Stream Management Systems (DSMS) it is not possible to manage data using classical DBMS techniques, because of space bounds and incoming data rate which can be very high. To this end, DSMS introduces new policies and compression approaches which characterizes the whole system architec-tures. In this thesis is presented the system SensorGrid [CFMS04], a Grid-based sensor network data warehouse, which encompasses several metaphors of data compression/approximation and high performance and high reliabil-ity computing that are typical of Grid architectures. Experimentation focuses on two main classes of aggregate range queries over sensor readings, namely (i) the window queries, which apply a SQL aggregation operator over a fixed window over the reading stream produced by the sensor network, and (ii) the continuous queries, which instead consider a “moving” window, and pro-duce as output a stream of answers. Both classes of queries are extremely useful to extract summarized knowledge to be exploited by OLAP-like anal-ysis tools over sensor network data. The experimental results, conducted on several synthetic data sets, clearly confirm the benefits deriving from embed-ding the data compression/approximation paradigm into Grid-based sensor network data warehouses.
The querying process in DSMS needs to be very fast and concrete, as already said, in order to provide answers as soon as possible. In many cases queries might not have the classical SQL form, but used languages borrow main constructs and syntax. A very exciting field, still not analysed enough is strictly related to optimization of queries execution when using Kleene closure operator. In this case literature does not provide many techniques able to deal with Kleene-* operator, except for [SZZA01a], but it can be sensibly improved with respect to scalability in case of many complex queries at a time. The problem has been centered on designing a framework to efficiently evaluate patterns queries containing general predicate, Kleene closure and predicate functions.
Complex patterns queries involving Kleene closure are finding applications in many areas including financial services, healthcare monitoring, RFID-based inventory management etc.
Many continual predicate queries can be issued against a rapid and bursty data stream. Furthermore query predicates may be comprised of Kleene clo-sure or predicate functions. Previous approaches involving query indexing
techniques are not scalable in this environment, therefore to efficiently evalu-ate continual queries a new framework is required to address these issues.
The proposed framework has been is a hybrid method that uses indexing and string matching techniques to provide high performance pattern match-ing over streams (HPSM) involvmatch-ing general predicates, Kleene closure and functions. While indexing of patterns involving general predicates was well studied, indexing of Kleene closure and functional patterns over streams have unique issues regarding scalability in both performance and size of the in-dex. All these issues are explained in a context of thousands of continuous queries. In particular, such a hybrid framework provides a scalable solution to a pattern matching problem and describe support for indexing functional patterns.
The main literature works chosen to compare against are the one on the YFilter (see [yfi02]) and Suffix Tree (see [McC76]) approaches. In both cases raw experimentation seems to show that the proposed approach significantly outperforms the existing ones in terms of both storage and time. However this is still an on-going work, therefore all motivations justifying experimentation will be better presented in 7.
1.3 Thesis Organization
The reminder of this thesis is structured as follows.
Chapter 2 presents an overview of data warehouse and OLAP systems. In particular it focus on data representation and compression in OLAP, explain-ing with the right theoretical details all advantages in usexplain-ing such techniques. Better data visualization helps user/application to easier retrieve knowledge and make querying process faster. Data compression in OLAP datacube is a pretty straightforward techniques that allows to consider multiple aggregate levels in order to quickly obtain approximated query answers keeping a very high accuracy level.
Chapter 3 is centred on security and privacy preservation techniques in OLAP systems. They become very important since malicious users can use statistical inference to get sensitive information from the system. Literature proposed technique are focusing many aspects and it is also explained a new technique which introduce a new privacy OLAP definition, based on aggre-gates and compares experimental result one of the most famous literature work from prof. Ng.
Chapter 4 presents a detailed overview on data stream systems and their main features. It deeply analyse motivations and differences against classical DBMS. Many existing DSMSs provide nice features and challenging goals, trying to enrich the system with functionalities. To this end it describes a DSMS system (SensorGrid )and its architecture and shows experimental eval-uation of its performances with many different parameters over synthetic and real data sets.
Chapter 5 introduces actual works on a particular aspect of the wide stream mining field: the frequent trajctory mining. It proposes a technique that will be better extended to support ordering in frequent patterns research in data stream itemsets.
Chapter 6 deals with the open problem of Kleene closure operator in pat-tern queries when considering data streams. In this case it is to be hoped that if a multiquery environment is set, then an optimized scheduling pre-processing phase would improve performances and the speed in getting the right answer from all pattern queries.
Finally Chapter 7 draws some conclusions and highlights some still open issues that are worth considering in further investigation.
Querying and Answering Multidimensional
Static Data
2.1 Introduction
When companies are dealing with huge amounts of data, often they need to consider technologies that allow to efficiently manage them, providing fast answer and when it is needed the maximum accuracy possible. Most of these technologies are strictly related to the datawarehousing area and therefore all aspects concerning decision support, efficient query answers have to be taken into consideration, mainly when data are static, that basically means that they are relying on large storage devices and they do not change within small amount of time.
There are many meanings stating what a data warehouse is and what are its main functions and characteristics. From a certain point of view we can assert a data warehouse is a repository of an organization’s electronically stored data and it is usually designed to facilitate reporting and analysis. More technically, a data warehouse houses a standardized, consistent, clean and integrated form of data sourced from various operational systems in use in the organization, structured in a way to specifically address the reporting and analytic requirements.
This definition of the data warehouse focuses on data storage. However, the means to retrieve and analyze data, to extract, transform and load data, and to manage the data dictionary are also considered essential components of a data warehousing system. Many references to data warehousing use this broader context. Thus, an expanded definition for data warehousing includes business intelligence tools, tools to extract, transform, and load data into the repository, and tools to manage and retrieve metadata.
2.1.1 Storage of Data: Normalized VS Dimensional Approach There are two leading approaches to storing data in a data warehouse - the dimensional approach and the normalized approach.
In the dimensional approach, transaction data are partitioned into either facts, which are generally numeric transaction data, or dimensions, which are the reference information that gives context to the facts. For example, a sales transaction can be broken up into facts such as the number of products ordered and the price paid for the products, and into dimensions such as order date, customer name, product number, order ship-to and bill-to locations, and salesperson responsible for receiving the order. A key advantage of a dimensional approach is that the data warehouse is easier for the user to understand and to use. Also, the retrieval of data from the data warehouse tends to operate very quickly.
The main disadvantages of the dimensional approach are: 1) In order to maintain the integrity of facts and dimensions, loading the data warehouse with data from different operational systems is complicated, and 2) It is diffi-cult to modify the data warehouse structure if the organization adopting the dimensional approach changes the way in which it does business.
In the normalized approach, the data in the data warehouse are stored fol-lowing, to a degree, database normalization rules. Tables are grouped together by subject areas that reflect general data categories (e.g., data on customers, products, finance, etc.) The main advantage of this approach is that it is straightforward to add information into the database. A disadvantage of this approach is that, because of the number of tables involved, it can be difficult for users both to 1) join data from different sources into meaningful informa-tion and then 2) access the informainforma-tion without a precise understanding of the sources of data and of the data structure of the data warehouse.
These approaches are not mutually exclusive, and of course there are other approaches. Dimensional approaches can involve normalizing data to a degree. Data warehouses are optimized for speed of data retrieval. Frequently data in data warehouses are denormalised via a dimension-based model. Also, to speed data retrieval, data warehouse data are often stored multiple times -in their most granular form and -in summarized forms called aggregates. Data warehouse data are gathered from the operational systems and held in the data warehouse even after the data has been purged from the operational systems.
2.2 On Line Analytical Processing (OLAP)
One of the most important technique to retrieve efficiently data providing good support to business intelligence is the On Line Analytical Process-ing (OLAP). It is an approach to quickly answer multi-dimensional ana-lytical queries. The typical applications of OLAP are in business reporting for sales, marketing, management reporting, business process management (BPM), budgeting and forecasting, financial reporting and similar areas. The term OLAP was created as a slight modification of the traditional database term OLTP (Online Transaction Processing).
Databases configured for OLAP use a multidimensional data model, al-lowing for complex analytical and ad-hoc queries with a rapid execution time. They borrow aspects of navigational databases and hierarchical databases that are faster than relational databases.
The output of an OLAP query is typically displayed in a matrix (or pivot) format. The dimensions form the rows and columns of the matrix; the mea-sures form the values.
At the core of any OLAP system is the concept of an OLAP cube (also called a multidimensional cube or a hypercube). It consists of numeric facts called measures which are categorized by dimensions. The cube metadata is typically created from a star schema or snowflake schema of tables in a relational database. Measures are derived from the records in the fact table and dimensions are derived from the dimension tables.
Each measure can be thought of as having a set of labels, or meta-data associated with it. A dimension is what describes these labels; it provides information about the measure.
A simple example would be a cube that contains a store’s sales as a mea-sure, and Date/Time as a dimension. Each Sale has a Date/Time label that describes more about that sale.
Any number of dimensions can be added to the structure such as Store, Cashier, or Customer by adding a column to the fact table. This allows an analyst to view the measures along any combination of the dimensions.
Three relevant challenges of OLAP systems [CD97, GCB+97] have
cap-tured a lot of attention during the last years: (i) the data querying problem, which concerns with how data are accessed and queried to support summa-rized knowledge extraction from massive data cubes; (ii) the data modeling problem, which concerns with how data are represented and, thus, processed inside OLAP servers (e.g., during query evaluation); (iii) the data visualiza-tion problem, which concerns with how data are presented to OLAP users and decision makers in Data Warehouse environments. Indeed, research communi-ties have mainly studied and investigated the first two problems, whereas the last one, even if important-with-practical-applications, has been very often neglected.
Approximate Query Answering (AQA) techniques address the first chal-lenge, and can be reasonably considered as one of the most important topics in OLAP research. The main proposal of AQA techniques consists in provid-ing approximate answers to resource-consumprovid-ing OLAP queries (e.g., range-queries) instead of computing exact answers, as decimal precision is usually negligible in OLAP query and report activities. Due to a relevant interest from the Data Warehousing research community, AQA techniques have been intensively investigated during the last years, also achieving important results. Among the others, histograms (e.g., [APR99a, BCG01, GKTD00a]), wavelets ([VWI98]), and sampling (e.g., [GM98]) are the most successful techniques, and they have also inducted several applications in even different contexts than OLAP. Conceptual data models for OLAP are widely recognized as based on
data cube concepts like dimension, hierarchy, level, member, and measure, first introduced by Gray et al. [GCB+97], which inspired various models for
multidimensional databases and data cubes (e.g., [HS98, Vas98]). Neverthe-less, despite this effort, recently, several papers have put in evidence some formal limitations of accepted conceptual models for OLAP (e.g., [CT98]), or theoretical failures of popular data cube operations, like aggregation func-tions. Contrarily to data querying and modeling issues, since data presentation models do not properly belong to the well-founded conceptual-logical-physical hierarchy for relational database models (which has also been inherited from multidimensional models), the problem of OLAP data visualization has been studied and investigated only so far (e.g., [GJJ97, MVSV03]). On the other hand, being essentially OLAP a technology to support decision making, thus based on (sensitive) information exploration and browsing, it is easy to un-derstand that, in future years, tools for advanced visualization of multidimen-sional data cubes will rapidly conquest the OLAP research scene.
2.3 Advanced OLAP Visualization Using Hierarchies
Starting from the fundamentals of data cube compression and OLAP data visualization research issues, it is possible to meaningfully exploit the main results coming from the first one and the goals of the second one in a combined manner, and obtaining a novel technique for supporting advanced OLAP vi-sualization of multidimensional data cubes. The basic motivation of such an approach is realizing that (i) compressing data is an (efficient) way of visual-izing data, and (ii) this intuition is well-founded at large (i.e., for any data-intensive system relying on massive data repositories), and, more specifically, it is particularly targeted to the OLAP context where accessing multidimen-sional data cubes can become a realistic bottleneck for Data Warehousing systems and applications. Briefly, it is possible to distinguish two steps. The first one consists in generating a two-dimensional OLAP view D from the input multidimensional data cube A by means of an innovative approach that allows us to flatten OLAP dimensions (of A), and, as a consequence, effectively support exploration and browsing activities against A (via D), by overcoming the natural disorientation and refractoriness of human beings in dealing with hyper-spaces.
Particularly, the (two) OLAP dimensions on which D is defined are built from the dimensions of A according to the analysis goals of the target OLAP user/application. The second step consists in generating a bucket-based com-pressed representation of D named as Hierarchy-driven Indexed Quad-Tree Summary (H-IQTS), and denoted by H-IQTS(D), which meaningfully ex-tends the compression technique for two-dimensional summary data domains presented in [BFSS03], by introducing the amenity of generating semantics-aware buckets, i.e. buckets that follow groups of the OLAP hierarchies of D. In other words, OLAP hierarchies defined on the dimensions of D are used to
drive the compression process. The latter step allows us to achieve space effi-ciency, while, at the same time, supporting approximate query answering and advanced OLAP visualization features. Similarly to [BFSS03], H-IQTS(D) is shaped as a quad-tree (thus, each internal bucket in H-IQTS(D) has four child sub-buckets), and the information stored in its buckets is still the sum of the items contained within them.
Given an OLAP dimension di, and its domain of members Ψ (di), each
of them denoted by ρj, a hierarchy defined on di, denoted by H(di), can be
represented as a general tree (i.e., such that each node of the tree has a number N ≥ 0 of child nodes) built on top of Ψ(di). H(di) is usually built according
to a bottom-up strategy by (i) setting as leaf nodes of H(di) members in
Ψ (di), and (ii) iteratively aggregating sets of members in Ψ (di) to obtain other
(internal) members, each of them denoted by σj, (the latter are internal nodes
in H(di)). In turn, internal members in H(di) can be further aggregated to
form other super-members until a unique aggregation of members is obtained; the latter corresponds to the root node of H(di), and it is known-in-literature
as the aggregation ALL. Each member in H(di) is characterized by a level
(of the hierarchy), denoted by Lj; as a consequence, we can define a level
Lj in H(di) as a collection of members. For each level Lj, the ordering of
Lj, denoted by O(Lj), is the one exposed by the OLAP server platform for
the target data cube on which H(di) is defined. Given a multidimensional data cube A such that Dim(A) = d0, d1, dn−1 is the set of dimensions of
A and Hie(A) ={H(d0), H(d1),· · · , H(dn−1)} the set of hierarchies defined
on A, the collection of members σj at the level Lj ≥ 0 (note that, when
Lj = 0, σj ≡ ρj) of each hierarchy H(di) in Hie(A) univocally refers, in
a multidimensional fashion, a certain (OLAP) data cell Cp in A at level Lj
(in other words, Cp is the OLAP aggregation of data cells in A at level Lj).
Such collection is named as j-level OLAP Metadata (for Cp), and denoted as
J− M(Cp).
Given a member σj at level Lj of H(di) and the set of its child nodes
Child(σj), which are members at level Lj+1, we define as the Left Boundary
Member (LBM) of σj the child node of σj in Child(σj) that is the first in
the ordering O(Lj+1). Analogously, we define as the Right Boundary Member
(RBM) of σj the child node of σj in Child(σj) that is the last in the ordering
O(Lj+1).
2.3.1 Dimension Flattening
The OLAP dimension flattening process is the first step for supporting ad-vanced OLAP visualization of multidimensional data cubes. In more detail, dimensions of the input multidimensional data cube A can be flatten into two specialized dimensions called Visualization Dimensions (VDs). VDs sup-port advanced OLAP visualization of A via constructing an ad-hoc two-dimensional OLAP view D defined just on VDs.
Fig. 2.1. Merging OLAP hierarchies
The process that allows to obtain the two V Ds from the dimensions of A works as follows. Letting Dim(A) and Hie(A) be the set of dimensions and the set of hierarchies of A, respectively, each V D is a tuple vi =⟨di, H∗(di)⟩ such
that (i) diis the dimension selected by the target OLAP user/application, (ii)
H∗(di) is a hierarchy built from meaningfully merging the original hierarchy
H(di) of di with the hierarchies of other dimensions in A according to an
ordered definition set
M D(vi) ={⟨HLi, dj, P j⟩, ⟨HLj, dj+1, Pj+1⟩, · · · , ⟨HLj+K−1, dj+K, Pj+K⟩}
where K =|MD(vi)| − 1. More in detail, for each pair of consecutive tuples
⟨⟨HLj, dj+1, Pj+1⟩, ⟨HLj+1, dj+2, Pj+2⟩⟩ in MD(vi) the subtree of H(dj+2)
rooted in the root node of H(dj+2) and having depth equal to Pj+2, denoted
by HPj+2
S (dj+2) , is merged to H(dj+1) by appending a clone of it to each
member σj+1 at level HLj+1, named as hooking level, in H(dj+1). From the
described approach, it follows that: (i) the ordering of items in M D(vi) defines
the way of building H∗(di); (ii) the first hierarchy to be processed is just
H(di). As an example of the flattening process of two OLAP dimensions into
a new one, consider 2.1 where the hierarchy H∗(dj) is obtained by merging
H(dj+1) to H(dj) via setting Pj+1= 1 and HLj= 1.
2.3.2 Hierarchy-Driven Compression of Two-Dimensional OLAP Views
Compressing the two-dimensional OLAP view D (extracted from A according to the OLAP dimension flattening process presented in 2.3.1) is the second step of our proposed technique.
Given D, for each step j of our compression algorithm, we need to 1. greedily select the leaf bucket b of H− IQT S(D) having maximum Sum
of the Squared Errors (SSE) [BFSS03],
2. split b in four sub-buckets through investigating, for each dimension dk of
D, levels of the hierarchy H(dk).
Formally, given the current bucket bj = D[lj,0 : uj,0][lj,1 : uj,1] to be split
of bj on the dimension dk of D, the problem is finding, for each dimension
dk of D, a splitting position Sj,k belonging to [lj,k : uj,k]. To this end, for
each dimension dk of D, our splitting strategy aims at (i) grouping items into
buckets related to the same semantic domain, and (ii) maintaining as more balanced as possible the hierarchy H(dk).
For the sake of simplicity, let us consider the hierarchy-driven compression algorithm for two-dimensional OLAP views through showing how to handle the hierarchy of an OLAP dimension dk (i.e., how to determine a splitting
position Sj,kon dk). Obviously, this technique must be performed for both the
dimensions of the target (two-dimensional) OLAP view D, thus obtaining, for each pair of splits at step j (i.e., Sj,0 and Sj,1), four two-dimensional buckets
to be added to the current partition of D.
Fig. 2.2. Modeling Splitting Strategy
Let bj = D[lj,0: uj,0][lj,1: uj,1] be the current bucket to be split at step j.
Consider the range [lj,k: uj,k] of bj on the dimension dk of D. To determine
Sj,kon [lj,k: uj,k], we denote as Tj,k(lj,k: uj,k) the sub-tree of H(dk) whose (i)
leaf nodes are the members of the sets 0− M(Cw) defined on data cells Cwin
D[lj,k: uj,k] (i.e., the one-dimensional bucket obtained by projecting bj with
respect to the dimension dk), and (ii) the root node is the (singleton) member
of the set P k− M(Cr) defined on the data cell Cr that is the (singleton)
aggregation of D[lj,k : uj,k] at level LP of H(dk), being Pk the depth of
H(dk) (and also the depth of Tj,k(lj,k : uj,k)). To give an example, consider
2.2, where the one-dimensional OLAP view Dk= D[0 :|dk| − 1], obtained by
projecting D with respect to the dimension dk, along with the hierarchy H(dk)
are depicted. As shown in 2.2, the tree T0, properly denoted by Tj,k(0 : 17),
whole H(dk). At step j, dk is split in the position Sj,k= 11, thus generating
the buckets D[0 : 11] and D[12 : 17]. In consequence of this, the tree T 1, properly denoted by Tj+1,k(0 : 11), is related to D[0 : 11], whereas the tree
T 2, properly denoted by Tj+1,k(12 : 17), is related to D[12 : 17].
Formally, let (i) dk be the dimension of D to be processed; (ii) H(dk) the
hierarchy defined on dk; (iii) bj = D[lj,k: uj,k] the current (one-dimensional)
bucket to be split at step j of our algorithm; (iv) Tj,k(lj,k : uj,k) the tree
related to bj. In order to select the splitting position Sj,kon [lj,k: uj,k], letting
T1
j,k(lj,k: uj,k) be the second level of Tj,k(lj,k: uj,k), we initially consider the
data cell Ck in D[lj,k : uj,k] whose indexer is in the middle of D[lj,k : uj,k],
denoted by Xj,D= ⌊ 1 2· |D[lj,k: uj,k]| ⌋
It should be noted that processing the second level of Tj,k(lj,k : uj,k) (i.e.,
Tj,k(lj,k : uj,k)) derives from the use of the aggregation ALL in OLAP
con-ceptual models, which, in total, introduces an additional level in the general tree modeling an OLAP hierarchy.
Then, starting from ρk, being ρk the member in the set 0− M(Ck), we
go up on H(dk) until the parent of ρk at the level Tj,k1 (lj,k: uj,k), denoted by
σk, is reached, Sj,kis determined on the basis of the nature of σk. If σk is the
LBM of the root node of Tj,k(lj,k: uj,k) denoted by Rj,k, then
Sj,k= ⌊ 1 2 · |D[lj,k: uj,k]| ⌋ − 1
and, as a consequence, the following two (one-dimensional) buckets as child buckets of bj are obtained:
b′j+1= D [ lj,k: ⌊ 1 2· |D[lj,k: uj,k]| ⌋ − 1 ] b′′j+1= D [⌊ 1 2 · |D[lj,k: uj,k]| ⌋ : uj,k ]
Otherwise if σk is the RBM of Rj,k, then
Sj,k= ⌊ 1 2 · |D[lj,k: uj,k]| ⌋ and as a consequence b′j+1= D [ lj,k: ⌊ 1 2· |D[lj,k: uj,k]| ⌋] b′′j+1= D [⌊ 1 2 · |D[lj,k: uj,k]| ⌋ + 1 : uj,k ]
Finally, if σk is different from both the LBM and the RBM of Rj,k, i.e. it
follows the LBM of Rj,k in the ordering O(Tj,k1 (lj,k: uj,k)) and precedes the
RBM of Rj,k, then it can be performed a finite number of shift operations on
the indexers of D[lj,k: uj,k] starting from the middle indexer Xj,Dand within
the range Γj,k= ⌊ Γlo j,k: Γ up j,k ⌋ , such that Γj,klo = ⌊ 1 2 · |D[lj,k: uj,k]| ⌋ − ⌊ 1 3 · |D[lj,k: uj,k]| ⌋ Γj,kup= ⌊ 1 2 · |D[lj,k: uj,k]| ⌋ + ⌊ 1 3 · |D[lj,k: uj,k]| ⌋
until a data cell Vk in D[lj,k : uj,k]] such that the corresponding member σk
at the level T1
j,k(lj,k: uj,k) is the LBM or the RBM of Rj,k, if exists, is found.
It should be noted that admitting the specified maximum offset
maxOf f set =± ⌊ 1 3· D k[l j,k: uj,k] ⌋
with respect to the middle of the current bucket is coherent with the aim of maintaining as more balanced as possible the hierarchy H(dk), which allows
to take advantages from the above-highlighted benefits.
To this end, starting from the middle of Γj,k (which is equal to the one of
D[lj,k : uj,k], Xj,D), it is possible to iteratively consider indexers Ij,q within j,k on the basis of the following function:
Ij,q ={Xj,Dif q = 0; Ij,q−1+ (−1)q· qifq > 1}
. If such data cell Vk exists, then Sj,k is set as equal to the so-determined
indexer Ij,q∗ , and, as a consequence, the pairs of buckets are: bj+1= D ⌊ lj,k: Ij,q∗ 1 ⌋ b′j+1= D ⌊ Ij,q∗ : uj,k ⌋
if Ij,q∗ is the LBM of Rj,k, or, alternatively, the pairs of buckets area
bj+1= D ⌊ lj,k: Ij,q∗ ⌋ b′j+1= D ⌊ Ij,q∗ + 1 : uj,k ⌋ if Ij,q∗ is the RBM of Rj,k.
On the contrary, if such data cell Vk does not exist, then no split can be
performed on D[lj,k : uj,k], and the splitting is remanded at the next step of
the algorithm (i.e., j + 1) where the splitting position Sj+1,k is determined
by processing the third level Tj+1,k2 (lj+1,k: uj+1,k) of the tree Tj+1,k(lj+1,k:
uj+1,k) (i.e., by decreasing the aggregation level of OLAP data with respect
cell Vk verifying the above condition is found; otherwise, if the leaf level of Tj,k(lj,k: uj,k)) is reached without finding any admissible splitting point, then
D[lj,k: uj,k] is added to the current partition of the OLAP view without being
split. This way to do still pursues the aim of obtaining balanced partitions of the input OLAP view.
2.3.3 Experimental Study
It is possible to consider two kinds of experiments. The first one is oriented to probe the data cube compression performance (or, equally, the accuracy) of our technique, whereas the second one is instead oriented to probe the vi-sualization capabilities of this technique in meaningfully supporting advanced OLAP visualization of multidimensional data cubes.
As regards the data layer of our experimental framework, engineered two kinds of synthetic two-dimensional OLAP views (which, in turn, have been extracted from synthetic multidimensional data cubes via a random flattening process): (i) the view DC(L1, L2), for which data are uniformly distributed
on a given range [L1, L2] (i.e., the well-known Continuous Values
Assump-tion (CVA) holds), and (ii) the view DZ(zmin, zmax), for which data are
distributed according to a Zipf distribution whose parameter z is randomly chosen on a given range [zmin, zmax].
For the first kind of experiments (i.e., that focused on the accuracy), given a population of synthetic range-SUM queries QS, we measure the Average
Relative Error (ARE) between exact and approximate answers to queries in QS, i.e.: Erel = 1 |QS|· |Q|−1∑ k=0 Erel(Qk)
such that for each query Qk in QS:
Erel(Qk) =
|A(Qk)− ˜A(Qk)|
A(Qk)
where (i) A(Qk) is the exact answer to Qk, and (ii) ˜A(Qk) is the approximate
answer to Qk. Particularly, fixing a range sizes ∆k for each dimension dkof the
target synthetic OLAP view D, we generate queries in QS through spanning
D by means of the seed ∆0× ∆ℓquery Qs.
For the second kind of experiments, inspiration comes from the Hierarchi-cal Range Queries (HRQ) introduced by Koudas et al. in [KMS00]. A HRQ QH(WH, PH) can be considered as a full tree such that: (i) the depth of such
tree is equal to PH; (ii) each internal node Ni has a fan-out degree equal
to WH; (iii) each node Ni stores the definition of a (traditional) range-SUM
query Qi; (iv) for each node Ni in QH(WH, PH), there not exists any sibling
node Nj of Ni such that Qi∩ Qj <>∅. Similarly to the previous kind of
to be used as input query set was generated by means of the above-described spanning technique. It should be noted that, due the nature of HRQs, the selectivity of seed queries Qs
i,k of nodes Ni at level k of QH(WH, PH) must
decreases as the depth Pk of QH(WH, PH) increases.
In consequence of this, letting γ be an input parameter and∥D∥ the selec-tivity of the target OLAP view D, it is possible to impose that the selecselec-tivity of the seed query of the root node N0in QH(WH, PH), denoted by∥Qs0,0∥ , is
equal to the γ% of∥D∥, and then, for each internal node Niin QH(WH, PH) at
level k, the seed queries of the child nodes of Ni can be randomly determined by checking the following constraint:
|(Wf f∑)k+1|−1 i=0 ∥Qs i,k+1∥ ≤ ∥Q s i,k∥Q s i,k+1∪ Q s j,k+1 =∅
for each i and j in [0,|(WH)k+1|1] , with i <> j, and adopting the criterion
of maximizing each∥Qs i,k∥.
Given a HRB QH(WH, PH), it is interesting to measure the Average
Ac-cessed Bucket Number (AABN), which models the average number of buckets accessed during the evaluation of QH(WH, PH), and it is defined as follows:
AABN (QH(WH, PH)) = PH ∑ k=0 1 (WH)k · |(Wf f∑)k|−1 l=0 AABN (Nℓ)
where, in turn, AABN (Nℓ) is the average number of buckets accessed
dur-ing the evaluation of the population of queries QS,l of the node Nℓ in
QH(WH, PH), i.e. AABN (Nℓ) = 1 |QS,l|· |Q∑S,l|−1 k=0 ABN (Qk)
each query Qk in QS,l, ABN (Qk) is the number of buckets accessed during
the evaluation of Qk. Summarizing, given a compression technique T, AABN
allows to measure the capabilities of T in supporting advanced OLAP visu-alization of multidimensional data cubes as the number of buckets accessed can be reasonably considered as a measure of the computational cost needed to extract summarized knowledge, as a sort of measure of the entropy of the overall knowledge extraction process.
Experimental study, compares performances against the following well-known histogram-based techniques for compressing data cubes: MinSkew by Acharya et al. [APR99b], GenHist by Gunopulos et al. [GKTD00b], and STHoles by Bruno et al. [BCG01]. More in detail, having fixed the space budget G (i.e., the storage space available for housing the compressed repre-sentation of the input OLAP view), we derived, for each comparison technique, the configuration of the input parameters that the respective authors consider
Fig. 2.3. Accuracy metrics w.r.t query selectivity
the best in their papers. This ensures a fair experimental analysis, i.e. an anal-ysis such that each comparison technique provides its best performance.
2.3 shows experimental results for what regards the accuracy of the com-pression techniques w. r. t. the selectivity of queries in QS on the 1000× 1000
two-dimensional OLAP views DC(25, 70) (left side) and DZ(0.5, 1.5) (right
side), respectively. For all the comparison techniques, letting r be the para-metric compression ratio and size(D) the total occupancy of D, we set the space budget G as equal to the r% of size(D). For instance, r = 10 (i.e., G is equal to the 10% of size(D)) is widely-recognized as a reasonable setting. 2.4 shows experimental results of the same experiment when ranging r on the interval [5, 20] (i.e., G on the interval [5, 20]% of size(D)), and fixing the se-lectivity of queries ——Q——; this allows us to measure the scalability of the compression techniques, which is a critical aspect in OLAP systems (e.g., see [8]). Finally, Fig. 5 shows experimental results for what regards the visualiza-tion capabilities of the compari- son techniques (according to the guidelines drawn throughout the paper) with respect to the depth of HRQs (i.e., PH) having fan-out degree WH equal to 5 and the parameter equal to 70
From 2.3, 2.4 and 2.5, it follows that, with respect to the accuracy met-rics, our proposed technique is comparable with MinSkew, which represents the best on two-dimensional views (indeed, as well-recognized-in-literature, MinSkew presents severe limitations on multidimensional domains); instead, with respect to the visualization metrics, the proposed technique overcomes the comparison techniques, thus confirming its suitability in efficiently sup-porting advanced OLAP visualization of multidimensional data cubes.
Fig. 2.5. Visualization metrics w.r.t depth of HRQ
2.4 Compressing Data Cubes under Simultaneous
Queries
As it has already been seen, conventional data cube compression techniques, such as histograms, are devoted to drive the compression of the input data cube in dependence on one constraint only. Traditionally, this requirement is represented by a given space bound available to house the compressed repre-sentation of the data cube, like in conventional approaches. Without loss of generality, this scheme can be classified as adhering to what is usually called the single-objective data cube compression paradigm, which defines a class of methodologies wide enough to include most of the data cube compression proposals appeared in literature during the last two decades. This consol-idated paradigm has been subsequently made more complex via including novel additional requirements to be considered simultaneously to the main space bound constraint, such as (i) compressing data cubes with the addi-tional goal of minimizing the overall query error of a given query-workload (e.g., [BCG01, CW07]), (ii) ensuring probabilistic guarantees over the qual-ity of approximate answers evaluated against compressed data cubes (e.g., [CW07]), or (iii) mediating on the degree of approximation of the retrieved answers (e.g., [Cuz06b, Cuz06a]).
More problematic issues appear when the data cube compression process must be performed in the presence of multiple constraints, under the multiple-objective data cube compression paradigm, which is a novel OLAP computa-tional paradigm not considered by previous research. Basically, according to this novel paradigm, the compressed representation of the input data cube is obtained as that intermediate (compressed) representation which accom-plishes, as much as possible, the multiple constraints defined by the input multiple-objective computational scheme. In fact, it is worthy noticing that, in the presence of multiple constraints, it is not possible to obtain a valid-for-all data cube compressed representation (i.e., the compressed representa-tion that simultaneously satisfies all the multiple constraints) so that devising sub-optimal solutions appears to be the most promising strategy for the so-complex computational setting dictated by the multiple-objective application scenario. The idea of introducing multiple-objective computational paradigms in order to deal with complex Database and Data Warehousing research chal-lenges has been considered in few contexts previously, and mostly with re-spect to requirements defined by multiple queries (i.e., simultaneous queries belonging to different query classes e.g., [Sel88]). Among these initiatives, it is important to recall: (i) multiple-query optimization for the view selec-tion and materializaselec-tion problem [MRSR01], (ii) multiple-query based data sources integration [NK01], (iii) multi-objective query processing in database systems [BG04] and OLAP [KP03], (iv) multi-objective query processing for specialized contexts such as data aggregation [FK06], complex mining tasks [JSA05] and data stream processing [WRGB06a], and, more recently, (v) sky-line query processing [BKS01], which aims at extracting Pareto distributions from relational data tables according to multiple preferences. Contrary to the above-listed research contributions, to the best of our knowledge, there did not exist in literature data cube compression techniques that take into con-sideration the issue of performing the compression process on the basis of multiple objectives.
Despite theoretical issues, when a multiple-objective OLAP computational paradigm is adopted, one must first set the nature and the typology of multi-ple goals with respect to which the paradigm has to be immulti-plemented. Similarly to the above-listed research experiences, it is ordinary to choose different-in-nature queries as playing the role of multiple objectives to be accommodated during the compression process. In parallel to the nature and typology of mul-tiple goals, a specific query class must be set. The general mulmul-tiple-objective data cube compression paradigm can be easily customized to any class of OLAP queries, from simple range queries [HAMS97], which are defined as the application of a SQL aggregate operator (e.g., SUM, COUNT, AVG etc) to a given range of multidimensional data, to more complex ones such as ice-berg queries [FSGM+98]. Considering this assumption, it is possible to con-sider the class of Hierarchical Range Queries (HRQ), already introduced as a meaningful extension of those defined by Koudas et al. in [KMS00]. As it will be evident HRQ define very useful tools for extracting hierarchically-shaped
summarized knowledge from data warehouse servers, beyond the capabilities of conventional OLAP environments. Definition 1 introduces HRQ.
Definition 2.1. Given a data cube L =⟨D, H, M⟩, such that (i) D is the set of dimensions of L, (ii) H is the set of hierarchies of L, and (iii) M is the set of measures of L, a Hierarchical Range Query (HRB) QH against L is a
tuple QH =⟨T, F, ϑ⟩, such that: (i) T is a general tree, (ii) F is a domain
of range queries, (iii) ϑ is a mapping function that maps queries in F onto nodes in T , (iv) for each level ℓ in T ,
|queries(l)|1∩
k=0
∥Qk∥ = ∅
such that queries(l) is the set of range queries at level ℓ of T , and (v) for each node n T such that depth(n) < depth(T )
|child(n)|−1∪
k=0
∥Qk∥ ̸= ∥Qn∥
where: (v.i) depth(n) denotes the depth of n, (v.ii) depth(T ) denotes the depth of T , (v.iii) child(n) denotes the set of child nodes of n, (v.iv) Qk denotes the
range query related to the node k, and (v.v)∥Q∥ denotes the volume of Q. It should be noted that, similarly to the multi-level and hierarchical nature of the target data cube L, HRQ are multi-level and hierarchical in nature as well, meaning that, for each level ℓ of T , the set of range queries at level ℓ, denoted by queries(l), must be evaluated against the maximal cuboid of L at level ℓ, denoted by Lℓ, i.e. the collection of (OLAP) data cells obtained by
aggregating data cells of L at the lowest level of detail (i.e., L0 ≡ L) with
respect to all the aggregation levels of hierarchies in H at level ℓ. Due to the illustrated properties, it is a matter to note that, given a data cube L and a HRQQH having T as structural tree, the answer to QH against L, denoted
as A(QH), is modeled in terms of a general tree Y having the same topology
of T and such that each node n stores the answer A(Qn) to the corresponding
range query Qn. Also, without loss of generality, for the sake of simplicity here
we assume that (i) hierarchies in H have all the same depth P , and (ii) the depth of T is also equal to P .
Depending on the kind of SQL aggregate operator characterizing range queries in F , different classes of HRQ can be obtained. It is quite straight-forward to focus on Hierarchical Range-SUM Queries, as SUM aggregations are very popular in OLAP, and represent the most common solution for ex-tracting useful knowledge from massive data cubes, while also encompassing the amenity of acting as baseline operators to build more complex OLAP aggregations/functions.
Range-SUM queries have been widely investigated in OLAP. As a conse-quence, in literature there exist a number of proposals dealing with the issue of
answering such queries efficiently via data cube compression techniques (e.g., [HAMS97, Cuz06b]). Basically, histogram-based compression approaches have been proposed, with the appreciable idea of evaluating approximate answers by means of linear interpolation techniques applied to buckets of the his-togram via meaningfully exploiting the Continuous Value Assumption (CVA) formulated by Colliat in [Col96], which assumes that data are uniformly dis-tributed. Given (i) a data cube L, (ii) the histogram Hist(L) computed on L, and (iii) a range-SUM query Q against L such that Q overlaps the bucket set B(Q) = b0, b1, , bW−1 of Hist(L), based on CVA the approximate answer
to Q, denoted by ˜A(Q), can be obtained as follows: ˜ A(Q) = W∑−1 w=0 ∥Q ∩ bw∥ ∥bw∥ · SUM(bw)
where SU M (bw) denotes the sum of (OLAP) data cells contained in bw.
More-over, when the CVA fails (i.e., the target data cube is characterized by skewed, i.e. asymmetric e.g., see [Cuz05], distributions), outliers contained in L can seriously decrease the accuracy degree of ˜A(Q), as it has been demonstrated in [CW07], and also recognized in [CDD+01]. In this case, in [CW07] the
ap-proximate answer to Q is obtained by means of separately considering the contribution given by outliers involved by Q, and summing-up this contribu-tion to the contribucontribu-tion given by classical linear interpolacontribu-tion. This imposes to separately handling outliers, and originates a different formula for ˜A(Q), which, for the sake of simplicity, here can be modeled as:
˜ A(Q) = W∑−1 w=0 [ ∥Q ∩ bw∥ ∥bw∥ · SUM(bw) + outlier(Q∩ bw) ]
where outlier(R) is the set of outliers (of L) involved by the region R. The latter query evaluation scheme gives good performance when a fixed, single (range) query or, better, a workload QW L of queries of the same nature and with similar geometrical characteristics is considered, as argued in [CW07] and in [BCG01]. According to this experimental evidence, the compression process tries to generate buckets such that the final bucket ranges define a partition of the input data cube L that, as much as possible, accommodates all the queries of QWL, thus improving the accuracy of linear interpolation techniques. To this end, the goal is two-fold: (i) obtaining buckets defined on uniform data (i.e., data with low variance), and (ii) minimizing the geomet-ric difference between buckets and queries, in a global fashion. This provides a query performance better than the one given by computing the histogram without a fixed query-workload, as demonstrated in [CW07]. The same ap-proach could be extended in order to deal with the issue of evaluating a given single HRQQH embedding several range queries. One can think of modeling
the set of range queries embedded in QH as the target query-workload, and then adopting the same query evaluation scheme described above. Therefore,
QHcan be straightforwardly evaluated by iteratively evaluating range queries
of its nodes, one at time.
It is worthy noticing that, in this case, linear interpolation techniques fail as ranges of queries of HRQ can be very different one from another, at the same level as well as at different levels of the hierarchy of the target data cube L. This makes the previous query evaluation scheme inefficient, and requires ad-hoc solutions able to deal with the complexity and the difficult nature of HRQ, in a global fashion. According to the proposed solution, the final histogram-based compressed representation of L, denoted by ˜L , is ob-tained as an intermediate representation given by meaningfully partitioning the bucket domain defined by the different query ranges of HRQ at the same level ℓ of L, for each level ℓ of the L hierarchy. In fact, it is a matter to note that, an arbitrary compression of the data cube could easily origin the unde-sired situation in which some HRQ could take advantage from the compression process (i.e., retrieved approximate answers have a high degree of accuracy), as the final partition fits data and geometric properties of these HRQ, whereas some other HRQ could be disadvantaged (i.e., retrieved approximate answers have a low degree of accuracy), as the final partition does not fit the above-mentioned properties for such HRQ. As a consequence, the idea of generating an intermediate compressed representation of L makes sense, as, on the aver-age, a fair final representation is obtained (i.e. retrieved approximate answers have acceptable/good accuracy in most cases). On the other hand, it should be noted that this approach has several conceptual points in common with other multiple-query data processing paradigms, such as those focusing on the view selection and materialization problem, where common sub-expressions of target queries are considered in order to obtain efficient solutions.
On a more practical plane, due to the hierarchical nature of cubes and queries, the compressed data cube ˜L is implemented as a hierarchical multidi-mensional histogram, denoted by M Q− Hist(L), which is obtained by means of a greedy algorithm, namely computeMultQHist, that meaningfully exploits the multi-level and hierarchical nature of the input data cube L, and defines a top-down compression process able to accommodate the different objectives of multiple, simultaneous HRQ against L.
2.4.1 The Compression Process
Given: (i) a n-dimensional data cube L having P hierarchical levels; (ii) the set of m HRQ that must be evaluated against L simultaneously, SHRQ = {QH0, QH1,· · · , QHm−1} (recall that, for the sake of simplicity, HRQ in SHRQ
have the same depth, P , which is also equal to the number of hierarchical levels of L); (iii) the space bound B available for housing the compressed representation of L, ˜L , which is implemented by the histogram M Q−Hist(L). The multiple-query compression process we propose is accomplished according to the following multi-step approach: