Corso di Laurea
in Amministrazione, Finanza e Controllo Tesi di Laurea
Multidimensional Risk
A behavioural economics insight into the composition of risk for investors.
Relatore
Prof. Massimo Warglien Laureanda
Giulia Simioni
Matricola 832353
Anno Accademico
2015 / 2016
2
―Believe you can and you‘re halfway there‖.
[Theodore Roosevelt]
3 INDEX
Page
Introduction ... 4
CHAPTER 1. An Introduction to Risk ... 5
1.1 A concept with many definitions ... 5
1.2 The variance ... 6
1.3 Financial risk in investments ... 7
1.4 How risk is treated in finance: risk management ... 10
1.5 Evaluating risky outcomes with utility functions ... 11
1.5.1 Risk-averse decision maker ... 12
1.5.2 Risk-neutral decision maker... 13
1.5.3 Risk-lover decision maker ... 13
1.6 Academic Finance perspective ... 14
1.6.1 Towards new perspectives ... 16
1.7 Behavioural Economics and Prospect Theory Perspective ... 17
1.7.1 Behavioural Economics and Finance ... 17
1.7.2 Behavioural Finance: key concepts ... 22
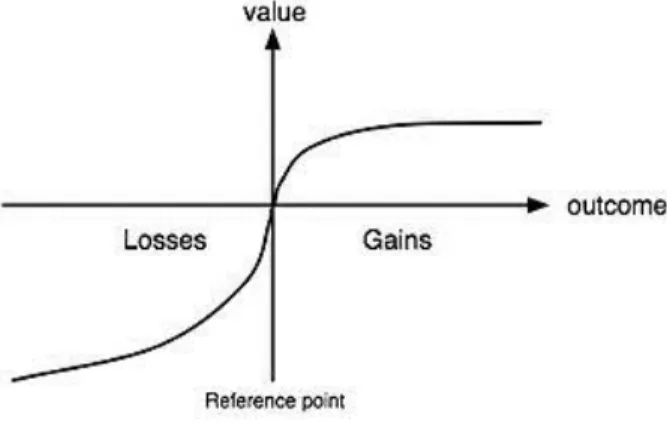
1.7.3 Prospect Theory ... 30
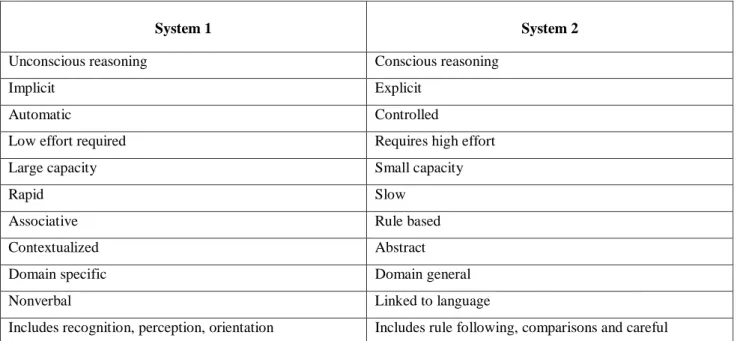
1.7.4 System 1 and System 2 thinking ... 32
1.8 Risk Attitudes ... 34
1.9 A new perspective on risk ... 37
1.10 Familiarity and risk ... 38
1.10.1 Awareness, associations, perceived quality and loyalty ... 39
1.11 Ambiguity aversion and risk ... 41
CHAPTER 2. Multidimensional Risk Survey ... 43
2.1 Multidimensional Risk ... 43
2.2 Analysis objectives ... 44
4
2.3 Questionnaire design and tools ... 45
2.3.1 Qualtrics ... 50
2.3.2 Amazon Mechanical Turk ... 51
CHAPTER 3. Questionnaire and Analysis ... 55
3.1 Sample population ... 55
3.2 Results description ... 58
Semantic analysis ... 66
Categorization analysis ... 72
3.3 Financial Literacy Score ... 76
3.4 Correlations ... 78
3.4.1 Financial Literacy Scores and Demographics ... 78
3.4.2 Ranking and Financial Literacy Scores ... 80
3.4.3 Ranking and Demographics ... 81
3.4.4 Ranking and Categories ... 84
3.4.5 Financial Literacy Score and Categories ... 86
3.4.6 Demographics and Categories ... 86
CHAPTER 4. Conclusions ... 89
APPENDIX A ... 92
Questionnaire – An Insight into Multidimensional Risk ... 92
APPENDIX B ... 105
Answers collected for Q19 ... 105
APPENDIX C ... 109
Data correlation tables ... 109
Bibliography ... 113
5
Introduction: Multidimensional Risk
Behavioural finance is undeniably an intriguing field of research, providing many layers to explore and important results to apply to many fields of daily life. With my thesis I aim at introducing the topic of Multidimensional Risk and, in particular, at analysing its components and relations with regards to investment decision making.
Multidimensional risk goes beyond the classical definition of financial risk, in fact, traditional decision theoretic conception of risk (academic decision theory definition of risk) does not explain completely choice behaviour and risk attitudes, but merely provides a number defining risk as the variance of a probability distribution. Indeed, within this classical framework it is difficult to find an empirical definition of risk. With this research I want to provide understanding for how an investor or a manager build different categories of risk, the so called multidimensional risk when they are faced with decision making processes under uncertainty.
As mentioned before, risk is not treated as a mere numerical indicator like classical theories imply, but it is a more complex group of risky elements and attributes affecting decisions.
The thesis is organized in four main parts: an introductive part, the presentation of the Multidimensional Risk Survey and tools employed, the analysis of questionnaire collected data and the final conclusions.
First of all, in chapter 1 the topic of risk is introduced and deeply analysed, both in its academic finance definition and also from a behavioural finance perspective. An extensive excursus on behavioural finance and prospect theory is also provided, followed by a presentation of the major heuristics and biases that affect decision making processes under uncertainty.
Chapter 2 enters the core work of this thesis by further illustrating the concept of multidimensional risk and explaining the main analysis objectives. It then proceeds by carefully illustrating the Multidimensional Risk Survey from the questionnaire design and topics to the tools employed in the collection of the data.
Chapter 3 follows with an analysis of the data collected with the survey. A first descriptive analysis of the sample population, of the results and main trends is provided, followed by a correlation analysis with R Program of the data and variables to get a further insight into the relations between risk components, categories, financial literacy levels and demographic features.
In conclusion to sum up chapter 4 provides an overview of the work done and draws the conclusions to see the impact of the survey findings and possible future applications.
6
Chapter 1: An Introduction to Risk
This introductive chapter is divided into two main parts.
The first one displaying the most important concepts surrounding risk in the classical economic theories and in financial literature to provide a range of definitions and a view of what the standard theories assumes when dealing with risk.
While the second, is focused on behavioural economics and on modern theories concerning risk and risk perception. A
Finally, the last paragraphs are dedicated to the understanding of two particularly important aspects related to risk in behavioural finance: familiarity and ambiguity. These two concepts are fundamental for the understanding of investors‘ behaviour and often play a crucial role in investment decisions.
1.1 A concept with many definitions.
This chapter aims at introducing the concept of risk. The goal of this first part is indeed to provide a framework of the classical definitions of risk in economics and finance in order to have a sound understanding of the academic concept and to be able to proceed with a deeper insight into the more recent concept of multidimensional risk, that is the core object of my thesis.
According to the Oxford English Dictionary, risk is the exposure to the possibility of loss, injury or other adverse or unwelcome circumstances; a chance or a situation involving such a possibility.
Speaking of business, risk is the potential of gaining or losing something of value (Kungwani, 2014). In financial markets, there is often the need to measure credit risk, information timing and asymmetries risk, sources risk, legal risk and model risk.
Broadly speaking however, risk is given by a mere number in finance: the variance, in case we refer to the single stock and its statistical variations; or the beta coefficient, which indicates whether the stock is more or less volatile comparing to the market, and represents a measure of the systematic risk which will be explained later on in this chapter.
When we invest, we hardly ever receive what we expected, otherwise the investment would be perfectly predictable and by definition risk-free. Therefore the return on an investment is given by an expected part and an unanticipated portion, a sort of surprise. It is these unanticipated events that constitute the risk of owning an asset.
Before talking of risky outcomes and decision making in risky situations, it is necessary to understand three basic concepts for describing risky outcomes: probability distributions, expected value and variance. A probability distribution is a depiction of all possible payoffs of an event whose outcome is uncertain and their
7 associated probabilities. The probability is obviously the likelihood that a particular outcome of one of these events will occur. There are two important properties of probability: the first one is that the probability of any outcome is between 0 and 1; the second that the sum of all possible outcomes regarding an event must be equal to 1. We will see later on in this chapter how this property will lead to the Ellsberg paradox and risk considerations going beyond the classical economic and finance theory. In these cases we can also talk about subjective probabilities, that is probabilities that reflect subjective beliefs about risky events. Different decision makers often have different beliefs about probabilities and different conception of risk. Indeed this is what this thesis aims at analysing, the behaviour towards risk of investors with different backgrounds and their multidimensional concept of risk. Some investors are more optimistic, others are strongly risk averse and so on.
As for the expected value, it can be defined as the payoff that an event with uncertain outcome may generate.
The expected value is therefore given by the payoff an event may generate times the probability that it actually occurs. In the next session, the variance will be introduced.
1.2 The variance.
Stock returns can be displayed in a frequency distribution showing which the more volatiles stocks are. It is well known that government bonds are less volatile than common stocks, in other words, they have a lower variance. The variance is the averaged squared difference between the actual return and the average return (Ross, Westerfield and Jordan, 2009).
The variance therefore gives an indication of how volatile the stock is, of how much it deviated from the average return. The higher this number, the more volatile the returns are. Another measure of volatility is the standard deviation, which is the square root of the variance.
It is a measure of how spread numbers in a data set are and, in particular, how far they are from the mean. In statistics, the formula for the sample variance is the following:
And it is given by the sum of the squared differences between the individual data point and the mean, divided by the number of values in the set (minus 1).
The figure below provides an ideal framework of how volatile and, therefore, how risky certain assets are. It is important to highlight that treasury bills are among the safest investments, as the low standard deviation shows and this is a very popular belief among investors. Investors aversion to risk will be analysed later.
-1
8 Table 1.1: Historical Returns and Standard Deviations for Different Assets.
Asset Class Average Annual Return
(1926-2011) Standard Deviation
Large-company stocks 11.8% 20.3%
Small-company stocks 16.5% 32.5%
Long-term corporate bonds 6.4% 8.4%
Long-term government bonds 6.1% 9.8%
Intermediate-term government bonds 5.5% 5.7%
U.S. Treasury bills 3.6% 3.1%
Source: Bank of America Merril Lynch,2011
1.3 Financial risk in investments.
When dealing with investments and returns, there is always an expected return and an unexpected return component, that is the risk. The investment is perfectly predictable and therefore risk free if we always receive what we expect from it. However, this is hardly ever true. The risk of owning an asset is made of unanticipated events.
Total risk = systematic (market) risk + unsystematic (diversifiable) risk
Talking about risk, there is a fundamental first distinction to be made by introducing the concepts of systematic risk and unsystematic risk. The former is defined as a risk that influences a large number of assets, the so called market risk. The latter is a risk that affects at most a small number of assets, an asset- specific risk (Ross, Westerfield and Jordan, 2009). For instance, uncertainties about general economic conditions are examples of systematic risk because they include GDP, inflation, interest rates etc. These are risks that cannot be avoided, indeed, they affect nearly all companies. On the other hand, the unsystematic risk is a more specific one, affecting only a sector as a strike of an oil company could be, causing problems to certain companies in the business, but not to all companies in the oil market.
In the investments field, unsystematic risk can be avoided or partially reduced by the process of diversification, that is spreading an investment across a number of assets (Ross, Westerfield and Jordan,
9 2009). This is a fundamental principle for building a balanced portfolio of investments and it is vital to diversify across industries but also within industries and on a geographical base.
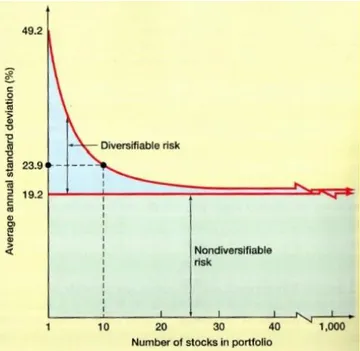
The graph below shows the relation between diversifiable risk and non-diversifiable risk within a portfolio.
Table 1.2: Diversifiable and Non-diversifiable Risks in a Portfolio
Source: Westerfield, 2009.
As the graphs explains, diversification reduces risk because with a large portfolio our investment does not fluctuate depending only from a company-specific events but fluctuation effects can be mitigated and spread among the several stocks in the portfolio, thus reducing the unsystematic (diversifiable) risk.
Investors who bear risk want to be remunerated and therefore the need for a measure of risk arises. The systematic component of risk is used to determine the expected return (risk premium) of the asset. The risk premium is defined as the excess return required by an investment in a risky asset over that required by a risk-free investment (Ross, Westerfield and Jordan, 2009).
As above mentioned, unsystematic risk can be reduced by diversification, but investors still bear the systematic risk and want to be remunerated for this. The systematic risk principle says that the expected return on an asset depends only on that asset‘s systematic risk (Ross, Westerfield and Jordan, 2009). This is a fundamental principle of the market, because indeed the market rewards only the risks that are unavoidable.
The amount of risk an investor bears is a personal decision that will be analysed later on in this chapter and throughout the thesis work. The beta coefficient is the amount of systematic risk present in a particular risky asset relative to the risk present in an average risky asset (Ross, Westerfield and Jordan, 2009). It is a measure of a stock‘s volatility in relation to the market. Each stock is rated in relation to how much it
10 deviates from the market which has a beta coefficient of 1. The higher the beta, the riskier the underlying asset, the higher the risk premium and the expected return for the investor.
In the table below standard deviation and beta coefficient are shown for a couple of sample stocks.
Table 1.3: Total Risk vs Beta Coefficient
Stock Standard Deviation Beta Coefficient
Stock A 40% 0.50
Stock B 20% 1.50
Source: student elaboration
As the table shows, stock A has greater total risk, but lower systematic risk (the Beta is significantly lower than the one of stock B). Stock B, on the other hand, has a higher systematic risk (market risk or Beta) and will be therefore better remunerated in terms of risk premium even though it has a lower total risk (because part of it is avoidable with diversification).
In conclusion, the beta coefficient explains whether the investment is more or less volatile than the market and it shows the part of the statistical variance that cannot be eliminated with diversification (as said before, it represents the systematic risk) and it can be computed with a regression analysis against a stock market index. According to the systematic risk principle, the expected return on a risky asset depends only on that asset‘s systematic risk (Ross, Westerfield and Jordan, 2009).
The table below shows the values of betas and their interpretation.
Table 1.4: Beta Coefficient values
β values Meaning
β<1 The investment is less volatile than the market.
β>1 The investment is more volatile than the market.
Source: Ross, 2009.
11 An average asset has a beta equal to 1 because it follows the movements of the market, while a beta equal to zero indicates that the asset is not correlated to the market, has no systematic risk. Finally, if the beta is <0, it means that the asset is moving in an opposite way than the market, inversely correlated.
In a market that works well, the reward to risk ratio of an asset (defined as its risk premium divided by its Beta coefficient) is the same for every asset.
Reward-to-risk ratio: [E(Ri) – Ri]/βi
As a consequence, when asset expected returns are plotted against asset betas, all assets plot on the same straight line called the security market line (SML).
1.4 How risk is treated in finance: risk management.
As reminded in the previous paragraphs, risk in finance is the probability that an investment‘s actual return will be different than expected. This includes the possibility to lose all the initial investment or to gain something more. The relationship between risk and return is a fundamental one in finance, the more one is willing to risk, the more conspicuous the return for bearing the risk must be.
Risk management is the discipline that combines the recognition of risk, its assessment, the development of efficient strategies to manage it, and its mitigation with the use of managerial resources.
This paragraph very briefly analyses the sources of risk, which can be physical such as natural disasters or accidents, the environment, technology, organizations, politics and humans. The use of traded financial instruments allows the mitigation of risk effects, after the analysis of the capital structure of a company and the interests, because if a company is highly levered it is not a safe investment and needs risk management, especially if in a recession period. Financial risk arises in any transaction: loans, sales and purchases, legal transactions, investments, M&A, new projects, managerial activities, foreign activities etc. When financial prices change dramatically, it can increase costs, reduce revenues, or otherwise adversely impact the profitability of an organization (Kungwani, 2014). Investors for instance face an exchange rate risk when they have assets or investments in foreign markets or if they have loans in a foreign currency because there may be sudden changes in the exchange rate of the currencies.
It is important to keep into consideration these sources of risk when analysing decision making in uncertain conditions as it is interesting to see which aspects will then be considered as having a component in the multidimensional risk concept. For instance, some investors may find it important to know where they are investing: whether the country is safe, with positive sound prospects, with a stable government, indeed this is called sovereign risk in financial environments.
12 In conclusion to this little insight, once risk are identified through an analysis, the risk manager creates a plan to minimize or eliminate the impact of negative events.
1.5 Evaluating risky outcomes with utility functions.
Risky outcomes are generally described in economics with the help of tools such as probability distributions, expected values and variances. This paragraph aims at illustrating one of the classical decision making methods to compare and evaluate alternatives whose payoffs have different probabilities distributions and therefore different degrees of risk. Utility functions are a way to evaluate risky options in classical economic.
As it is well-known, in microeconomics, a utility function is a measure of satisfaction given by the consumption of a bundle of goods and/or services.
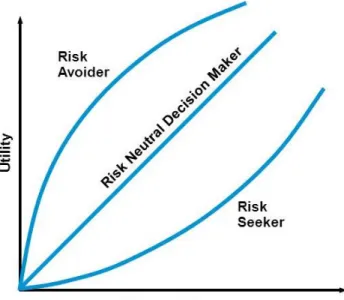
The picture below shows three different utility functions: for a risk-averse decision maker, for a risk-neutral decision maker and for a risk-loving one, respectively.
Table 1.5: Utility Functions and Risk Attitudes
Source: Besanko, 2011.
In order to illustrate the decision making process made with utility curves, suppose one has to choose between starting to work for a large consolidated company, giving a salary of $46000 per year and a startup company which can assure a symbolic salary of $6000 plus a possible bonus of $80000 in case the company launch is a success with a 50% probability to get or not the bonus.
13 Clearly, the decision to be taken is between a certain event (the consolidated company) and a risky event (the startup company) that may yield to extremely positive results (salary plus bonus) or poor results (in case of failure of the company. The first assures a salary of $46000, while the second may make the person rich quickly with a total of $86000 or very poor with only $6000, with a 50-50 probability. However, the expected values of the two salaries are equal: the first (expected salary of consolidated company) is obviously E(SC) = $46000, while the second (startup expected salary) is given by E(SS) = $6000 + 0.5 *
$80000 = $46000. In order to make a decision and evaluate the two alternatives, one may use a utility function.
1.5.1 Risk-averse decision maker.
In the case of risk aversion, the utility curve displays diminishing marginal utility because an increment to income increases utility by much more when the income is low, while the effect on utility is lower as the income rises. Reworded, a poor person values an increase in income a lot, while a rich person is not particularly affected by such an increase in income because his/her level of satisfaction is already high.
Table 1.6: Utility Function and Risk Aversion
Source: student elaboration.
Point A: it represents the utility level assuming that the startup company will not be able to give the bonus and therefore will grant only the basic symbolic salary of $6000 (50% probability for this event).
Point B: represents the utility achievable by choosing the job at the secure, consolidated company which provides an income of $46000 per year.
Point C: it represents the utility level achievable in case the startup company gives the bonus (50%
probability).
Point D: represents the expected utility given by the startup job.
C B
A
6
Utility function
Income (thousands of dollars per year) D
0 46 86
14 The expected utility is the expected value of the utility levels that the decision maker receiver from the payoffs in a lottery (Braeutigam and Besanko, 2011).
In conclusion, because the expected utility with the consolidated company is higher than the expected utility of the start-up company, the person will prefer to work for the consolidated firm, avoiding risky options.
This was indeed an example of a risk-averse person, one who prefers a sure thing to a lottery of equal expected value. In general, a utility function that shows diminishing marginal utility implies that the utility of a sure thing will exceed the expected utility of a lottery with the same expected value (Braeutigam and Besanko, 2011).
The blue line shows the upside effect, whereas the green line represents the downside and it has clearly a greater impact. Because of diminishing marginal utility, the reduction in utility given by the downside is bigger than the gain in utility given by the upside. In other words, the hurt suffered by the person in case of a downside is of greater weight with respect to the gain he/she would have in case of an upside in the lottery.
This is why the risk-averse decision maker has the tendency to choose the more safe and sure option.
1.5.2 Risk-neutral decision maker.
In the case of a risk-neutral attitude, the decision maker compares lotteries and options only according their expected values and is therefore completely indifferent between a sure thing (salary in this case, or investment returns in the case of an investor) and a lottery with the same expected value.
The risk-neutral decision maker has a linear utility function (U = a + bI). The function is therefore a straight line, the marginal utility of the income is consequently constant, therefore there is not the effect that there was in the risk aversion case.
Table 1.7: Utility Function and Risk Neutrality
Source: student elaboration.
1.5.3 Risk-loving decision maker.
A risk-lover decision maker is a decision maker who seeks risk, and prefers a lottery to a certain sure event which has the same expected value overall. In the case presented above, the utility coming from the risky job
Utility function
Income (thousands of dollars per year) Utility
86
15 at the startup company would exceed the utility given by the secure consolidated company. Indeed the utility function in this case exhibits increasing marginal utility as shown in the sketch below. The utility goes up as the increase in the decision maker income goes up.
In fact, if offered either $50 or a 50% each chance of either $100 or nothing, a risk-seeking person would prefer the gamble even though the gamble and the sure thing have the same expected value.
Table 1.8: Utility Function and Risk-loving
Source: student elaboration.
In real life, the decision between the two jobs options is undeniably affected by many other issues such as, for instance, the long-term prospects of the firms‘ earnings, the locations and other non-monetary characteristics of the two jobs, the nature of the work, the familiarity of the company, working hours etc.
This is why it is important to go beyond the mere definition of risk in economic terms, to understand the components of risk in the decision makers‘ minds, to get an insight into what is considered when making such a decision, which is a parallel concept to an investment: when someone chooses a job, the decision is about how to invest their time. In the next chapter, the topic of multidimensional risk will be presented and further investigated before arriving to the questionnaire and analysis part of this thesis.
1.6 Academic Finance Perspective
Before entering the fascinating world of behavioural economics and behavioural finance in particular, hereafter follows a brief excursus on the pillars of the conventional financial theory.
According to traditional economic theories investors are people who make rational decisions in order to maximize their utility and optimize their choices (Braeutigam and Besanko, 2011).
Rationality of investors is a concept defined by Ricciardi (2008) that inclused:
1. Making optimal decisions.
2. Investors‘ objectives are financial in nature and are assumed to maximize wealth.
3. Unbiased expectations of individuals regarding the future.
Income (thousands of dollars per year) Utility
16 4. Individuals act in their own best self-interest.
This standard finance viewpoint states that investors take decisions according to the efficient market hypothesis, indeed since the ‘60 these hypothesis have been within the most important theories in standard finance. According to the efficient market hypothesis investors process information instantaneously, there is perfect information and therefore asset prices fully reflect all the existing information (Fama, 1965).
As a consequence to this theory, it is impossible to “beat the market” on a risk adjusted basis as the market prices should only react to upcoming new information. Investors are therefore rational individuals, making rational and informed choices as the stocks are always traded at their fair value, not allowing room for over inflated sales or undervalued purchases. In these conditions, even with a smart stock selection and market timing, it is impossible to outperform the market. The only way to get higher results is by chance or by bearing more risk and therefore obtain higher returns according to the risk-return ratio.
Under these hypothesis, investors are rational individual meaning they act and invest only basing their decisions on new information, not on intuition or emotions (Nichols, 1993).
The standard finance rational economic decision making implies that all individuals are wealth maximizers selecting the most preferred choice maximizing the individual utility or value function; this is possible assuming that the investor possesses complete knowledge of the market and stocks and employs a well- structured decision making process based on profit maximization and an in depth search for information and analysis of alternatives with no time constraints. By making such informed systematic decisions the rational decision maker acts in a world of complete certainty. Skills such as computational ability are given for granted in these theories, suggesting that with rationality individuals and companies are able to predict future events without biases and with the perfect timing and availability of information (Ricciardi, 2008).
These assumptions are an issue that arouses strong feelings and debates among academics, some firmly believing that the market perfectly prices assets, others stating that investors are not rational individuals and that there is often lack of information – asymmetry - and agency problems.
There are three types of market efficiency to be taken into account:
- The weak form: the market is efficient because the history of all past market prices and information is fully reflected in securities values.
- The semi strong form: the market is efficient in that all publicly available information is reflected in securities values.
- The strong form: the market is efficient because all information is reflected in securities prices.
17 The objective of an investor acquiring stocks is to increase his/her financial wealth. Under this perspective and traditional finance point of view, it would be futile for investors to apply certain investing techniques because an investor‘s expertise and prospects are already reflected in either a specific stock price or in the overall financial market. Thus, it would be pointless and unrealistic for investors to spend their precious time and resources in trying to outperform the market (Ricciardi, 2008).
Even though it is not the objective of this thesis, the major paradigms of traditional finance, all fundamentally assuming the rationality of investors, can be briefly summarized as follows:
-portfolio allocation based on the relationship between expected return and risk;
-risk-based asset pricing models such as the CAPM (Capital Asset Pricing Model) and other similar frameworks;
-the Miller-Modigliani theorem and the theory of agency.
According to conventional economics, emotions and other factors do not influence people when it comes to making economic choices because people are thought to be rational wealth maximizers.
Academic finance, however, does not completely explain why individual investors trade, how they choose their portfolios and why returns vary across stocks for reasons that go beyond risk. Corporate finance as well is a field in which there are many issues that do not conform to traditional financial models and lack explanation, very often mergers and acquisitions and capital structure decisions are an example of these unconformities.
1.6.1 Towards new perspectives.
In contrast, professional investment managers and behavioural finance experts do consider the existence of market inefficiencies (for instance the January effect, presenting a seasonal increase in stock prices possibly due to the fact that investors use year-end cash bonuses to buy investments in January).
Like the January effect, there are other regularly occurring anomalies that directly violate modern financial and economic theories as they do not imply rational decisions. These anomalies triggered and sustained the development of behavioural economics studies. Among these, there is also the so called Winner’s curse, a phenomenon in which the winning bidder in a common-values auction might bid an amount that exceeds the item‘s intrinsic value (Besanko, 2011). The differences in pricing occurring in these occasions are a clear sign that participants in the bidding process do not have the same information on which to base their valuation or that they price differently due to some other factors not directly connected to the bidding.
According to Richard Thaler's 1988 article on winner's curse, there are two primary factors that undermine the rational bidding process: the number of bidders and the aggressiveness of bidding.
18 These are just a couple of anomalies that conventional financial theory does not account for in the real world.
It is not to say that conventional financial theories are not valuable, but rather that the addition of behavioral finance can further clarify and investigate how financial markets works.
The market is inefficient whenever there is information asymmetry, implying there are some people who have more information than others and that are thus able to make better investment decisions. Furthermore, asymmetry of information implies arbitrage opportunities, meaning that there is the opportunity to find mispriced assets and generate greater returns (Ricciardi, 2008).
The existence of market inefficiencies leads to implications that are fundamental in the behavioural economics and finance researches: people are willing to try to exploit and find these arbitrage chances and often act in an irrational way making judgments that do not comply with the strong assumptions of profit maximization and rationality. Indeed this demonstrates that people are often driven by other factors than rational reasoning such as cognitive processes and affective or emotional factors. This results in investor perceptions being influenced by their own personal risk judgments on a particular asset under valuation and in their failure to detect their best investment option by selecting a stock/other asset influenced not by rational thinking but by emotions and other issues such as familiarity etc. as will be explained further on in the next paragraph and throughout the thesis.
1.7 Behavioural Economics and Prospect Theory Perspective.
1.7.1 Behavioural Economics and Finance.
Behavioural economics and one of its branch, behavioural finance, are disciplines that study how behaviours and decisions are affected by psychological, social, cognitive and emotional factors. These studies are important because these effects have consequences on market prices, returns and resource allocation as they characterize the economic decisions taken not only by individuals but also by institutions (Lin, 2012).
Imperfections in financial markets are attributed to a combination of cognitive biases such as overreaction, representative bias, information bias, overconfidence and many other factors developed by human misprocessing of information and common mistakes in reasoning.
Though on the one hand it is true that the market processes a lot of information and reflects it into share prices that generally rise as the amount of information disclosed increases (Farvaque et al., 2011), on the other hand it is nevertheless true that there is still room for information asymmetry as the quality of the information disclosed may not be high and not all companies comply to the same levels of information disclosure. Rating agencies such as Standard and Poor‘s assign transparency score takes into account the
19 quantity of disclosure: the more information is given (regarding the ownership structure, financials, shareholders rights, management), the higher the score is. Improvements in the quality of information in fact reduces information asymmetry that prevails among investors. This asymmetry allows informed agents to make profits to the detriment of uninformed agents, through what is known as informed trading (Farvaque et al., 2011) and creates opportunities for arbitrage.
Decision makers therefore possess only limited information in the case of information asymmetry.
According to Simon (1956), investors in these situations do not always seek for the best potential choice because of limited resources and personal inclinations, thus becoming mere satisfiers and not maximizers.
Regarding information, it is important to question the assumptions of the EMH (Efficient Market Hypothesis) as Faust (1984) did wondering whether investor process information in an efficient, logical and neat way. In addition to this unsatisfied assumption there another important issue arises nowadays:
information overload. It is defined as a situation that occurs when the information processing demands on an individual‘s time to perform certain actions and calculations exceed the supply or capacity of time available for the processing (Schick, Gordon, Haka, 1990).
The poor judgment abilities of individual investors are constantly being challenged by the enormous amount of information and data available nowadays: the abundant investment choices and the advancement of information techniques and the Internet provide investors, academics and professional consultants with an overwhelming flow of resources to analyse. Bulletins, chat rooms, dedicated websites, blogs, and trading rooms are just a few to mention.
This information overload makes it even more difficult to take investing decisions and indeed it makes the use and application of heuristics even more attractive. Complicated tasks are indeed a synonym of tasks with lots of information to be analysed and taken in. Heuristics on one hand are simplifying decision strategies that require less cognitive effort, but on the other hand, they are less accurate and precise than more complex decision making strategies (Paredes, 2003).
In brief, information is good, but may it may as well lead to bad decision if the investor is not capable of properly analysing it and if it comes in an overwhelming amount (Ricciardi, 2008).
Behavioural decision theory departs from the traditional, solely statistical econometric and mathematical models in which rationality is the core assumption. It has provided insight into a more descriptive model of human behaviour, investigating the way people make decisions and understanding that investors do not constantly comply to the normative of classical finance by miscalculating probabilities (investors are well known for not having a complete panoramic of the whole probability distribution of an event and under or over estimating probabilities) and, secondly, by entrusting non-economic factors in the decision making processes. Indeed, the behavioural decision maker is influenced in his/her judgment process by what is felt, perceived, remembered in a particular situation or event or circumstance.
20 A fundamental role in behavioural economics is played by bounded rationality, that is the fact that decision makers are severely limited by their values, unconscious inclinations, skills possessed and habits (Simon, 1997). Bounded rationality implicitly states that economic rationality has its considerable limitations, especially if the decision making process is happening under conditions of risk and uncertainty as in the case of the analysis of this thesis and, more in general, in the case of all investors. In one of his researches, Ricciardi (2008) illustrated how investors prefer to identify themselves in models of bounded rationality against models of standard finance and strict rationality assumptions.
At the basis of behavioural finance is the assumption according to which investors are irrational or at most hardly ever rational (Thaler, 1994). Inconsistency of choices is another element that characterizes investors in the behavioural economics world and emerges in many surveys.
The table below summarizes the critics made by Simon (1947) with respect to the concept of rationality assumed by the classical economic theories.
Table 1.9: Criticism on the limits of standard rationality.
1. Rationality necessitates of complete knowledge and anticipation of the consequences that will derive with respect to each choice. Nevertheless, consequences are not always known in advance.
2. The consequences of investors‘ choices lie in the future and the value deriving from them may not have been experienced in the past. So imagination covers the lack of values, which are therefore only imperfectly anticipated.
3. Rationality requires a choice among all possible alternative behaviours, however, in real behaviour, only a limited number of these alternatives comes to mind (Simon, 1947).
Source: student elaboration
Cognitive processes are the mental mechanisms that human beings make use of in order to process information and solve problems during the decision making processes (Ricciardi, 2008). They are basically mental skills allowing the comprehension and recognition of what surrounds an investor, in this case. The behavioural economics literature on studies about the irrationality of human behaviour is wide, proving the illogical attitudes towards money management, finances and investment decisions (Kahneman, Slovic and Tversky, 1982; Piatelli-Palmarini, 1994; Olsen, 1998; Ricciardi, 2006).
Cognitive aspects concern the way people mentally organize their information they have available as explained by Shefrin (2000), while the emotional aspects deal with the way people feel when they register information.
21 Indeed, financial decision makers are neurologically predisposed to incorporate feelings and emotions (affect) into the decision making process according to Olsen (2001).
Among the factors that influence investors’ judgment are some internal and external factors.
On the internal side there is undoubtedly the psychology of other individuals or group that act in the market place; conversely, on the other hand, there are the past experiences of the investors providing favourable or unfavourable memories of a precedent investment decision. This memory can obviously be positive or negative depending on the final outcome of the decision, gains or losses respectively.
Furthermore, what is fundamental to take into consideration when supporting behavioural economics theories against traditional finance and the efficient market hypothesis is that not all investors and shareholders have the same level of financial literacy – defined as the possession of knowledge and understanding of financial matters (OECD/INFE international survey of adult financial literacy competencies, 2016) – and that therefore there is room for misunderstanding of the information disclosed and consequently of bad decision making. Indeed, this is one of the aspects that will be analysed through the multidimensional risk questionnaire presented in chapter 3.
Behavioural economics and behavioural finance are strictly related to risk tolerance which is defined as the individuals willingness to engage in a financial activity whose outcome is uncertain (Chivali, 2016). Risk will be deeply studied and analysed in chapter 2. Behavioral models typically integrate insights from psychology, neuroscience and microeconomic theory, covering a wide and important array of concepts, methods and application fields (Milton and Kahle, 2013).
The macro topics in behavioural finance are:
- Heuristics: a problem solving method based on rules of thumbs that allow quick decisions and responses but do not assure optimal approaches to the issues.
- Framing: including all the anecdotes and stereotypes that make up the mental emotional filters (frames) individuals rely on to understand and respond to events based on previous personal experiences and similar/connected feelings.
- Market inefficiencies: mispricing, information asymmetries and non-rational decision making behaviours.
Historically speaking, behavioural economics was born in the ‘60 when cognitive psychology started to provide more insights on the brain intended as an information processing device. Psychologists researches such as Tversky and Kahneman began to compare their cognitive models of decision-making under risk and uncertainty to the traditional economic models of rationality bounded choices.
22 This discipline is very important in financial education because it can provide insights into the most common mistakes investors make and in what strategies are likely to work in financial markets (Subrahmanyam, 2007). It underlines inefficiencies as under reactions or overreactions to the disclosure of information causing market trends and in more extreme cases of market bubbles and crashes. The reasons behind these extreme behaviours are to be sought in investor behavioural characteristics such as attention, overconfidence, excessive optimism.
One of the most absurd economic bubbles in history is undeniably the tulip fever or tulipomania that affected the Dutch Golden Age increasing the prices for bulbs at incredible heights after the introduction of tulips for then collapsing short after. An economic bubble is a situation in which asset prices considerably outstand their intrinsic value. The tulip was different from every other flower known to Europe at that time and in fact it soon became a status symbol. The peak of tulipomania was reached in 1636 when some bulbs were exchanged even ten times in a day. Speculation in the tulip market was a must do and people were trading even dozens of acres of land for a single tulip bulb. Investors were then ruined by the fall of the prices as the situation was not sustainable for obvious reasons. It is undeniably a rather extreme example but it serves the purpose of explaining that people‘s behaviour is not always rational and predictable, there are many factors behind it. This is to say that behavioural finance tries to explain behaviours of investors and mark common cognitive mistakes deriving from framing, heuristics, familiarity issues etc.
In contrast with the investors‘ rationality assumption of academic finance there are many studies of behavioural finance providing support to other factors influencing individuals decision making. Saunders, (1993) for instance, provided empirical evidence that the NYSE (New York Stock Exchange) market has the tendency to earn positive returns on sunny days and average results on cloudy days. This result is also supported by studies on international markets (Hirshleifer and Shumway, 2003) suggesting that the mood of investors has an impact on their decisions and therefore on the stock market itself. Huberman (2001) highlights how investors prefer stock that are close to the region they live in.
Another example is the familiarity hypothesis (which will be further analyzed later on in the chapter) according to which individuals prefer stocks with high brand recognition (Frieder and Subrahmanyam, 2005). Furthermore, the preference for local stocks is a feature characterizing not only individual investors but also mutual fund managers (Coval and Moskowitz, 1999) as they prefer to invest in stocks headquartered in the region in which they operate with their company. In addition, as showed by Hong et al (2005), managers are more likely to buy stocks that fellow managers in the same city are buying as well, providing evidence that portfolio decisions are also a matter of the so called word of mouth effect among managers and investors. In conclusion, this is to say that financial markets are driven, at least in part, by irrational agents.
In the table below is a general overview of the points on which standard finance and behavioural decision making debate.
23 Table 1.10: Points of debate between the two theories.
Standard Finance Behavioural Finance
Rationality: individuals make logical and coherent financial and investment choices.
Rationality is bounded to knowledge, understanding abilities, skills, time, cognitive limitations, heuristics and affect (feelings).
Investors are not affected by emotions in their decision making processes.
Investors are influenced by psychological factors that prevent them from making optimal investments decisions.
Explains how markets operate as an aggregate. Explains how individual investors actually behave.
Judgments are made within a clearly defined set of circumstances, all possible alternatives and consequences known.
Judgments are made in information asymmetry situations, or with information overload without having a complete view of the situation/outcomes.
Decisions are taken through the application of a complex strategy.
Decisions are often taken with the use of heuristics to simplify the problem.
The choice is the optimal outcome. The choice is a satisfactory outcome.
Source: student elaboration
1.7.2 Behavioural finance: key concepts.
For this thesis work it is fundamental to learn more about the main theories and concepts of behavioural finance and economics because they are all aspects to be considered when analyzing the individuals‘
perception and idea of risk and how it may be influenced.
Heuristics.
When people have to deal with complex situations and judgments, in the specific case of economics and finance environments with probabilities and investments decisions, the general trend is to use a number of heuristics to make the task simpler and clearer. Heuristics are rules of thumbs that make the judgment process faster as they cut some steps of reasoning, they are cognitive tool for mental shortcuts.
24 Myers (1989) refers to heuristics as a repertoire of strategies based on pieces of knowledge acquired in the past, rules learned by doing, or hypothesis that worked in the past. The use of heuristics is very popular because as previously said they reduce the time of the decision making process for an individual investor.
According to Ricciardi and Simon (2001) make a clear and direct definition of heuristics: mental shortcuts or strategies derived from four past experience that get us where we need to go quickly, but at the cost of sending us in the wrong direction or introducing biases that result in over or underestimation of the actual outcome.
Anchoring.
Anchoring is one of the key concepts in behavioural economics and finance, as it is important to understand that people have a tendency to ―anchor‖ to a reference point and consequently absolute evaluation is difficult. The process of anchoring is used by an individual to solve intricate problems of a decision-making process by selecting a reference point and adjusting to arrive to a final judgment and decision (Ricciardi and Simon, 2001). Anchoring is a frequent phenomenon when people are faced with new concepts and situations and are somehow forced to find a solution starting from the previous similar experiences/past events/trends.
Indeed, this is also what broadly speaking a marketer does when projecting the sales of a product for the upcoming year: the reference or starting point is the volume of the past years sales.
A common example to explain anchoring is provided by Hammond, Keeney and Raiffa (1998). In one of their studies they asked their candidates to ask the following simple questions:
- Question 1: Is the population of Turkey greater than 35 million?
- Question 2: What‘s your best estimate of Turkey‘s population?
Not surprisingly, most of the people were influenced by the formulation of the first question when answering the second one and used 35 million as a starting point for their evaluation of the population. This simple study proved evidence that, when making judgments, individuals‘ minds improperly consider as significant some original information, or overweight its real value (Hammond, Keeney and Raiffa, 1998). Choices and benchmarks are anchored to first impressions, rough calculations, memories or statistical figures presented.
Anchoring is present also in investments as investor often base their decisions on wrong figures.
Revising an intuitive, impulsive judgment will never be sufficient to undo the original judgment completely.
Consciously or unconsciously, we always remain anchored to our original opinion, and we correct that view only starting from the same opinion‖ (Piatelli-Palmarini, 1994).
25 Mental Accounting.
Mental accounting is an interesting aspect of behavioural economics especially when dealing directly with investors and savers. It the set of cognitive operations used by people, households and investors to organize, evaluate and keep track of financial activities (Thaler, 1999).
Mental accounting is about how outcomes are perceived and taken in, how different activities (such as holidays, loans, housing, mortgages, school…) are categorized and indeed put into different accounts according to their sources and intentional use, and, finally, about how often these accounts are balanced (are they checked daily, weekly, yearly etc.). Mental accounting influences choices and although apparently an economic way of thinking, it is often rather irrational: a person may be saving money for the house, but paying lots of interests on a loan just because these expenses are into two different, completely separate accounts. Rationally speaking, it does not make any sense. Money should be fungible, treated the same way (Thaler, 1999).
Investing is particularly affected by this mental bias, it is common among investors to divide their investments between a safe portfolio and a speculative one. This is done in order to preserve the safe portfolio from the possible losses of the speculative one. The net wealth will not be different if he had had a bigger portfolio. It is important to underline that the reasoning behind this behaviour is the fear of losses, implying asymmetry of risk. This aspect will be deeply analysed in the second and third chapters.
Confirmation bias.
It is in human beings nature to look for confirmation evidence rather than disconfirming one, there is a tendency for positive tests in people‘s minds. This bias applies to all fields, from human resources management where candidates are selected according to the characteristics they should have while little importance is given to what they lack. It is a kind of selective thinking that bases on the knowledge we already have about an issue and looks for confirmation and support of this. More attention is paid to information that supports what is already know, whereas little or no credit is given to the rest, leading to a misinterpretation of information and to bad decisions. It is a rather dangerous bias in investing because investors tend to look for information that support their initial idea of the stock, while they tend to avoid information that goes in contrast with what they think. A good practice to avoid the confirmation bias is to always look for another opinion, better if contrasting, before taking a decision.
The issue of perceived control.
The relation between control and perceived risk is a widely studied topic in behavioural finance, as individuals like to feel influential on the outcomes of an event. The two forms of control identified by these social sciences are the external versus internal control and the perceived control. The former, illustrates the degree to which a person is able to control his/her own behaviour, while the latter deals with the perceived control on outside factors that may influence the final outcome of an event (Rotter, 1971).
26 According to MacCrimmon and Wehrung (1988), perceived control in the field of investments makes investor believe that thanks to their expertise, skills, knowledge or abilities the can avoid large losses or bad investments as if there were a sort of control on the outcomes of the investments chosen.
Representativeness.
In order to elaborate information, people tend to start from stereotypes and situations that are somehow familiar to them. People form an opinion of events according to how much they remind them of other events with which we are familiar with.
It is another mental shortcut that however makes it complicated to accurately study and understand financial information regarding investments. According to Busenitz (1999), individual who present this heuristic are willing to develop broad generalizations about a phenomenon based only on a few attributes of the event.
At the basis of representativeness is the thought that the member of a category (for instance, hazardous activity or risky behaviour) should resemble other elements of the same class and consequently resemble also the cause that produced it (Ricciardi, 2008).
Individuals have an intrinsic inclination to make judgments based on the similarity of elements, or to predict uncertain future events according to a small amount of data and drawing a holistic conclusion (Ricciardi and Simon, 2001). In finance, this heuristic finds wide application among investors. Eaton (2000) summarizes it as follows: two companies that report poor results may be both classified as poor companies, with bad management and unexciting prospects. This may not be true, however. A tendency to label stocks as either bad-to-own or good-to-own based on a limited number of characteristics will lead to errors when other relevant characteristics are not considered.
Regression to the mean.
The regression to the mean is a statistical phenomenon according to which if a variable is extreme on its first measurement, it will tend to be closer to the average on its second measurement.
Such instances of regression to the mean occur whenever there is an element of chance in an outcome. For instance, short parents tend to have taller children even though ―common opinion‖ is that they would have short children as well.
Indeed regression to the mean is a very important concept in statistics that has fundamental consequences in finance too. Even so, it is still a counterintuitive concept to understand. Kahneman and Tversky (1973) suggested that the representativeness heuristic accounts for this systematic bias in judgment. People find regression to the mean a difficult concept to logically understand because individuals typically assume that future outcomes (for example, this year‘s sales) will be directly predictable from past outcomes (last year‘s sales).
The tendency is to think that predictions come based on the assumption of perfect correlation with past data (Bazerman and Moore, 2009).
27 In some unusual situations, however, individuals do intuitively expect a regression-to-the mean effect.
Consider for example a student getting always 18 and nothing more. When he/she gets a higher grade, say 30, his or her parents will not expect the performance to repeat in the next exam. Again, when a real-estate agent sells five houses in a month (an outstanding, high performance), his colleagues do not expect equally high sales from him the following month.
In these last two cases, regression to the mean seems to be more intuitive and easy to understand. This happens because when a performance is extreme, people unconsciously know it cannot last.
In unusual circumstances, the expectation is for performance to regress, but in less extreme cases the effect of the regression to the mean is not recognized.
Same thing happens to financial markets: whenever there is a casual component, an element of chance, there is the effect of the regression to the mean. In the long run, the price of a stock always regress to its mean.
The confirmation trap.
People naturally tend to seek information that confirms their expectations and hypotheses, even when disconfirming or falsifying information is more useful.
In order to explain this bias, a simple example may be considered. Supposing the question is to guess what rule underlies a sequence of three numbers such as 2-4-6, results are interesting and granted.
The great majority of people involved in such an experiment normally answer that the rule is writing numbers that increase each time by two.
The experiment is repeated several times until somebody finds the right answer. The idea behind this sequence is write three numbers that increase.
Clearly, this happens because when we see this sequence our mind immediately looks for confirmations.
Whenever we encounter information that is consistent with our beliefs, we usually accept it with an open mind and a glad heart (Bazerman and Moore, 2009).
This experiment was conducted by Wason (1960) and the conclusion drawn were that obtaining the correct solution necessitates ‗a willingness to attempt to falsify hypotheses, and thus to test those intuitive ideas that so often carry the feeling of certitude.
There are two main reasons for which human beings and investors when seeking information fall into the confirmation trap.
First of all, there is the fact that human mind is designed to recall information from memory. It is the way we are made and there is nothing to do about it. People have the tendency to retrieve information, in a natural way. We always look for information in our memory. A shocking experiment was conducted by Loftus (1975) showed that this tendency is so strong that it is even possible to implant somehow people with false memories. In his experiment people were given a movie to watch about an accident. When half of them were asked a specific question about something that was not in the movie, most of them became dramatically more likely to recall seeing this element in the movie.
28 Another reason for falling into the confirmation trap is due to the way in which people seek for information.
There is the tendency to search selectively for information or give special credence to information that allows individuals to come to the conclusion they desire to reach (Kunda, 1990).
So an investor, despite the incredible amount of information available, will inevitably have the tendency to look for information confirming the ideas he or she already has. Sometimes a useful piece of advice would be to look for information that discard the opinion or knowledge one already has about a topic/stock/company in order to get a more complete picture of the scenario.
Gambler’s fallacy.
The gambler‘s fallacy is a consequence of a lack of understanding assumptions and predictions in the field of probability. The common thought that if an event did not happen in the past it will not happen now, is completely wrong and dangerous especially when it comes to investing decision making.
The wrong essence of this fallacy is that past events do not change the probability that certain events will occur in the future.
In economics this is a very common phenomenon, one of the most common (wrong) beliefs is that if a company has performed well in one year, it will perform less well the next year. It is a wrong interpretation of the regression to the mean. Indeed, in financial market as well investors believe that they should liquidate a position in a stock if it has already gone up in several serial trading sessions because they do not think that the position is likely to continue going up. In contrast, other people might stick with a stock that has fallen through different trading sessions because they think ulterior decreases are not likely to occur. As in the coin situation, the fact that the stock has gone upwards for a certain number of sessions does not imply that in the next session it is less likely to go upwards. Investment decisions should be made according to fundamentals analysis and technical considerations.
Overconfidence.
Overconfidence is a typical aspect to be analysed in the financial behaviour literature as it influences the risk perception of investors. It is something that affects decision-making processes and results. According to Weinstein (1980), 93% of American drivers estimate themselves as above the median. Overconfidence is the belief in oneself with full conviction taken to an extreme (Ricciardi and Simon, 2001). Indeed as human beings there is the inclination to overestimate personal skills and abilities, there is the general tendency to overestimate the accuracy of our current knowledge and future predictions. According to a survey by Montier (2006), 74% of professional fund managers think to have offered a performance higher than the average; while the remaining 26% consider itself in the average.
Overconfidence is much stronger when the task considered is difficult, when there is low predictability of outcomes and when the feedback is scarce or not precise. Overconfidence does not allow people to properly estimate risks. There is also a gender effect on overconfidence, indeed men are more overconfident than
29 women, Prince (1993) stated that men are inclined to feel more competent than women do in financial matters.
Furthermore, overconfidence is also about the ―it won‘t happen to me‖ bias. People think of themselves as invulnerable to certain risks and events. Indeed this is what happens with insurances, most of the times people do not make an insurance because they motivate themselves saying ―it won‘t happen to me‖ and only go for it after, say an earthquake, destroys their house. Without knowing that after a major earthquake has occur, it is less likely that another will occur. People only buy insurance after the undesired event has occurred. This effect is also called overestimation of vivid information.
Availability heuristic.
Tversky and Kahneman (1973) have extensively studied availability as a fundamental component of risk perception. This heuristics is concerned with the frequency of an event: people tend to be biased by information that are more easily available to them, easy to recall because it is recent, vivid in their memory or well-advertised. An event is thought of as very probable and likely to occur if they are easy to remember and visualize. This implies that people are lazy on the one hand, because they wait for information coming to them instead of seeking for it, they tend to base their decisions according to more recent information, making any new opinion biased toward that latest news they have.
To avoid the biases coming from this heuristic it is vital to maintain a clear overall picture of the investments and of the whole timing: it is easy to be confused by the latest news and short term approaches to investments and trading often lead to poor results, focusing on the long term is generally a good way to avoid this availability bias. For instance, after an airplane accident occurs, people are more afraid to flight and prefer to go by car, because the memory of the accident is still vivid in their minds, without considering though that statistics show that accidents in cars are way more frequent. This is also due to the extensive media coverage that boosts fear and the perception of risk (Ricciardi, 2008).
Framing.
Framing is another element that is important to present because it influences the perception of risk of investors. Different final decisions may be taken if the problem/investment/issue is presented in different ways. Within the decision making process, framing effects are given by the context in which the decision is taken and the way in which the question is worded and framed (Kahneman and Tversky (1979). The structure of the way a question is presented may indeed generate different results.
An outright example and application of the framing effects is provided with the two following questions:
- Would you invest all your money in a new business if you had a 50% chance of succeeding brilliantly?
- Would you invest all your money in a new business if you had a 50% chance of failing miserably?
These two questions present the same probabilities of event but the framing effect is very evident as question A is more appealing because it soothes the probability of risk and investors perceive risk less from the way it