DOTTORATO DI RICERCA IN
Scienze ambientali: tutela e gestione delle risorse
naturali
Ciclo XXVII
Settore Concorsuale di afferenza: 04/A2 Settore Scientifico disciplinare: GEO/02
TITOLO TESI
Geomorphological and statistical analysis on Ravenna dune fields
changes, based on Terrestrial Laser Technology.
Presentata da: Dott. Stefano Fabbri
Coordinatore Dottorato
Relatore
Prof. Enrico Dinelli
Prof. Giovanni Gabbianelli
1 INTRODUCTION
1.1
Generalities.
1.1.1 Research generalities and purposes.
1
1.1.2 Coastal sand dunes.
2
1.1.3 The dune/beach profile and the waves action.
4
1.1.4 Dune/beach system sand balance.
6
1.2 Dynamic Factors.
1.2.1 Wind flow.
9
1.2.2 Sand transport and moisture effect.
12
1.2.3 Vegetation.
14
1.2.4 Secondary factors.
16
1.3 Coastal Dune Development and Morphology.
1.3.1 Incipient and established foredunes.
17
1.3.2 Blowouts.
19
1.3.3 Dune micro-morphology.
22
2 AREA OF STUDY
23
2.1
Geological History.
24
2.2 Subsidence.
27
2.3 Emilia-Romagna Coastal Zone.
29
2.3.1 Local dune ridges evolution.
30
2.3.2 Coastal Geomorphology Map 2005.
30
2.4 Sites of Study.
2.4.1 Bevano river estuary area.
34
2.4.2 Marina di Ravenna and Milano Marittima area.
37
2.5 The Reference System.
41
3 MATERIALS AND METHODS
3.1
Laser Scanning.
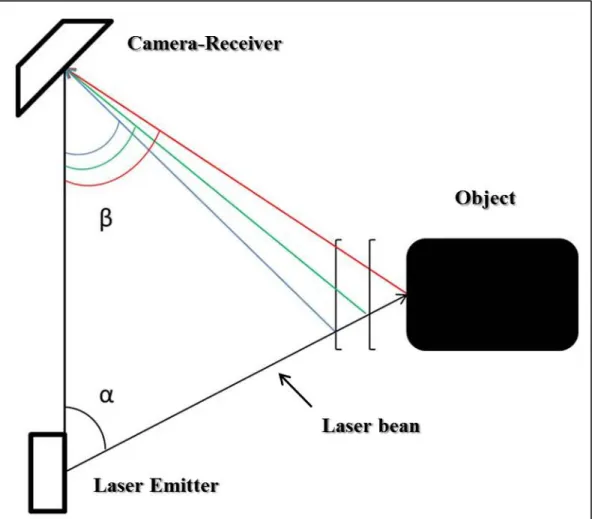
3.1.1 Laser light theory.
42
3.1.2 Light behavior and laser scanning devices.
47
3.1.3 Laser scanning systematic errors.
51
3.1.4 The field methodology, theory and post-processing.
56
3.1.5
The laser scanning method application.
56
3.1.6 Post processing and data improvement application.
58
3.1.7 The applied validation methods.
60
3.2 The Morphological Analysis: Units, Sub-zones and
their Variation.
3.2.1 GIS environment processing: volumetric calculation,
morphological analysis and DSAS application.
64
3.2.2 Morphological Sub-zones.
73
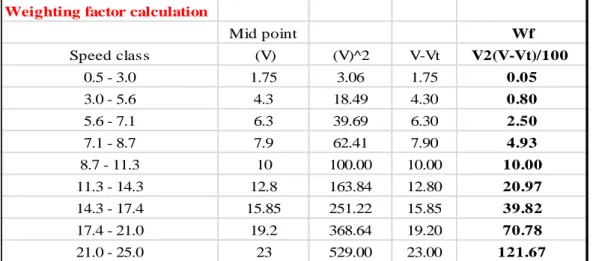
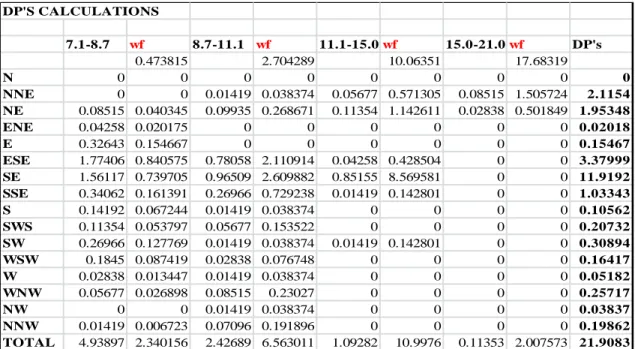
3.3 Potential Sediment Transport via Fryberger and
Dean’s Method.
3.3.1 Theory.
75
3.4 Meteo Data Analysis and Multivariate statistic (PCA).
3.4.1 Meteorological data analysis.
87
3.4.2 Multivariate statistic and Principal Component 90
Analysis (PCA).
3.5 Computational Fluid Dynamics (CFD).
95
4 RESULTS
4.1 Terrestrial Laser Scanner.
4.1.1 Validation tests results.
99
4.1.2 Morphological units, Areas of Interest and morphological
sub-zones.
104
4.1.3 Volumetric differences results.
111
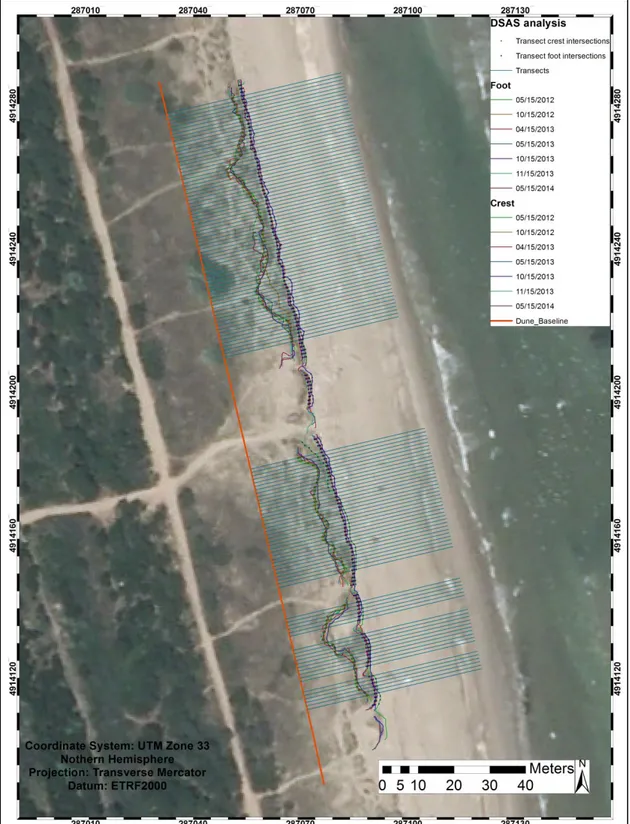
4.1.4 Digital Shoreline Analysis System (DSAS).
113
4.2 Meteorological Data and Forcing Factors.
116
4.3 Grain Size and Drift Potential Results.
120
4.4 Principal Component Analysis (PCA).
122
5 DISCUSSION
5.1 Sand Grain Size Analysis.
128
5.2
Aeolian Data Analysis.
129
5.3 Terrestrial Laser Scanner Discussion.
5.3.1 Validation tests.
134
5.3.2 Volumetric seasonal monitoring.
136
5.3.3 Morphological analysis: two examples of investigation. 141
5.3.4 The DSAS analysis.
148
5.4 Principal Component Analysis (PCA) Discussion.
154
5.5 Computational Fluid Dynamic (CFD) Discussion.
157
6 CONCLUSIONS
6.1 Terrestrial Laser Scanner.
6.1.1 Validation tests conclusions. 160
6.1.2 Seasonal volume survey and morphological Sub-Zone analysis. 163
6.2 Meteorological Data and Multivariate Analysis.
6.2.1 Aeolian data conclusions.
167
6.2.2 Principal Component Analysis (PCA).
169
6.3 Digital Shoreline Analysis System (DSAS) and
computational Fluid Dynamic (CFD) conclusions.
170
References.
172
Appendix I: Morphological Units maps.
I
Appendix II: Morphological Sub-Zones.
XIX
Appendix III: PCA R script.
XXVI
1 INTRODUCTION
1.1 Generalities.
1.1.1 Research generalities and purposes.
Data collection for this study started in May 2012 and ended in May 2014 and it was entirely located in Ravenna coastal area. The focus was on sand dunes.
The principal purposes were substantially two: on one hand the author tried to investigate the Terrestrial Laser Scanner (TLS) possibilities as a tool applied to environmental monitoring. This powerful device indeed has been already used in this branch during last decades (i.e. Hodge R., 2010; Hoffmaister et al., 2012; Lague D., 2013), for many different environments (caves, rivers, dune fields, etc.) but its application is still lacking of a proper temporal and spatial scale. TLS has the possibility to reach an accuracy much higher than many other devices, in order of centimeters, thus it should be used.
First of all, in order to fill this gap, set of validation tests was put in place. This allowed to evaluate TSL data out of any doubts. Anyway this study is not be limited to test the specific device used, but try to propose a method to evaluate the reliability of any 3D monitoring tool (laser scanners, photogrammetry, multispectral images, etc.).
The next step was a seasonal monitoring campaign focusing on dunes volume oscillations. Then the analysis detail was increased, in both spatial and temporal scale, analyzing different dunes features, and reducing surveyed periods, all supported by the use of statistical tools.
It is important to highlight how difficult the sand dunes environment is to be studied. The next paragraph will explain how dynamical forces involved in this milieu are so strongly intertwined to make really hard their identification and definition, in terms of force and effects.
This introduces the second purpose which moved this research: the need of new features to survey and new tools to be available for environmental monitoring and management. In last years indeed many were the tries to find indexes or morphological
features which could help in this sense, with ambiguous results (i.e. Brunelli V., 2008; Montreuil A-L, 2013; Keijsers J., 2014)
This research tries to add some new ideas and proposals to reduce this problem, to have more realistic data able as much as possible to describe the real-world condition and the coastal dunes dynamic behavior.
1.1.2 Coastal sand dunes.
Any sand accumulation specifically due to the wind could be named “Dune”. Some authors think that the word itself “Dune” comes from Latin, “dunum”, and would mean “castle over a hill”, some others from the Irish “Dun”, “hill”. In any cases the dune is characterized by its different elevations features relative to the landscape.
According to Maun (2009) this kind of elements could be found in three particular environments, very different one from each other, but all equate by the presence of sand: river valleys, where floods can overflow river banks and deposit sand in the landscape, where later it is dried and shaped by winds; in desert environments, where the weathering of sandstone produces a large amount of sand which is subject to mass movement by wind; in sea coast regions, more frequently in temperate climate, less in tropical and sub-tropical. In this chapter only coastal sand dunes will be discussed, trying to describe all the complexity of their morphologies and their dynamics.
According to Martinèz et al. (2004), Coastal dunes are Aeolian landforms that develop in coastal zones where the general conditions guarantee an ample supply of loose, sand-sized sediment which must be available to be transported inland by the wind.
Three are the most important factors that dominate the dune evolution and morphology: the sea, the wind and the vegetation. The sea has a multiple role in this system: on one hand it is the first source of sand, on the other it is a factor that strongly influences morphology, in term of erosion due to storm waves which hit the dry beach. The wind is a chisel which erodes or deposits sand depending on its force and its interaction with morphological features of the topography. The dune vegetation is one of the most exemplifying cases of integrated biology: in this particular environment the biotic component, such as vegetation, is not only an ecological complement, but it is a
fundamental part of the structure itself of the dune, and of its dynamic. Vegetation effect starts with the consolidation of the soil, thanks to the roots action, and continues with forcing the deposition by cushion wind velocity. Moreover, vegetation has the effect to transform soil, enriching it with nutrient elements, thus there is a strong connection between the dune morphology and the phito-sociological successions which can colonize that environment. They basically evolve together.
The dune’s importance is nowadays recognized by the whole scientific world for different reasons: first of all these morphological elements are the result of a complex sea-sand-wind-vegetation dynamic, and they reflect and monitor these dynamic forces, thus studying dune field behavior can be very helpful to understand this environment evolution. Moreover they are fundamental for the beach management, in terms of sediments store, protection from storm surges, as filter for rain water and barrier against salt water intrusion (Mollema P., 2008). From an ecological point of view, specifically in terms of biodiversity, sand dunes have a double absolute value: they are an ecosystem of transition, thus, as well as every other eco-tone, their extension is limited by their own characteristics, so for the living species linked to these environment (in this case, most of all migratory species) they become vital; furthermore sun, sand, salt, wind and surge make this an extreme environment, which selects species with extreme adaptations, thus rare.
Considering dunes from both an ecological and a physical/morphological point of view, these elements represent a buffer zone, what is called an “eco-tone”, a transitional ecosystem between land and sea environments: coastal sand dunes could be interpreted as the most stable part of the beach and the most unstable part of the land. This is one of those ecosystem which allowed to evolve in a (as much as possible) natural way, would rewards the humankind with not only cultural/landscape contents but also with strictly economics values (just thinking about the protection from storm surge could make an idea of it).
1.1.3 The dune/beach profile and the waves action
Genesis and evolution of sandy beaches are related to the geological conformation of the neighbor areas, the sandy sediment supply and the littoral drift acted by tidal waves and currents. Sediment source could be a near river estuary, the erosion of contiguous beaches or underwater bars in front of the beach. In any cases waves and flows are protagonists of the “wet” part of the beach system, while wind (and vegetation) is the dominant force of the dry (sub-aerial) part.
According to the Short and Woodroffe’s schematic diagram (2009) shown in figure 1.1, describing this environment profile, the most important elements are:
The near shore zone: the area from the spot where waves starts to interact with the sea bottom, to the waves’ first break.
The surf zone: defined by breaking waves and delimited, landward, by the intertidal area (“swash zone”).
The subaerial beach, which lies between the swash limit and the low tide line.. The landward limit of the sub-aerial beach is represented by the coastal sand dune.
Waves are generated by the wind which, blowing on the sea water table, transmit a part of its energy to water particles and induce a movement; the latter is mostly vertical in depth water, while approaching the shore tends to transform itself in a horizontal movement depending on the slope and orientation of the sea bottom and its depth.
Tidal waves are the gears of the sand conveyor belt which works between the foreshore and the backshore, because they can use their kinetic energy to climb the aerial beach and bring a sediment loan.
According to Pranzini (2004), the beach, under the waves actions, responds assuming a morphology which let the best dissipation of energy, depending on the grain size and the sea conditions. This dynamic classifies beaches in three different types:
Reflective beaches: coarse sediment and low energy waves, which are almost completely reflected to the sea. The typical morphology is narrow and steep (without dunes).
Dissipative beaches: high energy waves and fine sediment. Much of the incoming energy is dissipated and the landscape is typically flat and wide, in the sub aerial zone, while it is characterized by bars in the near shore zone.
Intermediate: between the two extremes above.
It is assumed how this dynamic makes the beach profile reflecting the sea “climate” (Hesp, 2012). This mechanism in effect, can fluctuate during different seasons depending on many meteorological factors. In any cases, the morphological relationship between the sea conditions and the beach aspect is so strong that many authors treat about a winter and a summer profile (Seymour J., 2005). These are the two extremes of a theoretical model, which has some lacks, but it resulted to be very realistic, especially at some latitudes (such as Mediterrean sea).
During winter, storms wave energy should be high, so that they can take in charge a huge part of the beach sand and bring it back to the sea: the so called “storm profile” includes narrow subaerial beaches with landscape dominated by strong slopes. During summer the situation is the opposite, and wake tidal waves are more prone to deposit the sand they transport rather than eroding some other from the beach: this makes the beach landscape more smooth and it is called “swell profile”.
Obviously once the sand get into the aerial/sub-aerial system it is pretty easy for it to become part of the dune body (entering in the wind cycle). According to Hesp (2002) the seasonal dominance of wave over wind process can alter the predominant behavior of a dune: during storm periods (with significant sedimentation and change) the wind deposition was found to be minimal (Arens, 1996).
1.1.4 Dune/beach system sand balance
Every beach system is crossed by a sediment flux which links it to the adjacent coastal sectors and to the frontal near shore. This sediment balance is determined by three principal elements:
Sediment input: the most part of sediment entering into this system is carried by the river network and is strongly influenced by its condition and all those human activities that influence its transport capacity.
Along shore movement: this is due to littoral currents and to the oblique waves fronts; usually the volume of sand is moved from a sector to the contiguous one, thus in natural condition, the sediment total balance in not influenced by this dynamic. It becomes a problem when human infrastructures for the coastal defense modify the system lateral continuity.
Sediment output: in last decades many researches have highlighted how the sea level rise, making simultaneously rise the sea bottom too, is the main natural cause of sediment output (much more than waves’ action). Anyway the human impact is the responsible of the most damages.
The strong connection between the dune and the beach was highlighted by Psuty (1988), who proposed a model that links the overall sediment balance affecting both systems. According to this author sediment circulation could extends from the offshore bar, through the dry beach and onto the dune, where vegetation trap it and each component of this system episodically can release or store sand as answer to the general pattern oscillations.
In this sense both the beach and the dunes are forms of sediment accumulation and they respond with morphological answers to the short and long term sediment balance:
the beaches can widen and narrow, while the dune can react varying the height and the relative width. Beach and dune can be considered as two separate components of the same system.
The model in figure 1.3 describes the possibilities from a very high sediment input to a very low one. In a positive sediment balance (the upper half of the diagram), dune dimension is inversely related to the rate of beach accretion (Psuty, 2004).
Figure 1.3: Morphological dune/beach continuum (modified from Psuty, 2004)
This is the basic concept of the model: high rates of shoreline progradation are enemies of the dune development, because of the lack of time for sand transfer into the land; as this mechanism slows there is an increase in dune dimensions. In the second part of the diagram, the transgressive portion, the supply of the beach suggests an opposite behavior of the system in these conditions: at some point the loss of sand is more than the accumulation by the dune, thus wash-over and sand sheet (thus outputs) will dominate this side of the continuum. Although this model is nowadays worldwide accepted, the author himself recognize a problematic component, when the balance is stable or minor negative, because numerous evidence demonstrate the possibility of well-developed dunes on eroding coasts (Psuty, 2004).
Always according to Psuty (1989), a first dune classification can be done basing on sediment balance:
Primary Dune: it represents the most seaward part of dune (the “foredune”) and it is very active in exchanging sediment with other components of the profile. Its presence indicates a positive sediment budget, but at different time scales, it could be in negative or neutral balance too. It is the most dynamic part of the profile and it usually has a ridge form.
Secondary Dune:
o Active: it is the evolution of the primary dune, created by its modification and the transfer of sand inland. Its morphology is much more complex than primary dunes because of the active migration of sand, which is highlighted by deflation hollows and parabolic morphologies. It usually assumes a transgressive ridge form.
o Stable: these forms usually have been stranded by the system, due to the beach progradation, and then they become stable thanks to the vegetation during their passage inland (as active-transgressive form). They are linear and represent a paleo-feature that retains the morphology of the dune but is not being maintained by dune formational processes (Psuty, 2004)
Sand sheet/Washover: areas with no primary dune or any dune form, where the inland transfer of sand is very active. They can be found, for example, in correspondence of a pre-existing wash over or very strong on shore winds impede the formation of retention structures.
1.2 Dynamic Factors
1.2.1 Wind flow
In the sub-aerial beach system, wind force represents the engine that pushes sand inland, thus it can be considered the fundamental mechanism that leads to the dune morphological development. According to Hesp (2004), this component, in terms of sand transport, is controlled by several key factors: the magnitude and frequency of transporting winds; the influence of incident wind direction; beach fetch effect and sediment supply; vegetation type and density; moisture content. This ascertained theory introduces the two scales of influence on dunes development, by wind: at high detail, the wind climate, at small detail, the ground wind behavior.
The wind climate of a region influences drastically Aeolian landforms, for what concerns their existence, evolution and morphology. It describes not only which winds are most frequent (regnant), which reach most high velocities (dominant), but also the angle of incidence with which prevalent winds blows on shores, thus on dune ridges.
Onshore winds are those that come from the sea to the land, offshore winds are those which blow in the opposite direction and, at last, along shores winds, which blow almost parallel to the longitudinal axes of the dune ridge. Obviously in coastal science, these terms are referred to the shoreline, but in this study treating about shoreline foredunes ridges, they can be referred to the dune as well.
It is pretty intuitive understanding how onshore winds are more effective than any other: first of all they blow in the “right” direction (from sea to land), thus they can take in charge sand from the beach and transport it to the land and the dune; moreover they usually reach highest speeds because of the fetch effect related to blowing on a clean surface (the sea) without obstacles. Not every onshore direction has the same effect: winds approaching the dune with an angle of 15-60° are usually deflected, while winds approaching with an angle higher than 60° are deflected parallel to the dune: angles low to moderate of wind approaching are responsible for localized accretions, especially on the upwind slopes, on crests and blowouts (Hesp P., 2004). This is one of the most important processes increasing topographic variability.
Offshore winds have an opposite behavior blowing from land they do not find bare sand on their path, fact that decreases their transport potential; furthermore it is much easier for offshore winds to be slowed down by obstacles, such as urban buildings or natural features. Anyway they are considered to be important because of their contribute in increasing topographic variability.
Alongshore winds place themselves between these two “extremes”, they are much more effective than offshore winds, but much less than onshore ones, anyway their role in beach/dune dynamic is still hard to investigate and understand.
For what concerns near-surface airflow, it is important to consider that wind vertical profile in ideal conditions, is logarithmic (Hsu, 1988): this means that wind velocity tends to increase with elevation and that the profile changes in relation of the topography, and so it is for dunes (figure 1.4) environment.
Figure 1.4: Wind logaritmic profile on dune (modified from Hsu, 1988)
In this work Hsu proposed a general model for onshore airflow. According to this model going from sea to land, first there is an area of underspeed onto the seaward
side of the dune; the crest part and the upper landward slope are two areas of acceleration of the flow; the lower landward slope which is another area of deceleration. Many other authors modified this model to make it fit with the real-world behavior, especially for what concerns foredunes: Arens (1995) has found that wind flow is topographically accelerated over foredunes, especially up stoss slopes, and over crests; Hsu (1977) has understand how flow compression and acceleration in foredunes of virtually any height.; Hesp et al.(2005), highlighted that the principal sand deposition on a foredune varies markedly depending on approaching wind speed, vegetation cover and topography variations.
Figure 1.5: wind behavior on different morphological zones (modified by Barrere, 1992).
The basic principle which govern this pattern is a simple mechanism picked from the fluid dynamic, more specifically the “Bernoulli’s Effect”, which claims that for a fluid flowing in a confined system, the product of the speed for the area of the system section must be constant in every moment. This means that if the section decreases, the speed must increases: that is exactly what happens when wind bump into the dune (figure 1.5), and that is fundamentally why it accelerates on the foredune scarp and on the crest.
Another aspect to consider is that wind velocity moving on a sand surface is decreased by friction. The wind velocity profile shows how the speed decreases with height and it reach the zero at a height which is not zero. This height is called “surface
roughness constant”, abbreviated to “k” by Bagnold (1960) and z0 by Olson (1958). K
constant decrease when wind velocity increases (Deacon 1949) and vegetation obviously has a strong influence on its dynamic. The logarithmic relationship between speed and height, at last, can be expressed by the Prandtl von Karman equation (1935):
𝑈𝑧 𝑈∗
=
1 𝐾𝑙𝑛 [
𝑍 𝑍0]
Equation 1.1 Where:o Uz: wind velocity at height of z
o U* is the shear velocity (it is going to be explained in next paragraph)
o K= von Karman’s constant (0.4)
1.2.2 Sand transport and moisture effect.
Before explaining the role of vegetation, it is helpful to understand how the sand is moved within the system. It is intuitive how sand mobility is strictly linked to its moisture content, because water increases sand weight and cohesion.
In any cases usually the material deposed by waves is dried by sun and wind, thus it can be transported (by wind). The basic mechanism is substantially dominated by wind speed in relationship with sand grain size. In any cases, once started the physical movement of sand grains, it can involve substantially three processes:
Suspension: wind carries up those grains whose size is thin enough be suspended particles into the air, as dust (Bagnolt 1960).
Saltation: this mechanism seems to be the major force that moves sand in coastal sand dunes environment (Maun, 2009). To move sand grains, the wind has to hit them with a properly force or “Shear Velocity” (U*): this
force must exceed a “critical shear velocity”, which is related to the root of grain diameter. The shear velocity is logarithmic proportional to the slope of the wind velocity profile. Once a grain is moved it tends to be moved forward until it reaches the same speed as wind, but contemporarily it loses height because of the gravity. According to
Bagnold (1960) this mechanism makes the sand trajectory elongated and curved, falling down with an angle of 10-16°. This fall causes a chain reaction inducing many other grains to be ejected with the opportunity of starting another saltation events. The greater is wind velocity, the greater is the height reached by the sand, the greater is the force of falling grains, thus of the chain reaction too.
𝑈
∗= √
𝜌𝜏𝑎 Equation 1.2
Where:
o U*: Shear stress velocity o 𝜌𝑎: Air density
o 𝜏: boundary shear stress
Surface creep: grains which are too large to be moved by bare wind force can be pushed by other falling particles, if the energy in game is high enough. It has been proved that an high-speed grain of average dimension can move a particle six time its diameter (Maun, 2009).
The moisture content of sand influences the sand capacity of movement across the beach primarily increasing the threshold shear velocity and, consequently decreasing the sand transport rate. This is acted thanks to the capillary force which draws sand particles together, and it is a direct function of moisture content of the soil. Thus, when wind flow exerts a shear drag on the moist sand, it will have to apply an additional force to beat the cohalescence force too.
Hotta (1994) expressed a mathematical expression to quantify the moisture influence and showing it linear correlation:
𝑈∗𝑡𝑤= 𝑈∗𝑡+ 7.5 𝑤
Where:
Always according to this author the model works only for sand whose grain size goes from 0.2 mm to 0.8 mm, and a moisture percentage until 8%. Surface moisture content on a natural beach is dynamic and it varies drastically is in time and in space.
1.2.3 Vegetation
It is known that vegetation is a fundamental part of the dune structure and has a vital role in its evolution. Their double action on the environment, soil consolidation and wind speed slowing down are two basilar mechanisms of dune development, especially for what concerns first states of dune life.
Vegetation can colonize a dune area by discrete seedling germination on the back shore, by colonization from parent source areas or by laterally continuous germination (for example on the reckline). In any cases, plant usually colonizing these environments follow a phyto-sociological succession which starts with pioneer species.
These organisms allow the germination to many other vegetal form, from grass to trees, starting the modification of the soil: the ground consolidation made by roots and its nutrient enrichment.
For what concerns interactions between vegetation and wind, four are the most important vegetation feature: form, height, density and distribution (Hesp P., 2012). Those are linked to the shadow effect the plants have on wind flow (figure). This mechanism represents the born of a new dune, starting from a form called “Nebka”, which is also known as “shadow dune”. From this point to the most complex morphology, the vegetation leads the development behavior, influencing the wind flow logarithmic profile, depending on its density. This influence is particular on the near-surface velocity, reducing the bed shear stress. According to Hesp (1989) plant density is the most influencing factor: once sand pass the leading edge of a
Figure 1.6: Wind flow bumping into a Plant.
plant canopy, deposition occurs. The higher is plant density, the more often this happens; moreover the degree on near-surface flow penetration decreases, drag increase and the rate of downwind deceleration increases (Hesp, 1983). A high density vegetated dune traps most of incoming sand: this is the process which allows the dune to grown vertically in places.
Plant height has a similar effect on wind flow and a similar proportional correlation, and thus which species are present become a very important factor. At last, plant distribution influences wind flow and deposition, because vegetation tends to germinate in a random fashion.
Figure 1.7: Wind logarithmic profile in tunnel (solid line) and in presence of vegetation (dotted line) (modified from Olson J., 1958)
What makes this system unique is the positive feedback between all these variables: for example, where plant density is high, sand deposition will be strong and this will encourage the growth of more plants, which are going to increase the shadow effect and related deposition.
There are a lot of mathematic equations in literature, which try to model the vegetation effect on airflow, but these will not considered in this study because this fall outside its purposes. The author will limit to highlight how the vegetation component principally affects the Z in wind logarithmic profile (equation 1, Chapter 3).
1.2.4 Secondary factors.
Beyond the principal factors, there are many others which locally influence dune evolution. According to Hesp (2012) five are the natural secondary factors, for the most part related to the sea conditions and the waves’ action:
1. The frequency of swash inundation, which has the effect of killing all the vegetal species which do not tolerate regular wetting or inundation by saline water. This can have a strong influence on the long term dune morphology (Hesp, 2002). 2. Storm wave erosion: beyond the obvious same effect of the factor 1, this has a
direct impact on the dune in term of erosion, to various degrees.
3. Overwash incidence, which have the same effects of both swash and storm waves.
4. Rates of progradation or retrogradation (of the beach): this especially affect the dune width and its height; the latter is in a positive curvilinear relationship with the progradation (Hesp 1989).
1.3 Coastal Dunes Development and Morphology.
In literature there are innumerable definitions of “coastal sand dunes”. An interesting and complete one, in the author’s opinion, was enunciated by the Virginia Marine Resources Commission in the Coastal Primary Sand Dune Protection Act, in 1980: coastal sand dunes can be defined as a mound of unconsolidated sandy soil which is contiguous to mean high water, whose landward and lateral limits are marked by a strong change in grade and upon any part of which is growing a minimal number of species associated with dune environments. In 1986 Hesp described four types of coastal dunes: foredunes, blowouts, parabolic dunes and transgressive dunes. In order of the purposes of this study only the first two types are going to be treated.
Figure 1.8: Foredune ridge at Coorong National Park, South Australia.
1.3.1 Incipient and established foredunes
According to Maun (2009), three are the essential requirements that have to be satisfied to have costal dune formation: a wind regime dominated by on-shore winds, a continuous sand supply and obstacles to reduce wind velocity and to induce deposition.
Beyond these general settings, the evolution of a dune starts from the shadow dune state: if a sand hill is able to overtake this passage, then it can become a “Foredune”. Hesp (2002) defines this element as “shore-parallel dune ridges formed on the top of the backshore by aeolian sand deposition within vegetation”. From an evolutionary point of view, foredunes are classified in two types: incipient and established.
Incipient foredune, also called “Embryo dune”, represents the natural development of Nebka, and typically can be found in three different morphologies: ramps, which can be created by germination of seeds on a seaward sloping backshore, by rhizomatous plants growing seaward from landward or by the colonization at the base of a dune scarp which gradually accretes; terraces are formed by a rapid plant growth on a rapidly accreting beach, or when the seaward plant growth equal the accretion rate; ridge forms are typical of beaches where accretion rate is rapid (relative to plant growth) or where plant density and height are both high.
The natural evolution of an incipient foredune is to become an established foredune: this process starts as embryo dunes are enough vegetated to be “stabilized” and soil development begins. Carter and Wilson (1990) found that the transition between the two stages last from 5 to 8 years, however this time depend on many variables. Established foredune are distinguished by the growth of intermediate/woody plants and by their greater morphological complexity (which includes height, width, volume and geographical position).
In any cases their morphological development depends on several factors as sand supply, degree of vegetation cover, plant species present, thus climate a bio-geographical region, aeolian sand accretion/erosion trend, wind and sea forces, storms and over-wash processes and the extend of human impact and use (Hesp P., 2002).
In a long time scale, the evolution of the system considers a series of dune ridges, where the first is still active, as well as the embryo dune in front of it, while the subsequent ridges represent later stages in evolution of the whole sand dune system. The possibility of development of these forms is connected to the general features of the beach-surf zone: dissipative beaches allow the dune to become larger (maximum potential sediment supply), while reflective beaches produce smaller foredunes.
Hesp (1999) described how a foredune can evolve: according to his theory the foredune state can represent the stable state on which a dune pass most of its life, but it
can be also interpreted as an intermediate passage in an evolutionary sequences which foresees Aeolian erosion, vegetation reduction and waves impacts.
This sequence includes five stages from a morphological continuum form, to an almost complete erosion. Intrinsic features of the dune/beach system can make the dune jump some stages, for example in correspondence of catastrophic events (huge storms), but it is expected also the possibility to stop erosion and (with some limitations) to proceed back on the sequence.
1.3.2 Blowouts
Most authors define a blowout as a trough (narrow and deep), saucer (semicircular but swallow and wide) or cup (semicircular and deep) shaped depression formed by wind erosion on a pre-existing sand deposit (Hesp, 1996). Usually blowouts present some morphological characteristic elements: lateral erosion walls, deflation basin and a depositional lobe, landward (figure 1.9).
Figure 1.9: Blow out morphology: laser scanner 3D reproduction (Marina di Ravenna); it can be seen the deflation basin, the erosion walls and the depositional lobe.
This erosional element can be born in every type of dune, at any latitude, usually in low vegetated areas. There are several causes, natural and anthropic, which can start
the blowout creation: animal gazing or digging nests, wave erosion and slumping, vegetation removal in different areas, topographic acceleration of wind flow over the crest, sand inundation and human impact (for example pedestrians).
In any cases just a little scar in the dune body is enough to develop a huge erosional form. This is due to the intrinsic characteristic of the force that creates blowouts: the wind flow. Remembering what wrote before about the Bernoulli’s effect, it became easy to understand what happens here: blowing in a section with a lower width the wind flow is accelerated and increases its erosional power. This is a part of the dangerousness of blowout: the mechanism that generates them is “self-powered”, thus the more the wind digs, the less wide become the section, the faster the flow blows. In 1996 Hesp and Hyde proved that wind speeds in blowout can be significantly greater than remotely sensed wind speed.
Figure 1.10: View of a wide saucer blowout in Coorong National Park, South Australia.
Starting from this basilar process, many authors in past years tried to study the interesting flow dynamic of wind blowing into blowouts. In 1981 Hails and Bannet found that the wind flow within the blowout is separated in many different flow streams directly influenced by the angle between the approaching wind flow and the blowout
entrance: the more they are normal to the blowout the higher speed is reached. Beyond the separation mood of the flow, it was often observed as morphological effect, the presence of a nebka at the entrance area (Carter et al., 1990).
In any cases the erosion/deposition process occurs in a complex manner related the varying wind speeds and directions: the flow separates as it enters the blowout and then, depending on several factors, it forms different turbulent flow (for example an helical flow or a reverse rotor flow). Usually the most common effects of this topographically accelerated flow accompanied by turbulent jets, is deepening the deflation basin and enlarge the erosion area; Carter (1990) described the roller vortices transporting sand out of lateral walls forming rim dunes, and through the middle axis creating a depositional lobe parabolic shaped or radial (depending on the initial type of blowout). Mid-axis flows are usually the highest for speed: on a transverse plan the wind profile is Gaussian decreasing outwards. Moreover when it exits landward it is subject to a strong deceleration and a flow expansion causing the depositional lobe creation.
In most cases blowouts grown in length upwind against the prevailing wind (Jungerius et al, 1989). According to Hesp (2002) blowout width is proportional to the depositional lobe length, in a ration of around 1:2: as a blowout become wider it becomes longer as well.
Blowouts evolution is related to several factors such as aeolian climate, beach/dune erosion pattern, high energy events, and many others (Hesp, 2002). In many cases they tend to become a parabolic dunes, but in some cases it is possible for them to stop the erosional trend thanks to an occasional re-vegetation.
1.3.3 Dune micro-morphology
Considering all the dynamics in action in this environment, it is easily understandable how the dune morphology became really complex. In this study the author tried to describe specific behavior of particular morphological units, which are going to be described in this paragraph. Taking inspiration from the 1992 model published by Barrére (figure 1.11), the author identify some morphological feature which could be representative of the dune dynamic behavior.
Figure 1.11: Dune morphology scheme (modified from Barrére P., 1992)
The dune foot is the most forward part of the dune and it can be interpreted as the line of contact between the dune system and the beach system. What characterizes this element is the drastic change of slope crossing it. As seaward limit of dune, it can be representative of progradation/retrogradation by the whole system.
The crest is represented by the dune highest elevations; in analogy with the dune foot line, the crest line joins the highest elevation points, but it is expected that it is much more conservative than dune foot (Psuty, 2009).
Moving landward, the next morphological element is the landward “foot”, which is called “talus” and is consistently smoother, such that an upper and a lower limits are identifiable.
Passed this feature usually begins a depression limited landward by the vegetated dune line, after which habitat raises and became the vegetated dune (“fixed dune”).
All these features are distinct morphological elements and individuates particular sections of the dune body which have a different dynamic behavior and a different response to the vary forces acting in this environment (wind, sea and vegetation).
2. AREA OF STUDY
This study was developed sampling data from three particular areas in Ravenna territory, located on the North Adriatic coast between Venice and Ancona (about a hundred kilometers from both). The Ravenna area is raised a few kilometers South of the Po river delta, the most important river of Italy. The three areas are located onto the coastal zone and they cover almost the whole coastal Ravenna belt from the most North site, Marina di Ravenna, to the most South, Milano Marittima, passing through the Bevano river natural area. In figure 2.1 the national/regional area can be consulted.
2.1 Geological History.
From a geological point of view, the zone including the three site of study is the most South-East part of a wider macro-region represented by a flood plain created by the Po river, called “Padan flood plain” (“Pianura Padana”), which took place starting from the Oligocene/Miocene, when the Apennines mountain range emerged.
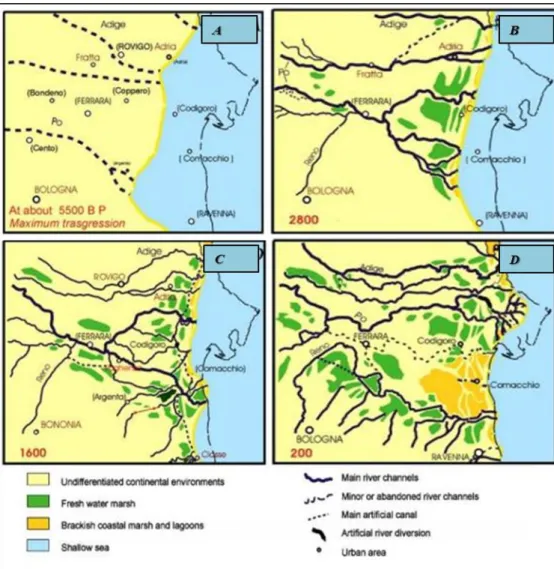
After this the geologic evolutional event, the system was dominated by dynamics linked to the sea level oscillations and consequential complex depositional conditions. During the Last Glacial Maximum (70.000 – 18.000 years ago), the sea level was lower than actual of about 120 meters: the North Adriatic zone was a wide flood plain whose shoreline was located approximatively in the Ancona area (Correggiani, 1996), and the zones between Ancona and Pescara were characterized by wet lands and lagoon environments (figure 2.1).
At the end of the Wurm glacial period, the general climate started to heal, getting warmer, and it brought a decreasing of glaciers and, consequentially, a sea level rise. 5.500 year ago, the climate Optimum was reached and the sea level went into a high standing phase, characterized by a strong shoreline backing to the lowest areas of the Padan Flood Plain, about 20 km inland relative to its actual position. Amorosi (2005) observed within high-stand deposit the lateral contiguity of peat sediments (4000 years ago), which indicates a marsh/wetland environment.
In last 2400 years has prograded for 11 km, on an 80 km of coastal band (Cremonini, 2007). Figure 2.2 proves this situation: fossil traces of paleo dune fields are clearly seeable, disposed on arcs, in the inland. From the most ancient and most inland dune field, dated XII-XI sec. B.C., moving to the actual shoreline, it is possible to individuate the VII sec. B.C. formation, and those developed between the V and II sec. A.C., VI and X sec. A.C (Bondesan et al., 1995). 3000 years BP the climate conditions turned colder and wetter, thus the Padan flood plain was passed through by a hydrographic network much denser. Between 2500 and 1500 years ago the climate turned warmer but the general hydrographic condition stand stable. It was a heavy rainy period thus many river channel overflowed towards more depressed areas, creating a huge zone of lakes which slowly turned into wet lands.
Figure 2.2: Digital Elevation Model of Ravenna territory: paleo dunes and paleo river channels are figured in red (Regione Emilia-Romagna Cartography, 1999)
Starting from 1500 years B.P., climate general conditions got worse, reaching its climax during the period between VI and VIII sec. A.C., which is called “Little Ice
Age”. In this period river estuaries became stable and stopped their pro-gradation. The current configuration of the system is the result of these natural processes and what humans did basically in last 400 years, especially for what concerns hydrographic basins regulation. The latter strongly influenced the river regime and its loan of sediment distribution. Many authors have discovered how estuaries geometries are under a constructive trend until 5 centuries ago, then they turn in a “destructive” one, and the forms are dominated by wave erosion and littoral drift. Nowadays thank to the strong decrease of sediment contribution by rivers (due to the human civilization), that domain of the sea on this zone is consolidated: dunes and beaches systems along the Ravenna coastline, are subjected to an erosional trend. In figure 2.3 a schematic draw of the Padan Flood Plain evolution can be consulted.
Figure 2.3: recent regional evolution of the shoreline. From the Maximum Transgression (5500 years BP) to 200 years ago. (modified from Stefani & Vincenzi, 2005).
2.2
Subsidence.
It has been calculated that the average subsidence speed in the Ravenna area, for the whole Quaternary, varies from 1.8 to 3 mm/year (Bertoni et al., 1988). This intense phenomenon is due both to deep tectonic causes and the differential compaction of the Pliocene-Quaternary sediments.
Unfortunately this averaged calculation is destined to a marked increase if the period taken in consideration is limited to the last 40 years, when the industrialization of the area started. In this period anthropic activities became forceful, especially those related to the fluid extraction from the subsoil (water and hydrocarbons) for the industry need; simultaneously the hard management of numerous rivers which cross the Padan flood plain caused a reduction of sediment which before used to fill the coastal area. From 1972 to 1977 the average speed value was about 40/60 mm per year, with a highest value of 110 mm/year.
In the 1981 the Regional Agency for the Environment Protection (ARPA) staged a subsidence monitoring network which recorded a considerable quantity of data about its trend: during the 80’s the subsidence started to decreases and nowadays the tax varies from about 3 to 8 mm/year. During this period the potable water network was connected to the macro-area network, thus the extraction of water from the subsoil was almost stopped.
This situation is very dangerous for a coastal area as Ravenna, in terms of risk of inundation. This risk is amplified by two problems: on one side, the eustacy for which the sea level has raised about 1 mm/year in the last century; on the other side some coastal areas, corresponding to gas wells for methane extraction, are sinking with a 10 mm/year tax.
In spite of this, Carbognin (1984) have discovered that even if gas wells effects have a strong influence on the risk dynamic because of their position, they do not induce the most critical situation on the local territory, which instead is located in correspondence to the industrial zone and where the extraction of water still continues (causing the depressurization of the aquifer). The water extraction in effect causes a decrease of the interstitial pressure, which makes heavier the load on sediment; this
causes an elastic deformation of the soil and usually an additional compaction of sediments.
In conclusion the subsidence is the main problem that the Ravenna territory faced in last 50 years. Many areas both inland and on the seaside are under the sea level, and the whole territory is under unstable condition.
The geological Survey Office of Ravenna City asserts in a recent study that in a period of 15 years, from 1996 to 2011, the cumulative subsidence have reached a maximum of about 20 to 22 cm, in the coastal Lido di Dante area. Data relative to other zone can be consulted in map 2.4, below.
Figure 2.4: Cumulative subsidence map for the period 1998-2011. Ravenna area.(Servizio Geologico – Comune di Ravenna, 2006)
2.3 Emilia-Romagna Coastal Zone.
The Emilia-Romagna coast goes from the estuary of the Goro’s Po river at North, to the Cattolica town, South, for an extension of about 150 km. The most part of this landscape is occupied by low and sandy dissipative beaches, sometimes protected by offshore breakwaters (Armaroli et al., 2011). The North part is crossed by the Po river and many other rivers coming from the Apennines as Savio river, Lamone river, Fiumi Uniti river and Reno river; moreover in this area a lagoon system created by the estuary of the Volano’s Po river (abandoned) and the Goro’s Po mouth (Calabrese et al., 2010).
This hydrologic network makes the area very dynamic from a morphological point of view, thanks to the activation/deactivation trend of these numerous river estuaries; it has been already explained how, in last five centuries, following the Po river’s delta progradation, the shoreline has shown forward movement of more than 20 km in the neighborhood, while in other sectors the average value didn’t exceed 5 km.
According to the National Group for Coastal Research (2006 ) the general wind climate of this area are concentrate in the I, II and IV Quadrant, with particular peaks for what concerns energy, from ESE and SSE (“Scirocco”), from NNE and E (“Bora”) and from NO (Maestrale). According to Lamberti and Zanuttigh in this North Adriatic area the wind intensity is stronger if linked to a short fetch effect, such as Bora wind which reach highest speeds, while with wider fetch effect the speed peaks are lower (Scirocco wind).
This obviously influences the sea climate too: storms are frequently produced by Bora, especially coming from ENE, and Scirocco from South-East. In general the wave climate is mild with low energy waves, and a significant height lower than 1 meter for the 65% of cases, usually coming from Est (Gambolati et al., 1998).
According to Ciavola and Grottoli (2012) the sediment transport environment is domain of the littoral drift, basically moving from South to North. The tide regime is defined micro-tidal, with daily and nocturnal components range which goes from 30 to 70 cm.
2.3.1 Local dune ridges evolution
During the XIX century the whole Ravenna coastline was bordered by linear dunes, which could reach a length of some kilometers and a width of about 100 meters. Locally the medium height was oscillating from 3 to 5 meters.
At the end of that century, the human impact on this environment became stronger and stronger was the deviation from the natural behavior. A wide area was covered with Pine forests in order to protect inland agriculture from the salty aerosol. These actions had the effect of stabilizing paleo-dunes, while at the middle of the last century, any other dune left out of the forest area were flattened to build tourist infrastructures.
Starting from the 50’s the Italian tourist economy had a boom, and thus the need of infrastructures raised. This was more true in the south part of the regional coast (the Rimini area), while some more dune residual were left in the North area, even though the sand taking for construction industry was already a threat. Between the 50’s and the 80’s the surface occupied by dunes was halved in the whole region, leaving some considerable residuals only in the Ferrara and Ravenna area.
Fabbri (2001) verified that the Ravenna’s dune field in 1982 was extended for 38.2 km, while in 2001 they were decreased to 11.2 km, of which just 9.2 km in a good state of conservation. From this study emerged that 12.3 km disappeared because of the shoreline regression; 9.5 km were lost for the edification industry; 7 km were in a bad state of conservation because of the effects of the tourist buildings construction on the beach. On an area of 19 km2 only the 3% was occupied by active dunes (in 2001), while the 97% is stable, vegetated or under a Pyne Forest (thus, more than stable). Unfortunately many parts of these active dunes are in bad dune/beach equilibrium, so they basically should be defined “unstable”, beyond the “active” definition.
2.3.2 Coastal Geomorphology Map 2005
In 2005 the Regional Agency for the Environmental Protection (ARPA) released the Coastal Geomorphology Map (CGC2005), based on airborne photo-interpretation, LIDAR data, bathymetrical data and a terrestrial survey campaign. The technical staff who worked on it focused the study on six principal topics: dunes, subaerial beach,
defensive infrastructures, surf zone, river estuaries, lagoon and wet lands. In this paragraph only the first three arguments will be treated.
The dunes were surveyed and subdivided in three classes relative to their “maturity degree”, substantially in terms of vegetation cover: active, stable and partially stable. Beyond this index the CGC2005 can give many information about the dune ridge, on regional scale, such as its width, its continuity and elevations.
The Emilia-Romagna coastal belt is occupied for the 48% of its extension by coastal dunes, much more concentrated in the Po river area, on the Ferrara and Ravenna territories, than the Rimini area. In absolute terms in 2005 the length of the coastal area bordered by linear dunes decreased to 37 km along the Region; in the Ravenna specific area the extension was limited to 23 km.
Most part of coastal dunes are short dimensioned, with an average height of 2/3 meters, stable or partially stable, while a very little percentage rests active. The width is obviously limited fundamentally by the strong urbanization and human impact and it oscillates between 0 and 200 meters.
The beaches (aerial backshore) general state is not encouraging too; on the whole territory the 25% is occupied by touristic infrastructures, especially in the South part of the region (Rimini area). The beach width can reach a maximum of 300 meters, but its average value is about 70 meters. The two parts are very different one from each other: the south part presents a lateral continuity much more accentuated than the North one where the width has intense variations, up to disappear in correspondence of some segments.
The generic erosional pattern and the strong alongshore drift towards North are proved by the shoreline trend and the many erosional features seeable on the dune/beach ridge. Going further towards the sea, the beach has a gentle slope and the fore shore is characterized by the presence of 2 to 3 bars, typical of a dissipative system; usually these bars systems, oriented alongshore or oblique, are developed up to 100 meters from the shoreline.
2.3.3 The MICORE project.
In 2011 the ARPA Agency and the University of Ferrara published a detailed work focused on the sea and storms impacts, primarily trying to extend the data set in terms of time as much as possible, then monitoring specific sites and testing new methodological tools studied to measure storms, their energy and their impact.
A very interesting part of this study is focused on storms and their impact, which MICORE project faced on two fronts with two relative data sets: on one side it proceeded to an identification analysis of high energy events from 1992 to 2010, using data from the different buoys which operated in that period and area (Ancona, Venezia and Ferrara); on the other side, the project included a reconstruction of all storm events, in term of impact, from 1946 to 2010.
The “storm catalogue” (1992-2010) has identified 225 high energy events for that period and it has described each storm in terms of waves height, period and direction (for buoys that didn’t record the direction, the wind direction was assumed as substitute). Moreover applying the same methodology proposed by Armaroli et al. (2007) for local study, the total energy was calculated correlating the waves’ height to the storms last.
For each event, the sea level was recorded too, considering a temporal window going from the 24 hours before the event to the following 24. The impact was calculated in terms of dune/beach erosion, sea ingression, canals flood, infrastructures and touristic building damages.
An interesting characterization of the storms pattern resulted from the analysis of the number of storms per year linked to the carried energy: histogram in figure 2.x shows these results. The Energy datum represents the storm’s impact force. It is clear how there are some years with many low energy events, which didn’t emanated much energy, while during some other years the number of storms was lower, but with a strong energy, and this made the impact raise.
Ferreira in 2005, proved the increasing damages due to the occurrence of two events in a relative short time. For last years the 2000 was a poor year both for number and energy of events, while the 2002 and 2005 are the two years during which the most damages were registered. 2004, 2009 and 2010 registered many low energy events, but concomitant occurrence of the storm surge conditions aggravated their impact. In
conclusion of about 50 events surveyed (4 multiple) 26 have an intensive impact on the coast area.
December, November, May and April seem to be the months more affected by these events, which usually are accompanied by I and II quadrant wind and a sea level exceeding 0,8 meters. In the Ravenna area storms are concentrated in November, December and January, with storm surge condition and II quadrant winds (Perini et al., 2010).
Figure 2.5: histograms represent number of storms per year; the green line the total energy and the blue line the normalized energy (Modified from Perini L. et al., 2011)
The impact catalogue (1946-2010) is the result of a much more complicated data collecting, but, in spite of the lack of data, some interesting data appeared. Even if the storms number increase from the 90’s is not directly ascribable to a real increment, because of the lack of data, the analysis on the maximum sea level gave interesting results. Canestrelli et al. (2011) described how the number of storm surge events per year increased from 50’s to 70’s, stayed stable from 70’s to 90’s and then boosted in last ten years.
2.4 Sites of Research.
2.4.1 Bevano river estuary area.
The Bevano river estuary has a high environmental value and it is inserted within the Biogenetic State Natural Reserve (“Duna Costiera ravennate e foce torrente Bevano”), under the forestry police shelter (Gabbianelli, 2009). This reserve is included in the wider “Regional Po river delta park” and it is classified as a Special Protection Zone (ZPS), managed by the European Community.
This particular area is part of the Ramsar Convention for wetlands and migratory species thanks also to the presence of Charadrius alexandrines, a migratory bird which use to keep its eggs on the dune seaward stoss. This allows the administrators even to completely forbid parts of the beach to tourists walking, for some periods during the year.
Until the 2006 this was the only natural river mouth left in Italy, but, due to hydraulic and environmental problems (the mouth was keeping migrating to North, damaging the dunes), the management chose for a strong action on it.
This site is the only, in the Ravenna zone, where the dunes are continuous for about 5 km, undamaged and natural looking. Backward to this dune ridge there are two artificial state-owned Pine forests (“Ramazzotti” and “Savio”), planted in 1881, which have by now replaced the typical and natural back-dune vegetation (bushes). Another effect is the complete stabilization of the paleo dune field inland, for about 500 meters width (Perini et al., 2009).
The author focused his study on a sector of the dune ridge, South of the river mouth, which is about 3 km long, from the estuary to Lido di Classe. The about 200 meters long section studied in this work is about 800 meters, South of the estuary (figure 2.6). The beach width, measured on five transects in GIS environment, oscillates from about 32 to about 44 meters, for an average approximated value of 36 meters.
From a morphological point of view this dune field is composed by a linear dune, which could be called a linear foredune ridge, because of the constrained development that the local environment imposes to this element (figure 2.7). The narrow beach and the wide Pine forest, in effect limits the dune system development on both seaside and landside (the distance between the beach and the Pine forest never overtakes 80 meters).
Wind and sea action is clearly visible in the frontal part of the dune, which present a very sloped shape and it is sprinkled with many erosional forms due to these factors. The result is a narrow dune ridge with an almost vertical Hummocky looking frontal part (foot) (figure 2.8).
The dune “body” (crest and landside) is almost completely vegetated, with grass, shrub and arboreal species. In the central zone of the area of study is split in two by a path for tourists’ access to the beach, bordered by wooden fences, made to allow tourists to go to the beach without stepping on the dune. Unfortunately, for the dynamic explained in the previous chapter about blowout/wind interaction, this element has become a zone of particular and strong erosion.
2.4.2 Marina di Ravenna and Milano Marittima area..
Both Milano Marittima and Marina di Ravenna are renowned Italian seaside towns and very crowded during summer periods. The Marina di Ravenna dune (figure 2.9) is called “Giacobazzi”, taking inspiration from an old important building in town; it represent the widest residual of the much more continuous dune ridge of about 50 years ago.
The beach in front of the dune in much wider than in the Bevano area; as before, it was measured by 5 transects in GIS environment, resulted oscillating between about 61 meters and 73 meters, for an average of 68 meters. As the Bevano area, even Marina di Ravenna coastal landside is bordered by a Pine forest, but the dune, which is much more fragmented, reaches higher average elevations, exceeding in some spots the 6.5 meters.
Figure 2.9: Marina di Ravenna location.
The morphology of this dune, as well as the Milano Marittima one is constrained by the hard management of the beach: on the two lateral sides of both dunes there are two paths for tourists, which are kept clean thanks to the use of caterpillars. This practice gives to dune a “barchanoidal” shape which finds no explanation in natural dynamics.
Moreover, as it is going to be better explained in further chapters, during winter period the local administration builds sand walls (called “winter dunes”) to protect
economic activities on the beach, with strong morphological effects. The summer periods behavior is subject to human influence as well, due again to the caterpillars use to “organize” the beach before the tourist period to the consequent crowding.
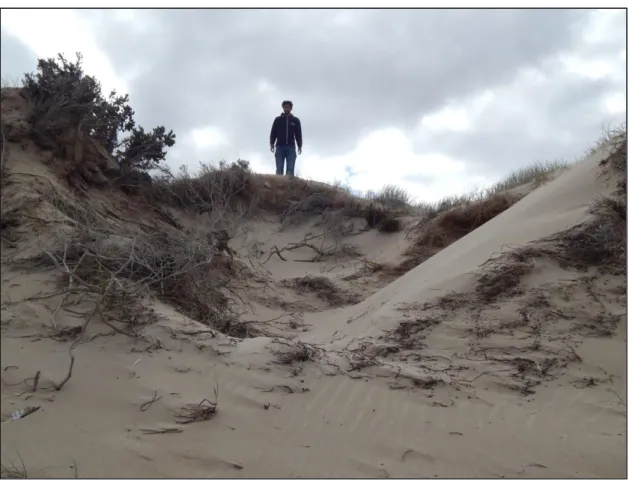
Figure 2.10: Marina di Ravenna dune (photographed from the crest)
Figure 2.11: Marina di Ravenna dune Digital Elevation Model.
Milano Marittima is the most urbanized and most tourist site of those studied. The human impact on the dune/beach system is even stronger than in Marina di Ravenna. The beach in front the dune have an average width of about 56 meters, but the situation of this area is worsened by the presence of small building for tourists, straight on the beach. As Marina di Ravenna, even this dune has a particular name “Varese”, linked to the old abandoned building on the dune’s backyard.
Figure 2.12: Milano Marittima location.
Even in this case there is a Pine forest on the backyard, limited only to the dune area, but it is about 500 meters far from the sea. Anyway, in spite of all those constrictions, the dune is still active and still exchanging “energy” with wind and sea. Examining figures 2.13 and 2.14, it can be clearly seen how both dunes are vegetated, most of all with grass species.
Figure 2.13: Milano Marittima dune. In the picture is seeable the laser scanner working and caterpillars footprint on the sand.