2015
Publication Year
2020-04-06T13:34:24Z
Acceptance in OA@INAF
Are short Gamma Ray Bursts similar to long ones?
Title
GHIRLANDA, Giancarlo; BERNARDINI, Maria Grazia; CALDERONE, GIORGIO;
D'AVANZO, Paolo
Authors
10.1016/j.jheap.2015.04.002
DOI
http://hdl.handle.net/20.500.12386/23877
Handle
JOURNAL OF HIGH ENERGY ASTROPHYSICS
Journal
7
Contents lists available atScienceDirect
Journal
of
High
Energy
Astrophysics
www.elsevier.com/locate/jheap
Review
Are
short
Gamma
Ray
Bursts
similar
to
long
ones?
G. Ghirlanda
∗
,
M.G. Bernardini,
G. Calderone,
P. D’Avanzo
INAF–OsservatorioAstronomicodiBrera,ViaE.Bianchi46,I-23807Merate(LC),Italy
a
r
t
i
c
l
e
i
n
f
o
a
b
s
t
r
a
c
t
Articlehistory:
Received 5 March 2015 Accepted 8 April 2015 Available online xxxx
TheapparentseparationofshortandlongGamma-RayBursts(GRBs)inthehardnessratiovsduration plothasbeenconsideredasadirectevidenceofthedifferencebetweenthesetwopopulations.Theorigin ofthisdiversity,however,hasbeenonlyconfirmedwithlargerGRBsamplesbutnotfullyunderstood. Inparticular,thehardnessratioisonlyaproxyoftheshapeofthespectraofGRBsanditself,together withthe observedduration,doesnot considerthepossible differentredshiftdistributionofshortand longbursts,whichmightarisefromtheirdifferentprogenitors’nature.Bycorrectingthespectralshape ofshortandlongGRBsfortheredshifteffects,shortGRBsare harderthanlongonesduetoaharder lowenergyspectralcomponentwhilethetwopopulationshavesimilar(restframe)peakenergy.Inthe restframe,thetemporalbreakofthelong/shortdurationdistributionisblurredawayandshortandlong GRBshaveacontinuousdifferentialdurationdistribution.Moreover,theyshowsimilarluminositiesbut theirenergeticsdifferbyafactorproportionaltotheirdifferentaverageduration.Thespectralevolution oflongGRBsshowsthattheinitialphase(oftheorderof0.3s restframe)hassimilarspectralproperties of that of shortGRBs. As a consequence, the different hardness atlow energies might be dueto a prolongedspectralevolutionoflongGRBswithrespecttoshortones.Finally,weshowthatlongGRBs canhaveanulllagsimilarlytoshortbursts.Moreover,wefindthataconsiderablefractionoflong(and mostofshort)GRBsareinconsistentwiththelag-luminosityrelationwhichcouldbeaboundaryinthe correspondingplane,ratherthanacorrelation.
©2015ElsevierB.V.All rights reserved.
1. Introduction
GammaRayBursts(GRBs)aretypicallydividedintotwoclasses ofshortandlong eventsbasedontheir observedduration inthe
γ
-ray band. Thebimodal distributionof T90,i.e. thetimescale in whichfrom5%to95%ofthecountsarerecorded,suggesteda pos-sible separation at∼
2 s (Kouveliotou et al., 1993). For a recent review of Short GRBs see Berger (2014). This was assumed for yearsasthedividinglinebetweenshort(SGRBwithT90≤
2 s)and long(LGRBwithT90>
2 s)GRBs.Astatisticallysignificant(10−4) intermediatedurationpopulationwasalsoclaimed(Horváth,1998; ˇRípa et al., 2009) although it showed similar properties to the class of long GRBs (de Ugarte Postigo et al., 2011).1 The appar-entseparationbetweenSGRBs andLGRBs,discovered inthe GRB population detected by BATSE/CGRO, was confirmed by Hete-2 (Sakamotoetal.,2005; Pélangeonetal.,2008),BeppoSAX(Frontera etal.,2009),Integral(Bošnjaketal.,2014; Savchenkoetal.,2012),*
Corresponding author.E-mailaddress:giancarlo.ghirlanda@brera.inaf.it(G. Ghirlanda).
1 Recently, it has also been claimed the existence of a distinct population of ultra-long GRBs (Levanetal.,2014).
Swift(Sakamotoetal.,2005) andFermi(von Kienlinetal., 2014). However, the comparison of the duration distributions of bursts detected by different instruments suffers from instrumental bi-asesinduced bytheenergyrangewheretheyoperate,thetrigger method(imagetriggersarelesssensitivetoshort/spikybursts)and theenergyrangewheretheT90iscomputed(onaverageasmaller
T90isestimatedwithlightcurvesofhigherenergyphotons–Qin
etal.,2013).
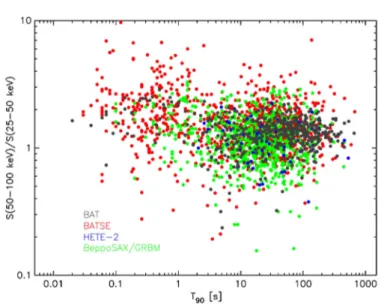
What, observationally, does distinguish short and long bursts in addition to their duration? It was early realised that SGRBs mighthave differentspectral properties.Thehardness ratio(HR), defined as the ratio of the flux in two separated energy bands (i.e.thecountsintheharderenergybanddividedbythoseinthe softer),showedthat shortGRBshaveonaveragealarger HRthan long bursts (Kouveliotou etal., 1993; Tavani, 1998). However, no correlation between HR and duration was found within the in-dividual classes(Qin et al., 2001). Fig. 1 (Sakamoto et al., 2005) showsthe HR-T90 plot ofGRBs detected by Swift (five year cat-alog of 476 events – grey symbols), compared with BATSE (red symbols), Beppo/SAX(green symbols)and Hete-2(blue symbols) bursts.ForSwiftbursts,theKolmogorov–Smirnov (KS)test ofthe HRbetweenSGRBsandLGRBshasaprobabilityof8
.
3×
10−20that http://dx.doi.org/10.1016/j.jheap.2015.04.002JID:JHEAP AID:20 /REV [m5G; v1.151; Prn:22/04/2015; 13:12] P.2 (1-9) 2 G. Ghirlanda et al. / Journal of High Energy Astrophysics•••(••••)•••–•••
Fig. 1. HR-T90plot of GRBs detected by different missions (as shown in the legend) from Sakamotoetal.(2011). (For interpretation of the references to color in this figure, the reader is referred to the web version of this article.)
thetwopopulationsaredrawnfromthesameparentdistribution. In general, the populations of GRBs detected by different instru-mentsoverlayintheHR-T90planealthoughtherelativenumberof shortandlong GRBsdifferamongdifferentinstruments.Thefour year catalog of 954 Fermi bursts (von Kienlin etal., 2014) con-tainsbetween13%and20%ofSGRBwithaverageduration
∼
0.7 s andaverage HR>
1(LGRBs havean average duration of25 s and HR<
1).2Other possible differences in the temporal properties are the smaller minimum variability timescale (MacLachlan et al., 2012, 2013) of SGRBs (on average 10 ms) with respect to LGRBs (200
ms); see also Nakar and Piran (2002) and Golkhou and Butler
(2014). What links temporal and spectral properties is the lag: this is the delay (either positive or negative) between the light curves in two different energy bands. It was early found in the BATSE GRB sample that LGRBs have positive lags with the high energy light curve lagging the low energy one, while typically SGRBs have null lag (Cheng et al., 1995; Norris et al., 2001; NorrisandBonnell,2006).
Overall,thecomparisonoftheprompt
γ
-ray emission proper-tiesofshortandlongGRBsshowsthatshortGRBshave(a) harder spectra (as shown by the HR, Fig. 1), (b) smaller variability timescale and(c) nulllag. However, there are some caveats: T90 and HR are computed in the observerframe through the light curvesaccumulatedbya givendetector.Mostoften,HRhasbeen computedastheratiooftheinstrumentalcountsrecordedintwo differentenergybands.WiththelaunchofSwiftin2004(Gehrels et al., 2004) the possible different redshift distribution of short and long bursts was disclosed. BATSE and Fermi data allowed us to characterise the spectra of GRBs over a wide (few keV to several MeV) energyrange with tens of ms time resolution. We nowknowthatGRBspectramighthavedifferentshapes(typically representedby curvedmodels,i.e. morecomplicatedthansimple powerlaw)andstronglyevolve withtime withinindividual GRBs. Therefore,(1) theredshift, (2)the overall shape ofthe spectrum and (3) its evolution within the burst should all be considered whencomparingthetemporalandspectralpropertiesofSGRBand LGRB.Thepossibledifferentredshiftdistributions ofshortandlong GRBsmightchangetheresults,i.e.blurawayorexacerbatethe dif-ferencesbetweenthetwoclasses.TheHRrepresentsonlyaproxy 2 The HR values may change according to the energy ranges selected for their computation.oftherealspectraldiversityofshortandlongeventswhichshould insteadbesearchedinthedifferenceofthespectralparametersof theseclasses(Ghirlandaetal.,2004,2009,2011).
In the following sections we will progressively probe deeper into the consolidated differences of shortand long GRBs explor-ing the originof thedifferent HR by searchingfor differencesin the spectral shape (Section 2), including the redshift corrections (Section 3) andthetemporalevolutionofthespectrum(Section 4) and,finally,revisitingthelagasadiscriminatorbetweenshortand longevents(Section 5).
2. TheobservedspectrumofGRBs
Spectral analysis of samples of short and long GRBs showed that this is typically represented by a curved function (Preece et al., 2000; Ghirlanda et al., 2002, 2004; Kaneko et al., 2006; Frontera et al., 2009; Nava et al., 2011a; Goldstein et al., 2013, 2012;Gruberetal.,2014).Inparticular,asmoothlybrokenpower law (Band et al., 1993) or a power law witha high energy cut-off suffice to reproduce the observed spectra of most short and long GRBs with the former being more often fitted by a cutoff power lawfunction (Ghirlanda et al., 2004, 2009). The common feature ofthesefunctions isthe presenceofa low energypower law (parametrisedby its photon spectral index
α
) anda charac-teristicenergyEpeakwheretheν
Fν spectrumpeaks.Thesmoothly brokenpowerlawmodelhasanadditionalhighenergypowerlaw component(parametrisedbythephotonspectralindexβ
).SpectralanalysisofsamplesofshortandlongGRBsdetectedby BATSE andFermi (Ghirlanda et al., 2004, 2009) showsthat short andlongGRBshaveslightlydifferentEpeakdistributions(withaKS probability of10−2 ofbeingdrawnfromthesameparent popula-tion)whilethemaindifferenceisinthelowenergyspectralindex (
α
) distribution (witha KS probability of 10−4). From the distri-butionsofthesetwospectralparameters(Ghirlandaetal.,2009) itappearsthatSGRBsareharderthanLGRBsduebothtoa combina-tion oftheir peak energy(on average Epeak
∼
400 keV for SGRBs withrespectto220 keVforlongevents) andofaharder low en-ergy spectral index(onaverageα
∼ −
0.
4 for SGRBswithrespect to−
0.
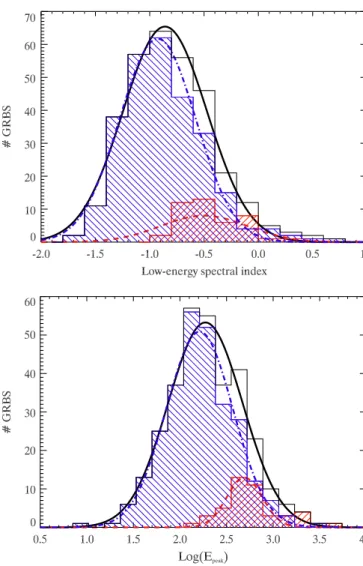
92 for long ones).These results,found inthe BATSE short andlongpopulations(Ghirlandaetal.,2009),areconfirmedbythe Fermi data(Navaet al., 2011a). Fig. 2showsthe distributions of the low energyspectral index(toppanel) andpeak energy (bot-tompanel)ofFermilong(bluehatchedhistogram)andshort(red hatchedhistogram)bursts(fromNavaetal.,2011a).3Thetoppanel ofFig. 2alsoshowsthatallshortGRBshavealowenergyspectral indexviolating(i.e.harder than)thesynchrotronlimit of−
1.
5 in caseofelectroncooling.We further test these results with the most updated sample of GRBs from the GBM/Fermi catalog4 (von Kienlin et al., 2014;
Gruber etal., 2014). We selected all the GRBs (up to Feb. 2015) detectedbytheGBMonboardFermiwithatimeintegrated spec-trum well fitted by either a Band function or a power lawwith exponential cutoff.Fig. 3(toppanel) showsthe lowenergy spec-tralindex(
α
)versus thepeakenergy(Epeak)intheobserverframe for the982 GRBs.Red andbluesymbols show thepopulation of shortandlongevents,respectively,consideredseparatingthe sam-ple at 2 s. The KS test probabilities of Epeak andα
forthe two populations are10−30 and10−24,respectively. Wealsoverifiedif theKSprobabilitydependsonthe2 s short/longdivide.Indeed,it hasbeensuggested(Brombergetal.,2012,2013) thattherecould beacontaminationofcollapsars(i.e.longGRBprogenitors)inthe 3 For a comparison of the spectral properties of short and long GRBs detected by Fermi and BATSE see Navaetal. (2011b).Fig. 2. Time
integrated spectral parameters of short GRBs (red hatched histograms)
versus long GRBs (blue hatched histograms) detected by Fermi and analysed by Navaetal.(2011a,2011b). The top and bottom panels shows the low energy spec-tral index and the peak energy of the νFνspectrum, respectively. (For interpretation of the references to color in this figure legend, the reader is referred to the web ver-sion of this article.)population of short events and that the separation between the twoclassesmightdifferby2 s (e.g.0.8forSwift).Wefindthatby shiftingthe long/short divide by a factorof 2 theKS probability remainshighlysignificativeofthediversityofthespectral param-etersofthetwoclasses.
3. RestframepropertiesofshortGRBs
Thecomparisonofthe observedproperties(e.g.T90 and spec-tralparameters)ofshortandlongGRBsdoesnottakeintoaccount the redshift effects. In particular the observed duration and the observedpeakenergydependonthesourceredshift.Ifshortand longGRBshavedifferentredshiftdistributions,thiseffectcan con-siderablybluraway thedifferencesdiscussedintheprevious sec-tion.
However, our knowledge of the distribution of GRBs through cosmic timesis still limitedby the fact that the majorityof the GRBs observed by Swift are lacking a redshift measurement (in-deedthemeasureofthedistancehasbeensecuredforabout1
/
3 oflongGRBs and1/
4 ofshortGRBs).Thisfact stronglylimits the possibilityofwellgroundedstudiesaimedatshapingtheGRB rest-framepropertiesandredshiftdistribution.Fig. 3. Low
energy spectral index versus peak energy in the observer frame (top
panel) and in the rest frame (bottom panel) for the present sample of Fermi GRBs with time integrated spectrum fitted with either a Band model or a cutoff power law model. Red and blue symbols are for short and long GRBs, respectively. (For interpretation of the references to color in this figure legend, the reader is referred to the web version of this article.)3.1. Spectralparameters
AsafirstexerciseweusedtheaverageredshiftofSGRB,z
=
0.
6, andLGRBs,z=
2.
1,inordertocorrecttheobservedspectralshape ofthetwopopulations.Thebottompanel ofFig. 3showstherest frame Epeak (i.e.corrected forthe1+
z factorforlong andshort events).Note thatthe slopeofthe spectrumbelowthe peak(i.e. the spectralindexα
) isunaffected by thiscorrection. Inthe rest frame,theKSprobabilitybetweenshortandlongevents(keeping their separation still fixed at 2 s observed frame – i.e. consider-ing the redand bluesymbolsin Fig. 3bottom panel)reducesto 10−4 (to be compared to 10−30 in the observer frame). The KS probabilityonthedistributionofα
isinsteadunchanged.This re-sultconfirmsthatSGRBsandLGRBshavedifferentspectradueto adifferentlow energyspectral indexratherthanadifferentpeak energy. Indeed,in the restframe short andlong GRBs (indepen-dentlyon their separationtimescale,when itiswithin afactor 2 fromtheusual,observerframe,one–T90=
2 s)havesimilarEpeak butremarkablydifferentα
withtheformerbeingharderthanthe latter.3.2. Duration
Theseparationat2s betweenshortandlongGRBs was origi-nallybasedonthetwooverlappingdistributionsofT90.Verylikely
JID:JHEAP AID:20 /REV [m5G; v1.151; Prn:22/04/2015; 13:12] P.4 (1-9) 4 G. Ghirlanda et al. / Journal of High Energy Astrophysics•••(••••)•••–•••
Fig. 4. Differential
duration distribution of
T90for the GRBs in the present Fermi sample. Observed distribution (solid black line) and rest frame distribution (ob-tained correcting short and long GRBs for an average redshift) are shown. Vertical bars are count uncertainty in each bin. (For interpretation of the references to color in this figure, the reader is referred to the web version of this article.)thereshouldbeareciprocalcontaminationofthetwopopulations.
Bromberg etal.(2012, 2013)found that the differential distribu-tion of the (linear rather than logarithmic) T90 (in the observer frame)showsacharacteristicdoublepeakedshapewithaflat in-termediate portion. This resultwas confirmedby the analysisof theT90distributionsofGRBsobservedbyBATSE,FermiandSwift (Brombergetal.,2013).
Fig. 4 shows the T90 distribution of Fermi GRBs updated to Feb. 2015: the black line represents the distribution of the ob-server frame T90. The two populations of short andlong events are clearly shown by the separationin the doublepeaked shape ofthedistribution.Indeed,longGRBsshowaflatpartoftheir du-ration distribution extending into that of short events. This was interpreted (Bromberg et al., 2012) as the evidence of the con-tamination of long GRB progenitors into the population of short GRBs. Based on these results it was proposed to better define a separation timescale (e.g. 0.8for Swiftbursts) which could min-imisethefractionofcollapsarsinselectingsamplesofshortevents. TheflatportionofthelongGRBdistributionwasattributedtothe existence of a typical timescale necessary for thejet to drillthe progenitorstar(forlongGRBs).Thebreaktimeat10 s ofthelong GRBdistributionbetweentheflatandthesteep portionisindeed thecharacteristictimescale forthejet todrilltheprogenitorstar. Ifthe jet lastsmuch longer than thistimescale itwill appear as anormallongGRB,ifitsdurationisonlyslightlylongerthanthis timescale itwill appearashort GRB,butstillproduced by a col-lapsar.
Theaboveconsiderations do notfullyconsidertheredshift ef-fect onthe T90 distribution.Accounting forthepossible different average redshift of the short and long GRB population, we find thattherestframedifferentialdistributionofT90isthepinksolid linein Fig. 4 wherethe shortandlong GRBs do not seemto be separated any more. The flat part of the long GRB distribution completelyvanisheswhentherestframedurationisconsidered.
4. Energeticsandluminosities
Short and long GRBs can also be compared in terms of en-ergetics and luminosities. In particular this can be done in the
Epeak–Eiso and Epeak–Liso planes where long GRBs define two strong correlations (Amati et al., 2002; Yonetoku et al., 2004). Adding short GRBs on these planes requires the knowledge of their redshift andalso a broadband spectrum which allows one to measure the peak energyand the isotropic equivalent energy
Eiso and luminosity Liso. Short and long GRBs follow the same
Epeak–Liso correlationbutshortGRBshave,onaverage,an energy
which is smaller than that of long events by a factor compara-ble to the ratio of the average duration of the two populations (Ghirlandaetal.,2009).Thiswouldsuggestthattheymightfollow a correlationinthe Epeak–Eiso plane whichisparallelto that de-finedbylongbursts.However,theseresultsarestilllimitedbythe smallnumberofshortGRBswithmeasuredzand,forbothclasses, incomplete/inhomogeneoussampleshavebeentypicallyadopted.
Withthe aimofovercoming thisproblem,we selected a sub-sampleofthefullSwiftGRBdatabase.WeconsideredGRBshaving favourable observing conditions for ground-based redshift deter-mination and that are brightin the 15–150 keV Swift/BAT band. Withsuchcriteria,weobtainedtwosamples,consistingof58long GRBs5and16shortGRBs,withacompletenesslevelinredshiftof 90%and69%,respectively.Thedetailsofthetwosamplesselection arediscussedinSalvaterraetal. (2012)andD’Avanzoetal. (2014). Weusedthesecompletesamplestostudythecorrelations be-tweenthespectralpeakenergy Epeak ofthepromptemission,the isotropic energy Eiso andthe isotropicluminosity Liso.Being free of selection effects (except for the flux limit in the 15–150 keV band), these samples provide a useful benchmark to study the rest-framephysicalpropertiesofGRBs.Thisenablesustoprobe,in an unbiasedway,theissuerelatedtothephysicaloriginofthese correlationsagainstselection effectsandfirmly compares therest frameluminositiesandenergeticsofshortandlongGRBs.
We checked the consistency withthe Epeak–Liso (Yonetokuet
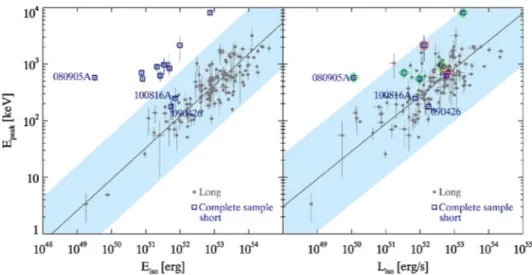
al., 2004), andwith the Epeak–Eiso relations (Amati et al., 2002) for all the Swift long GRBs with redshift6 and the short GRBs of our sample. The results are shown in Fig. 5. All events are found to be consistent with the Epeak–Liso correlation, which is known to be validforlong GRBs (Yonetoku etal., 2004; Nava et al., 2012).ByfittingtogetherthelongGRBs withredshiftandthe shortGRBsofoursamplewiththefunction y
=
10AxB we obtaina normalisation A
= −
22.
98±
1.
81 and a slope B=
0.
49±
0.
03. A significant exception is the short GRB 080905A which lies at more than 3σ
from the best fit. We note that this event has the lowest values for Eiso and Liso among the short GRBs of our sample. Wespeculate that theredshift ofthisGRB mightbe higher than the value inferred fromits (possibly chance) associ-ation with a nearby (z=
0.
122) spiral galaxy observed edge-on (D’Avanzo et al., 2014). We also found evidence for a Epeak–Liso correlation followed by short GRBs being systematically fainter than the correlation defined by long GRBs. Although such find-ing isintriguing,wecautionthat itcanbe affectedbythechoice of the temporal bin in the estimate of the isotropic peak lumi-nosity for both long and short GRBs (by choosing smaller and smaller bins, the estimate of Liso tends to increase). In Fig. 5 (right panel)we dividedtheshort GRBswith&
t≥
1000 ms (red circle), 50≤ &
t≤
64 ms (green diamonds),&
t=
16 ms (yellow triangles) and&
t=
4 ms (purple upsidedown triangle). For the majority of long bursts the peak flux has been estimated on a&
t∼
1 s timescale.WefindthatshortGRBswithsmaller&
t sys-tematically tend to have larger Liso, and to be more consistent withthebestfitoflongbursts.Thesepreliminaryresultssuggest that a consistency between the long andshort Epeak–Liso corre-lation canbe reachedby consideringforboth classesofeventsa&
t which isa (proper)fractionoftheir T90 (Tsutsui etal., 2013;D’Avanzoetal.,2014).
Concerning the Epeak–Eiso plane, short GRBs define a region withthesameslopemeasuredforthecorrelationholdingforlong GRBs but with a different normalisation, lying systematically on 5 Up tp March 2012; since then the sample increased, consisting now of 100 bursts, 82% with redshift.
6 As reported in Navaetal. (2012), the Epeak–Lisowas found to hold for both the total sample of Swiftlong GRBs with redshift and for our complete (flux-limited)
Fig. 5. Epeak–Eiso(left panel) and Epeak–Liso(right panel) correlations (dots: long GRBs, data taken from Navaet al.,2012; empty squares: short GRBs, data taken from (D’Avanzoetal.,2014). The power-law best fit is shown as a solid dark line. The shaded region represents the 3σ scatter of the distribution. Two GRBs with uncertain classification (GRB 090426 and GRB 100816A) and a possible outlier of the Epeak–Lisocorrelation (GRB 080905A) are also marked. (For interpretation of the references to color in this figure, the reader is referred to the web version of this article.)
the left with respect to the best fit line of long GRBs. Two ex-ceptionsareGRB 090426andGRB 100816A,bothconsistentwithin 2
σ
confidence region of the relation holding for long GRBs. As discussed in D’Avanzo et al. (2014), both these events have an uncertainclassification. In light of its duration (T90 of2.9)7 and promptemissionproperties,GRB 100816Aislikelyalong-duration event.No firm conclusion can be derived fortheclassification of GRB 090426, mainly dueto the lack ofstrong constraints on the propertiesofitspromptemissionspectrum.AfittotheshortGRBs ofthecomplete sample inthe Epeak–Eiso plane withthe functiony
=
10AxBprovidesanormalisation A= −
28.
01±
2.
91 andaslopeB
=
0.
60±
0.
06.Asacomparison,asreportedinNavaetal. (2012), thesamefitperformedonthecompletesampleofLGRBsprovidesA
= −
29.
60±
2.
23 and B=
0.
61±
0.
04.5. Long“start”asshort
AsdiscussedinSection3,shortGRBsspectrashowharder low-energy spectral index, and a slightly higher peak energy, when compared to thetime integratedspectra of long GRBs. However, considering only thespectra corresponding to the first 1–2 s (in the observer frame) of long GRBs, the distributions of both the low-energy spectral index and the peak energy become indis-tinguishable from those of short GRBs (Ghirlanda et al., 2004, 2009). The total energy emitted by short GRBs (for which we have a redshift estimate) is significantly lower than for a typ-ical long GRB, however the involved luminosities are compara-ble, and both short and long GRBs appear to follow the same
Epeak–Liso relation (Section 4, Fig. 5). Moreover, by performing a time resolved spectroscopy of short GRBs it has been shown that the peak energy tracks the flux evolution and, in the few cases where a redshift is available, the Epeak
(
t)
–Liso(
t)
correla-tionforshortGRBsissimilartotheoneforlongGRBs(Ghirlanda et al., 2011). Finally, both short and long GRBs lie on the three parametercorrelation EX,iso–Eγ,iso–Epeak (Bernardini etal., 2012;Margutti et al., 2013). These results suggest that the emission mechanisminbothshortandlongGRBsmightbesimilar,although occurringondifferenttimescales,thelatterbeinglikelyrelatedto thedifferentlifetimeoftheirprogenitor engines(Ghirlandaetal., 2009,2011;Guiriecetal.,2010,2013).
7 In spite of a duration larger than 2 s, GRB 100816A was initially classified as a short GRB (Norrisetal.,2010).
In Calderone et al. (2015) we further explore these similari-tiesbycomparingtheintrinsic(i.e.restframe)spectralproperties
Epeak, Liso and Eiso oftheshortGRBs withthoseofthebeginning
oflongGRBs,evaluated by integratingthespectraon arestframe time scaleequaltothetypical durationofshortevents.Although there isnot a universalshort burstduration,a reasonable choice is to use the average rest frame duration (T90
/(
1+
z)
) of short GRBs. Forthesample ofshortGRBs withredshift inD’Avanzo et al. (2014)Thisdurationis0.3 s.For the comparison we considered two samples of short and longGRBsrespectively:
•
theshortGRBsamplecomprises9burstsfromtheD’Avanzoet al. (2014)sample and3more burstsdetected by Fermi/GBM. WeconsideredthespectralpropertiesreportedinD’Avanzoet al. (2014) forthe9burstinthat paper,andwe analysed theFermi/GBMdatafortheremainingbursts.Theseresultsare col-lectivelyreferredtoastheshortresults;
•
thelong GRBsample comprises 44bursts detected byFermi/ GBM up to December 2013. For these bursts we performed twospectralanalysesontheFermi/GBMdata:oneonthetime integratedspectra(whole results) andoneby consideringjust thedatacollectedduringthefirst0.3srestframe (correspond-ingto0.
3× (
1+
z)
sintheobserverframe)oftheburst(first results).Forthespectralanalysis,weconsideredthetimeselectiongiven inGruberetal. (2014)fortheburstscommontobothoursample andtheir catalog. Forthe other GRBs we performeda visual in-spectionofthelightcurvestoidentifythetimeintervalwherethe countsaresignificantlyabovethebackground.Forthefirstanalysis weconsideredthefirstoccurrenceofa0.3 slong(restframe)time binwhosetotalcountsaresignificantly abovethebackground(at 3
σ
level).Thespectralmodelsusedforfittingarecustom8versionsof ei-therthecutoffpowerlawortheBandmodel,inwhichwe adopt thelogarithmofthepeakenergy(
log_Ep
)andoftheintegrated flux (log_F
) in the restframe energy range 1 keV–10 MeV, as free parameters inthe fit. Thebest fit value oflog_F
allowsto estimate the intrinsic isotropic luminosity Liso=
4π
D2L×
F and 8 The implementation of these spectral models suitable to be used in XSPEC is available at http://www.giorgiocalderone.url.ph/xspec_ggrb.tar.gz.JID:JHEAP AID:20 /REV [m5G; v1.151; Prn:22/04/2015; 13:12] P.6 (1-9) 6 G. Ghirlanda et al. / Journal of High Energy Astrophysics•••(••••)•••–•••
Fig. 6. Results
of the spectral analysis in the
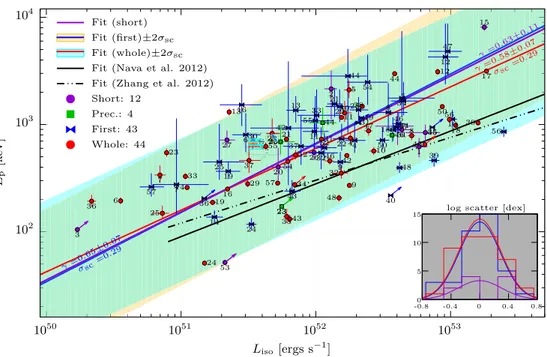
Epeak–Lisoplane. The short, first and wholeresults are shown with purple, blue and red symbols respectively. The best-fitEpeak–Lisocorrelations are shown as solid lines with the corresponding colours and the inset plot shows the histograms of residuals. The slope (γ) and scatter (σsc) of the correlations are shown at the edges of the figure. The 2σscscatter of the firstand wholeresults are shown as orange and cyan shaded area respectively. The Epeak–Lp,iso relations from the total sample of Navaetal. (2012)(black dashed line) and from the combined short and long GRB sample of Zhangetal. (2012)(double dot–dashed lines) are also shown for comparison. Lower limits and precursors are shown with arrows and green symbols respectively. (For interpretation of the references to color in this figure legend, the reader is referred to the web version of this article.)
itsuncertainty,withoutpropagatingtheuncertaintiesontheother parameters.We used
xspec
,ver.12.8.1gto minimise theC-STAT valuewhencomparingthesumoffoldedspectralmodeland back-groundexpectedcountswiththeobserveddata.Fig. 6showstheresultsofthespectralanalysisintheEpeak–Liso plane. The short, first and whole results are shown with purple, blueandredsymbolsrespectively.Thebest-fit Epeak–Liso correla-tionsareshownassolidlineswiththecorresponding coloursand the inset plot shows the histograms of residuals. The slope (
γ
) andscatter(σsc
)ofthecorrelationsareshownattheedgesofthe figure. The 2σsc
scatter of the first and wholeresults are shown asorangeandcyan shaded area respectively.The Epeak–Lp,iso re-lationsfromthe totalsample of Navaetal. (2012)(black dashed line)andfromthecombinedshortandlongGRBsampleofZhang etal. (2012)(doubledot-dashedlines)arealsoshownfor compari-son.Lowerlimitsandprecursorsareshownwitharrowsandgreen symbolsrespectively.The Epeak and Liso quantities for both the whole and first re-sultsshow arobustcorrelationwithachanceprobabilityofbeing spurious of 4
×
10−7 and 10−3 respectively. While the formeris reminiscent ofthe Yonetokurelation (Section 3, Yonetoku et al., 2004), the latter isa newly identified Epeak–Liso relationholding duringthefirst0.3 s(restframe)ofallconsideredbursts.OurshortGRBsample istoosmalltoprovide astrongevidenceforthe ex-istence of a similar correlation (Pchance
=
0.
14). Nevertheless all shortGRBs lie within thesame region identified by the 2σsc
re-gionofthecorrelationsforthelongGBRs,andseemtofollowthe sametrend.Similar considerations apply when considering the Epeak–Eiso relations: both the first and whole results show strong correla-tions,whiletheshortisonlymarginallysignificant.However,inthe
Epeak–Eiso plane thefirstandshort burstslie onthesameregion, andare significantlyaway fromthewhole relation(see Calderone etal.,2015fordetails).
Insummary,whenconsideringtheintrinsicEpeak,Eiso andLiso spectralquantities,thespectraofboththeshortGRBsandthefirst 0.3s (rest frame)oflong onesare actually indistinguishable,
de-spitethelikelydifferentprogenitors anddifferenttotalenergy in-volved.Inparticular,ifalongGRB(whateveritsprogenitor)should lastlessthan
∼
0.3s(restframe)wewouldnotbeableto distin-guishitfromashortGRBwithcurrentdetectors.Wenotethatalso X-rayflares,thatarethoughtobe linkedtothepromptemission, show ahard-to-softevolution intime,albeit spanninga different energy range (e.g.Margutti etal., 2010). We identified two newEpeak–Eiso and Epeak–Liso correlations validduring the first 0.3s oflongGRBs,andall theshortGRBsinoursampleareconsistent withtheserelationswithinthescatter. Thesecorrelationssuggest that a common process may be at work in both short and long GRBs.
6. LagsofshortandlongGRBs
The presence of a positive spectrallag (i.e. the delay in the arrival times oflow-energy photons with respect to high-energy photons) has been considered a common feature of long GRB prompt emission (Cheng etal., 1995),and ithas beenused asa possibletooltodiscriminatebetweenlongandshortGRBs(Gehrels et al., 2006), since the latter tendto have a smaller lag (consis-tent with zero) with respect to long GRBs (Norris et al., 2001; NorrisandBonnell,2006).
Norris et al. (2000) showed that the positive spectral lag for long GRBs anti-correlates with the burst bolometric peak lumi-nosity, andthisanti-correlationhasbeenexploredandconfirmed with different samples (see also Norris, 2002; Schaefer, 2007; Hakkila et al., 2008; Arimoto et al., 2010; Ukwatta et al., 2010). The large increase inthe redshiftmeasurements available thanks totheadventofSwift(Gehrelsetal.,2004) allowedUkwattaetal. (2012)toperformthefirstdetailedanalysisofthespectrallagfor long GRBs,adoptingtwo selectedrest frameenergybandsforall the considered burst. They confirmedthe existence of the corre-lationwithasmallerscatterwhencomparedtopreviousanalyses inthe observer-frame(e.g.Ukwatta etal., 2010). However,in the determination ofthelag-luminosity correlationthey didnot
con-Fig. 7. Distribution
of the rest-frame spectral lags. Black: 50 long GRBs from the
BAT6 sample. Red: 6 short GRBs from the S-BAT4 sample. Inset: distribution of the observer-frame spectral lags. (For interpretation of the references to color in this figure legend, the reader is referred to the web version of this article.)sider44% ofthe GRBs oftheir original sample thathave spectral lagconsistentwithzeroornegative.
In Bernardini et al. (2015) we analysed the spectral lag for bothlong andshortGRBsin ordertoinvestigatethe opportunity to use it as a distinctive feature for these two classes of GRBs, and the role of negligible lags in the lag-luminosity plane. We considered two samples of 50 long and 6 short GRBs from the BAT6(Salvaterraet al., 2012) andS-BAT4 (D’Avanzoet al., 2014) completesamples,respectively.Sincethespectral lagvalue is de-pendent upon the energy bands chosen to compute it for both short(Abdoetal.,2009; Guiriecetal.,2010,2013)andlongGRBs (Ukwatta et al., 2010), we adopted two fixed rest-frame energy bands(100–150 keVand200–250 keV)toperform adirect com-parisonofthelagsofthetwoclassesoflongandshortGRBs.
Withthe background subtracted light curves observed by the
Swift/BurstAlert Telescope(BAT,Barthelmy etal.,2005) we com-puted the discrete cross-correlation function (CCF) asderived by
Band (1997)tomeasurethetemporalcorrelation ofthetwo light curvesinthetwodifferentenergybands.TheCCFismodelledwith anasymmetric Gaussianmodel tosearch foritsglobalmaximum that,bydefinition,correspondstothespectrallag
τ
.Wechoosean asymmetricGaussianmodelsince itreflects thenatural asymme-tryoftheCCFinheritedbytheasymmetryoftheGRBpulses(Band, 1997). Weaccountedforthe errorson thedatapoints through a MonteCarlomethodtoestimate theuncertaintyonτ
(Bernardini etal.,2015).Wefoundthat thespectrallag betweenthechosen restframe energy bands for long GRBs is significantly (within 1
σ
) greater thanzeroin mostcases(50%). Howeveran equally largefraction (50%) of them is consistent withzero or negative within errors. ShortGRBs have in all cases limited or no lag in the same rest frameenergybands(seeBernardinietal.,2015,thereinTable 1).The distributionof the spectral lagsfor shortGRBs ispeaked atasmallervalue than thelongGRB distribution(mean valueof thedistribution
⟨
τ
R FS⟩
= (−
0.
61±
3.
87)
ms compared to⟨
τ
R FL⟩
=
(
43.
0±
17.
8)
ms, seeFig. 7).However, there is nostronger than 2σ
statistical indication that the spectral lags ofshort and long GRBs are drawn from two different populations: if we perform a Kolmogorov–Smirnov (KS) test, the probability that the two samplesare drawn from thesame population is 4.
1%. The time-integratedspectral lagasa tooltodistinguish betweenshortand long GRBs might not be asdefinite asthought before: the exis-tenceofa large fractionoflong GRBs witha lag consistentwith zeromakesitchallengingtoclassifytheambiguousGRBs.Ifwe compare the distributions ofthe spectral lag inthe ob-server frame forlong and shortGRBs (see Fig. 7, inset), we find thatthemeanvaluesaremoreseparated(
⟨
τ
L⟩
= (
102.
2±
38.
1)
ms and⟨
τ
S⟩
= (−
0.
73±
7.
14)
ms), and with broader distributions (σ
L= (
375.
1±
69.
6)
ms andσ
S= (
16.
5±
7.
5)
ms) asa conse-quenceofthedifferentredshiftdistributionsoftheshortandlong GRBs:theaverageredshiftforthelongGRBsampleis⟨
zL⟩
=
1.
84whereasfortheshortGRBsampleis
⟨
zS⟩
=
0.
85 (Salvaterraetal., 2012; D’Avanzoetal.,2014).TheKStestgivesaprobabilityof2% thattheyaredrawnfromthesamepopulation.We considered all the GRBs with measured lags in our sam-ples(longandshort)thatalsohaveanestimateofthebolometric isotropic luminosity Liso to investigate the relation between the spectral lag and the GRB luminosity, namely 45 long GRBs and 6 shortGRBs. Forthevaluesof Liso andits definitionwereferto
Navaetal. (2012)andD’Avanzoetal. (2014).
Ifwerestrict ouranalysistoall longGRBs withpositive spec-tral lag (23; 51% of the sample), we find that the luminosity significantly anti-correlates with the spectral lag (Pearson cor-relation coefficient r
= −
0.
68, null-hypothesis probability P=
3.
8×
10−4). The best linear fit to the log(
Liso)
−
log[
τ
R F]
cor-relation that accounts for the statistical uncertainties on both axes yields: log
[
Liso/(
1052 erg s−1)
]
= (
0.
42±
0.
11)
+ (−
1.
79±
0.
03)
log[
τ
R F/
100 ms]
(see Fig. 8, inset). The scatterperpendicu-larto the correlation ismodelled witha Gaussian withstandard deviation
σ
=
0.
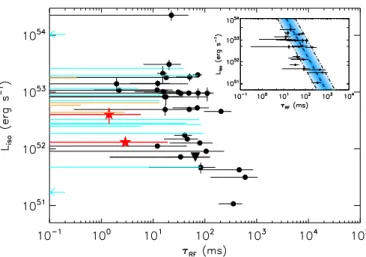
65.However,whenweaddtothelag-luminosity planealsothe20 long GRBs with lag consistent with zero within errors, no cor-relation between Liso and the spectral lag is anymore apparent (seeFig. 8). Therearealsotwo longGRBswithnegative lag(GRB 061021andGRB080721;cyanarrowsinFig. 8).
Short GRBs of our sample do not occupy a separate region of the lag-luminosity plane when compared to the total sample of long GRBs (see Fig. 8), because neither their distribution of the spectral lag is significantly different fromthe long GRB one, nor theluminosity distributions (KS probability P
=
38%). There-fore, the lag-luminosity correlation is questioned by these find-ings.7. Discussionandconclusions
TheclassicaldivisionofshortandlongGRBsbasedonthe hard-ness ratio(HR)versus duration (T90)plot (e.g.Kouveliotouetal.,
1993)signalsthatthetwopopulationsmighthavedifferent spec-tralproperties.Indeed,theHRisaproxyofthespectralshape:the comparisonofthespectralparameters(obtainedfromthefitofthe time integratedspectra) ofshortandlongGRBsshowsthat short eventsareharderthanlongonesdueto(a)aharder peakenergy
Epeak and(b)a harderlow energyspectral index
α
(Ghirlanda etal., 2004, 2009). However, any possible spectral diversity should alsoconsiderthepossibledifferentdistancescales ofthetwo pop-ulations. If short and long GRBs have different progenitors then SGRBsshouldbetypicallylocalisedatlowerredshiftswithrespect tolongonesduetothedelaytimebetweentheirformation(as bi-nary systems) andtheir merger. Ifwe consider a typical redshift
z
∼
0.
6 for SGRBs and z∼
2.
1 for long ones, the comparison of therestframespectralpropertiesshowsthatshortandlongGRBs havesimilar peak energies andthey only differ fora harder low energy spectral component in short GRBs. Similar considerations should be extended alsoto the short/longdivide (i.e. T90=
2 s). It hasbeenargued(Brombergetal., 2012) thatthe characteristic timescale forthejet todrillout theprogenitor starinlongGRBs (i.e.∼
10 s)couldbeassociatedtothebreakinthedifferential du-rationdistributionobservedinthepopulationofGRBsdetectedby different satellites.This argument hasbeen used to quantify the percentage of contamination of long GRBs (produced bycollap-JID:JHEAP AID:20 /REV [m5G; v1.151; Prn:22/04/2015; 13:12] P.8 (1-9) 8 G. Ghirlanda et al. / Journal of High Energy Astrophysics•••(••••)•••–•••
Fig. 8. Peak
luminosity
Lisoas a function of the rest-frame spectral lag. Black points: long GRBs with positive central value of the spectral lag (23 with positive lag and 9 with positive lag consistent with zero within errors). Cyan error bars: long GRBs with negative central value of the spectral lag (2 with negative lag, marked as left arrows, and 11 with negative lag consistent with zero within errors). Red stars: short GRBs with positive central value of the spectral lag (2 with positive lag consistent with zero within errors). Orange error bars: short GRBs with negative central value of the spectral lag (4 with negative lag consistent with zero within errors). The black triangle corresponds to GRB 100816A. Inset: lag-luminosity anti-correlation for the 23 long GRBs with positive lag. The black dashed line is the best fit to the data: log[Liso/(1052erg s−1)]= (0.42 ±0.11)+ (−1.79 ±0.03)log[τR F/100 ms], and the blue area marks the 1σregion around the best fit. (For interpretation of the references to color in this figure legend, the reader is referred to the web version of this article.)
sar)inanysampleofshortGRBsselectedsolelyfortheirobserver frameduration.Ifagainweconsiderthedifferentdistancescaleof thetwopopulations,however,theevidenceofthebreakintheT90 distributionishighlyreduced(Fig. 4).
TheintrinsicpropertiesofshortandlongGRBsshowthatthey share similar luminosities and follow similar correlations in the
Epeak–Liso plane. Short GRBs are less energetic than long events andtheymightdefine(althoughwestillhavefewevents)a paral-lel correlation to the Epeak–Eiso defined by long events (Fig. 5). Despite still based on a limited number of events, these re-sultshavebeenobtainedwithcomplete well selectedsamplesof long and short GRBs (Salvaterra et al., 2012; Nava et al., 2012; D’Avanzoet al., 2014). Therefore,forwhat concerns thetime av-erage(overtherespectiveduration)spectralproperties,shortand long GRBs have similar luminosities anddifferent energetics (i.e. proportional to the ratio of their average durations). However, GRBs show a considerable spectral evolution which seems to be similarinshortandlongevents(Ghirlandaetal.,2011).Whenthe spectraofshortGRBsarecomparedtothetimeslices(of approx-imately thesame sizeasthe typical restframeduration ofshort events) of long GRBs (Fig. 6) it appears that long GRBs start as shortones(Calderoneetal.,2015).
Finally,ithasbeenassumedforyearsthatthespectrallagwas adistinctivefeatureofshortandlongGRBswiththeformerhaving nulllag (Norrisetal., 2001; NorrisandBonnell,2006).Adetailed analysis(throughthedefinitionofcompletesamplesofshortand longGRBswithmeasuredredshifts)ofthespectrallagsintherest frame has shown (Fig. 7) that also long GRBs can have null lag (Bernardinietal.,2015).Inthesamelinewecouldalsoshowthat thelag-luminositycorrelation holdingforlong GRBscouldhavea largenumberofoutlierssinceseverallongGRBs(
∼
50%)canhave anullornegativelags.All these considerations seem to point toward the possibility thatshortandlongGRBs couldbe producedby different progen-itors but the emission mechanism responsible for their prompt emissionmightbesimilar,withtheexceptionofbeingableto pro-duce a harder low energy spectral componentin shortevents. If thisisrelatedtothespectralevolution,itmightbethatshortGRBs aresimilar tothebeginningoflongevents,wherethelonger du-rationofthecentralengineallowsforthespectrumtoevolveand become softer so that the overall time integrated spectrum also results softer. This would also suggest that the lagsof long and
shortevents shouldnot be differentaspossibly demonstratedby ouranalysis.
Acknowledgments
G.G. andG.C. thankINAF/PRIN2011forfinancialsupport(grant number1.05.01.09.15).Therefereeisacknowledgedforuseful com-ments.G.Ghiselliniisacknowledgedforstimulatingdiscussions.
References
Abdo,A.A.,Ackermann,M.,Ajello,M.,etal.,2009.Nature 462,331–334. Amati,L.,etal.,2002.Astron.Astrophys. 390,81.
Arimoto,M.,Kawai,N.,Asano,K.,etal.,2010.Publ.Astron.Soc.Jpn. 62,487. Band,D.,etal.,1993.Astrophys.J. 413,281.
Band,D.L.,1997.Astrophys.J. 486,928–937.
Barthelmy, S.D.,Barbier,L.M., Cummings, J.R.,et al., 2005. Space Sci. Rev. 120, 143–164.
Berger,E.,2014.Annu.Rev.Astron.Astrophys. 52,43.
Bernardini,M.G.,Margutti,R.,Zaninoni,E.,Chincarini,G.,2012.Mon.Not.R.Astron. Soc. 425,1199.
Bernardini, M.G., Ghirlanda, G., Campana, S., et al., 2015. Mon. Not. R. Astron. Soc. 446,1129–1138.
Bošnjak, Ž., Götz, D., Bouchet, L., Schanne, S., Cordier, B., 2014. Astron. Astro-phys. 561,AA25.
Bromberg,O.,Nakar,E.,Piran,T.,Sari,R.,2013.Astrophys.J. 764,179. Bromberg,O.,Nakar,E.,Piran,T.,Sari,R.,2012.Astrophys.J. 749,110.
Calderone,G.,Ghirlanda,G.,Ghisellini,G.,Bernardini,M.G.,Campana,S.,Covino,S., D’Avanzo,V.D.,Melandri,A.,Salvaterra,R.,Sbarufatti,B.,Tagliaferri,G.,2015. Thereisashortgamma-rayburstpromptphaseatthebeginningofeachlong one.Mon.Not.R.Astron.Soc. 448,403–416.
Cheng,L.X.,Ma,Y.Q.,Cheng,etal.,1995.Astron.Astrophys. 300,746. D’Avanzo,P.,Salvaterra,R.,Bernardini,M.G.,2014.arXiv:1405.5131. deUgartePostigo,A.,etal.,2011.Astron.Astrophys. 525,AA109. Frontera,F.,etal.,2009.Astrophys.J.Suppl.Ser. 180,192.
Gehrels,N.,Chincarini,G.,Giommi,P.,etal.,2004.Astrophys.J. 621,558. Gehrels,N.,Norris,J.P.,Barthelmy,S.D.,etal.,2006.Nature 444,1044–1046. Ghirlanda,G.,Celotti,A.,Ghisellini,G.,2002.Astron.Astrophys. 393,409. Ghirlanda,G.,Ghisellini,G.,Celotti,A.,2004.Astron.Astrophys. 422,L55. Ghirlanda,G.,Nava,L.,Ghisellini,G., Celotti,A.,Firmani,C.,2009. Astron.
Astro-phys. 496,585.
Ghirlanda,G.,Ghisellini,G.,Nava,L.,2011.Mon.Not.R.Astron.Soc. 418,L109. Goldstein,A.,Preece,R.D.,Mallozzi,R.S.,Briggs,M.S.,Fishman,G.J.,Kouveliotou,C.,
Paciesas,W.S.,Burgess,J.M.,2013.Astrophys.J.Suppl.Ser. 208,21. Goldstein,A.,etal.,2012.Astrophys.J.Suppl.Ser. 199,19.
Golkhou,V.Z.,Butler,N.R.,2014.Astrophys.J. 787,90. Gruber,D.,etal.,2014.Astrophys.J.Suppl.Ser. 211,12.
Guiriec,S.,Briggs,M.S.,Connaugthon,V.,etal.,2010.Astrophys.J. 725,225–241. Guiriec,S.,Daigne,F.,Hascoët,R.,etal.,2013.Astrophys.J. 770,32.
Hakkila,J.,Giblin,T.W.,Norris,J.P.,etal.,2008.Astrophys.J.Lett. 677,L81–L84. Horváth,I.,1998.Astrophys.J. 508,757.
Kaneko,Y.,Preece,R.D.,Briggs,M.S.,Paciesas,W.S.,Meegan,C.A.,Band,D.L.,2006. Astrophys.J.Suppl.Ser. 166,298.
Kouveliotou,C.,Meegan,C.A.,Fishman, G.J.,Bhat,N.P., Briggs,M.S.,Koshut,T.M., Paciesas,W.S.,Pendleton,G.N.,1993.Astrophys.J. 413,L101.
Levan,A.J.,etal.,2014.Astrophys.J. 781,13.
MacLachlan,G.A.,etal.,2013.Mon.Not.R.Astron.Soc. 432,857.
MacLachlan,G.A.,Shenoy,A.,Sonbas,E.,Dhuga,K.S.,Eskandarian,A.,Maximon,L.C., Parke,W.C.,2012.Mon.Not.R.Astron.Soc. 425,L32.
Margutti,R.,Guidorzi,C.,Chincarini,G.,etal.,2010.Mon.Not.R.Astron.Soc. 406, 2149–2167.
Margutti,R.,etal.,2013.Mon.Not.R.Astron.Soc. 428,729. Nakar,E.,Piran,T.,2002.Mon.Not.R.Astron.Soc. 330,920.
Nava,L.,Ghirlanda,G.,Ghisellini,G.,Celotti,A.,2011a.Mon.Not.R.Astron.Soc. 415, 3153.
Nava,L.,Ghirlanda,G.,Ghisellini,G.,Celotti,A.,2011b.Astron.Astrophys. 530,AA21. Nava,L., Salvaterra,R.,Ghirlanda,G.,etal., 2012.Mon. Not.R.Astron.Soc. 421,
1256–1264.
Norris,J.P.,2002.Implicationsofthelag-luminosityrelationshipforunified gamma-rayburstparadigms.Astrophys.J. 579,386–403.
Norris,J.P.,Bonnell,J.T.,2006.Astrophys.J. 643,266–275.
Norris,J.P.,Marani,G.F.,Bonnell,J.T.,2000.Astrophys.J. 534,248–257.
Norris,J.P.,Scargle,J.D.,Bonnell,J.T.,2001.In:Costa,E.,Frontera,F.,Hjorth,J.(Eds.), Gamma-RayBurstsintheAfterglowEra,p. 40.
Norris, J., Ukwatta, T.N., Barthelmy, S.D., Gehrels, N., Stamatikos, M., Sakamoto, T., 2010. GCN 11113, 1.
Preece,R.D.,Briggs,M.S.,Mallozzi,R.S.,Pendleton,G.N.,Paciesas,W.S.,Band,D.L., 2000.Astrophys.J.Suppl.Ser. 126,19.
Pélangeon,A.,etal.,2008.Astron.Astrophys. 491,157. Qin,Y.,etal.,2013.Astrophys.J. 763,15.
Qin, Y.-P., Xie, G.-Z., Liang, E.-W., Zheng, X.-T., 2001. Astron. Astrophys. 369, 537.
ˇRípa, J., Mészáros, A.,Wigger,C., Huja, D., Hudec, R., Hajdas,W., 2009. Astron. Astrophys. 498,399.
Salvaterra,R.,Campana,S.,Vergani,S.D.,etal.,2012.Astrophys.J. 749,68. Sakamoto,T.,etal.,2005.Astrophys.J. 629,311.
Sakamoto,T.,etal.,2011.Astrophys.J.Suppl.Ser. 195,2.
Savchenko,V.,Neronov,A.,Courvoisier,T.J.-L.,2012.Astron.Astrophys. 541,AA122. Schaefer,B.E.,2007.Astrophys.J. 660,16–46.
Tavani,M.,1998.Astrophys.J. 497,L21.
Tsutsui,R.,Yonetoku,D.,Nakamura,T.,Takahashi,K.,Morihara,Y.,2013.Mon.Not. R.Astron.Soc. 431,1398.
Ukwatta,T.N.,Dhuga,K.S.,Stamatikos,M.,etal.,2012.Mon.Not.R.Astron.Soc. 419, 614–623.
Ukwatta,T.N.,Stamatikos,M.,Dhuga,K.S.,etal.,2010.Astrophys.J. 711,1073–1086. vonKienlin,A.,etal.,2014.Astrophys.J.Suppl.Ser. 211,13.
Zhang,F.-W.,Shao,L.,Yan,J.-Z.,Wei,D.-M.,2012.Astrophys.J. 750,88.
Yonetoku,D.,Murakami,T.,Nakamura,T.,Yamazaki,R.,Inoue,A.K.,Ioka,K.,2004. Astrophys.J. 609,935.