Controlling electroosmotic flows by polymer coatings: A joint
experimental-theoretical investigation
Michele Monteferrante, Laura Sola, Marina Cretich, Marcella Chiari, Umberto Marini Bettolo Marconi, and Simone Melchionna
Citation: The Journal of Chemical Physics 143, 184907 (2015); doi: 10.1063/1.4934998 View online: http://dx.doi.org/10.1063/1.4934998
View Table of Contents: http://scitation.aip.org/content/aip/journal/jcp/143/18?ver=pdfcov Published by the AIP Publishing
Articles you may be interested in
Electro-osmotic flow of semidilute polyelectrolyte solutions J. Chem. Phys. 139, 094901 (2013); 10.1063/1.4820236
Mass flow-rate control through time periodic electro-osmotic flows in circular microchannels Phys. Fluids 20, 083602 (2008); 10.1063/1.2949306
Electroosmotic flow in vapor deposited silicon dioxide and nitride microchannels Biomicrofluidics 1, 034101 (2007); 10.1063/1.2752376
Flow and species transport control in grooved microchannels using local electrokinetic forces Phys. Fluids 19, 013601 (2007); 10.1063/1.2432893
Control of electro-osmostic flow by light
Controlling electroosmotic flows by polymer coatings: A joint
experimental-theoretical investigation
Michele Monteferrante,1Laura Sola,1Marina Cretich,1Marcella Chiari,1
Umberto Marini Bettolo Marconi,2and Simone Melchionna3,a)
1Consiglio Nazionale delle Ricerche, Istituto di Chimica del Riconoscimento Molecolare (ICRM-CNR),
Via Mario Bianco, 20131 Milan, Italy
2Scuola di Scienze e Tecnologie, Università di Camerino, Via Madonna delle Carceri, 62032 Camerino, Italy
and INFN Perugia, Perugia, Italy
3Department of Physics, Consiglio Nazionale delle Ricerche, Istituto Sistemi Complessi (ISC-CNR),
University La Sapienza, P. le A. Moro 2, 00185 Rome, Italy
(Received 23 September 2015; accepted 19 October 2015; published online 13 November 2015)
We analyze the electroosmotic flow (EOF) of an electrolytic solution in a polymer coated capillary electrophoresis tube. The polymeric density, charge, thickness, and the capillary tube charge vary as a function of pH and produce a non-trivial modulation of the EOF, including a flow reversal at acid pH conditions. By means of a theoretical argument and numerical simulations, we recover the experimental curve for the EOF, providing a firm approach for predictive analysis of electroosmosis under different polymeric coating conditions. A proposed application of the approach is to determine the near-wall charge of the coating to be used for further quantitative analysis of the electroosmotic flow and mobility. C 2015 AIP Publishing LLC.[http://dx.doi.org/10.1063/1.4934998]
I. INTRODUCTION
Capillary electrophoresis (CE) is a well established tech-nique that continues to grow and extend applicability to a wide class of compounds, including pharmaceutical products and biopolymers such as proteins, polysaccharides, and DNA.1–4
CE combines the advantages of electrophoretic separation principles with automation, high-throughput, and miniatur-ization, providing fast and efficient separations. One of the most distinguishing features of CE is the electroosmotic flow (EOF), the electrokinetic phenomenon that originates from the presence on the silica capillary wall of weakly acidic hydroxyl groups attached to the silicon atoms.5–7EOF and the resulting overall solution transport phenomenon has dramatic influences on the time the analytes reside within the capillary and on the separation efficiency.8–12
Various approaches have been evaluated to optimize sepa-ration, such as using buffers with extreme pH values and ionic strengths13 or zwitterionic additives14 and permanent
coatings achieved by introducing surface anchoring groups through organosilanization, followed by the covalent attach-ment of polymers.15 The precise control of EOF in
capil-lary and microchip-based electrophoresis by means of ad-sorbed and covalent polymeric wall coatings leads to impor-tant improvements in CE techniques.16–21 The suppression
of EOF to a negligible value and the prevention of analyte adsorption at the walls enable the separation of proteins within microchannels and provide excellent performances in terms of migration time reproducibility. This is particularly relevant for the positively charged alkaline proteins.
Adsorption of proteins is indeed the main cause of peak broadening and loss of separation efficiency, which are often
a)Electronic address: [email protected]
observed in CE analysis. Moreover, by suitably modifying the walls one can tune the EOF or even revert its direction in order to achieve a required separation condition. Manipulation of the EOF is used to achieve optimized separation conditions for CE and cationic surfactants,22and ionic liquid organic solutions23
and polymer chains24have been proposed for this purpose. A
ter-copolymer of N,N-dimethylacrylamide (DMA), glycidyl methacrylate (GMA), and 3-(trimethoxysilyl) propyl meth-acrylate (MAPS) was first introduced by our group21 as a
polymeric coating for suppressing EOF and protein wall inter-actions in capillary electrophoresis. The coating procedure is easy, fast, and robust and provides a hydrophilic functional film covalently bound to the surface. The presence of pendant silane groups is critical for ensuring the formation of a stable polymer film on various substrates.25The robustness of the coating is also a result of the other two components, DMA that interacts with substrates through hydrogen bonding, and GMA that en-hances the solidity of the film by reacting with surface silanols. In an attempt to further improve the performance of the coating we have added an additional ingredient that confers to the polymer a positive charge. To this purpose, we have introduced into the polymer a weak base R= N,N-dimethylaminoethyl acrylamide (see Figure1) with a pKa value of 8.5. The effect of the weak base is to alter the structure, thickness, density, and charge of the coating and consequently generating a peculiar EOF response that is not yet understood.
The aim of the present paper is to provide a direct interpre-tation of the experimental observations based on a theoretical analysis and computer simulations, as presented in a previous publication.26To this purpose, we model the capillary as coated by a polymer-rich region assimilated to a porous medium, and a polymer-free region, governed by the conventional electroos-motic equations. In addition, since the structure of the electric double layer (EDL) depends on the charge of the polymer and
0021-9606/2015/143(18)/184907/8/$30.00 143, 184907-1 © 2015 AIP Publishing LLC
184907-2 Monteferrante et al. J. Chem. Phys. 143, 184907 (2015)
FIG. 1. Chemical structure of the polymer used to form the coating.
affects substantially the structure and direction of the EOF, we consider both the linear and fully non-linear solution of the EDL equations and provide a direct insight into the coating-EOF dependence. In addition, the present approach reveals the direct connection between EOF and the polymer coating de-tails and charge. Given that the latter is the result of a complex near-wall dissociation process, we use such a connection to determine the local polymeric charge based on the EOF data.
II. EXPERIMENTS
The surface of the capillary is coated with a copolymer of DMA, GMA, MAPS, and N,N-dimethyl aminoethyl acrylamide, whose chemical structure is shown in Fig.1. This coating has been recently introduced by our group and will be the object of a forthcoming publication.
In order to stabilize the polymer layer by introducing electrostatic interactions between the negative charges of the wall surface and the positive charges on the polymer as well as to improve the separation profile of positively charged pro-teins by electrostatic repulsion between protein and polymer positive charges, the key component of the polymer coating is the monomer bearing a tertiary amino group. This weak base has a pKa value of 8.5. The charge of the monomer depends on the pH as defined by the Henderson-Hasselbalch equation,
which regulates the ratio between protonated and deprotonated ionizable groups as a function of pH and pKa.
The coating is formed by physi-chemisorption of a thin layer of polymer onto the capillary wall. The characteristics of the polymer layer in terms of mass adsorbed per surface unit (ng/mm2), thickness (nm), and density (ng/cm3) were determined using dual polarization interferometry (DPI), an analytical technique that probes molecular layers adsorbed to the surface of a waveguide using the evanescent wave of a laser beam.27
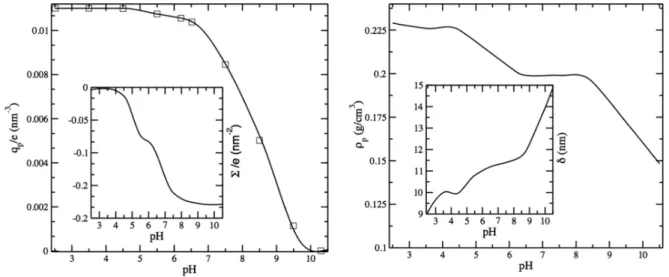
The graph of Figure2allows the calculation of the nom-inal fraction of charged monomers and shows that monomer is fully protonated for a pH ranging from 2 to 4.5; above this value the positive charge diminishes as part of the amino parts becoming deprotonated. When the monomer is fully charged, the number of positive charges per cm2is approximately 1011.
This nominal charge was determined considering the amount of polymer mass adsorbed on the wall as measured by DPI and the fact that there are 2 ng/cm2of polymer and 95% of polymer is made of DMA. By approximating the molecular weight (Mw) of all the four monomers to 99 Da (the Mw of the major constituent), one then calculated the moles of charged monomer in the polymer and, through Avogadro’s number, the number of positive charges per surface unit.
The positive monomer, N,N-dimethyl aminoethyl acrylamide, is not the only monomer that contributes to the polymer charge. MAPS bears three silanol groups that progres-sively dissociate as the pH increases thus generating negative immobilized charges similar to those of the glass interface underneath. Since the mole percent of this monomer is 1% and each monomer has three ionizable groups a considerable contribution to the overall charge of the polymer can be expected from this monomer. Unfortunately, since pKa values and degree of condensation of this monomer with the surface silianols and among themselves are not known, it is difficult to precisely calculate the contribution of silanol’s dissociation to the overall charge.
To avoid uncontrolled approximations, we decided to either take a polymeric charge equal to 19% of the nominal one for all pH values in order to match at best the curves,
FIG. 2. Left panel: experimental polymeric charge density vs pH and surface charge density (inset). Right panel: experimental polymeric mass density and coating thickness (inset).
such reduction being a good compromise to match the low pH plateau and the reversal point, or to optimize the e ffec-tive charge of the polymer by matching the obtained experi-mental and theoretical EOF curves. The latter approach allows us to use the capillary as an accurate charge measurement device.
III. THEORETICAL ANALYSIS
In order to interpret the experimental data and make predictions when these are not available, we employ a model previously formulated by our group to describe EOF in capil-laries coated by polymers.28The geometry consists of a
slit-like tube and periodic along the tube axis, a setup that repro-duces the characteristics of tubes of large radii and allows for the algebraic calculations. The capillary wall is charged as prescribed by the dissociation equilibrium of silica. In our framework, the electrolytic fluid is accounted for by a ternary solution, representing the solvent and the two ionic species, being monovalent cations and anions of equal mass and diffusion coefficients.
Our theoretical analysis uses two distinct approaches. On one approach, we analyze the equations governing electroos-motic flow in the presence of the polymer coating. To this end, we first solve the linearized Poisson-Boltzmann equation giving the charge distribution in the direction orthogonal to the capillary wall (see Equation(2)below). Then, we assim-ilate the polymeric region to a porous medium and impose appropriate matching conditions for the flow solutions in the polymer-rich and polymer-free regions.29
The second approach consists of solving the governing equations by means of the Lattice Boltzmann (LB) scheme.30,31
In the LB approach, the equations are solved numerically at electrokinetic level and in full three dimensions.32 The LB method represents the motion of a fluid in terms of distribution functions that, by suitable projections, give the hydrodynamics fields such as density, momentum density, and temperature. The LB approach does not require any averaging in time and thus bypasses the computational cost of typical Brownian or molecular dynamics simulation methods. In addition, electro-statics is solved on-the-fly as the ionic species rearrange their structure. Therefore, the solution of the non-linear Poisson-Boltzmann equation is obtained at zero flow conditions.
The effect of the polymer coating on the solution is to slow down the flow in the polymer-rich region. The frictional forces exerted on the fluid are a function of the polymer density, its chemical structure, and the degree of grafting on the capillary wall. In the LB simulations, we mimic the presence of the poly-mer coating by introducing an array of particles (scatterers) of assigned charge and placed randomly and uniformly within the polymeric region. The scatterers’ density is the same as the experimental one; however, they bear no excluded volume and do not modify their position in time or as a function of the EOF. The assumption of immobile scatterers is reasonable if the flow does not perturb substantially the coating and if the coverage is high enough. The charge per scatterer can be assigned to reproduce the experimental values of the poly-meric molar charge if the value within the coating layer is known.
In order to account for the frictional forces, each scatterer slows down locally the fluid solution by means of a frictional coefficient γ, such that the fluid element experiences a body force −γu, u being its local velocity. The frictional force has a direct counterpart in the theoretical treatment, by realizing that the polymeric region can be treated as a porous medium with permeability k, so that γ= η/k, where η is the solution dy-namic viscosity. Therefore, for the two theoretical approaches, γ is the only free parameter and is chosen empirically in order to match globally the experimental and theoretical EOF curves vs pH.
Importantly, in the LB simulations, we consider a small portion of the capillary tube, where typically the polymer-free region width is larger than the polymer coating thickness. In the finite LB geometry, the EOF mobility is computed by considering the tube lateral dimension large enough such that at the center of the tube the flow profiles show a plateau (negligible finite-size effects) and by taking the maximum of the velocity profile at the center of the tube. Such assumption holds true in the macroscopic limit, where the sectional average velocity equals the velocity maximum. In the LB simulations, the polymer thickness is always taken from the experimentally determined value, while the polymer-free region is always taken to have a width of 30 nm.
Both the numerical simulations and the analytical calcu-lations are conducted for coated and uncoated capillaries. The latter condition is chosen as our initial benchmark in order to validate the numerical data on electroosmotic mobility as compared to the experimental ones.
The uncoated capillary is also used to determine the sur-face charge of silica, Σ, and to establish a correspondence between the pH and Σ. In order to account for the presence of the buffer, we consider the electrophoretic mobility for an uncoated capillary and express the zeta potential ζ as a function of the experimental electrophoretic mobility µ,
ζ = η µϵ , (1)
where η is the shear viscosity of the fluid and ϵ is the dielectric permittivity of water. Finally, the surface charge is obtained by means of the Grahame formula Σ(ζ) = 2λDen±0sinh
eζ 2kBT =2λDen±0sinh eη µ 2ϵkBT
, with kBbeing the Boltzmann constant
and T the absolute temperature, e the elementary charge, kD
is the inverse Debye length, given by λD= k−1D =
ϵkBT e2(n+ 0+n − 0) , where n±
0are the overall counterion and coion number densities
in the bulk solution, being equal between them.
In our buffer conditions, the Debye length is chosen to be 2.3 nm, which is always much smaller than the polymer thickness that typically ranges between 9 and 15 nm.
The simplest manifestation of electroosmotic flow is the motion of the electrolytic solution in the tube and is caused by the movement of the ionic charges within the EDL, which form in the liquid in response to the surface charges.
In the creeping flow regime (low Reynolds number), the movement of the charges within the EDL is transmitted through viscous forces to the rest of the fluid whose velocity at the center of the tube, u, is given by the Helmholtz-Smoluchowski formula: u= µE.
184907-4 Monteferrante et al. J. Chem. Phys. 143, 184907 (2015)
Since in many practical situations, it is desirable to finely control the EOF, such that in CE the motion of the migrating macromolecules can be tuned, it is beneficial to reduce or even quench the EOF mobility by coating the capillary walls by the grafted polymers. However, in the presence of the coating, the theoretical description becomes more complicated, as the polymer may drag the fluid and the polymeric charges also influence the EDL. The theoretical modelling must take into account the existence of regions with different physical prop-erties.
One must distinguish a layer near the wall where the poly-mer is confined and an inner polypoly-mer-free region. Within the layer adjacent to the wall and of thickness δ the presence of the polymer has two effects: (a) it modifies the Stokes equation by introducing a drag term proportional to the local flow velocity and (b) provides an additional contribution to the electric field, since the monomers are charged.
The three components of the electrolyte solution are de-noted by 0, −,+, where 0 identifies the solvent, − and + indicate the anions and the cations, respectively. Their charges are zαe (with z0= 0), expressed in units of the electronic charge e and are free to move in a slit-like channel whose parallel walls, which coincide with the planes at z= ±w, are impenetrable and carry a fixed surface charge of density per unit area Σ, which is negative in the cases here considered.
In our treatment, the ionic charge distribution is deter-mined by the linearized Poisson-Boltzmann equation for the electrostatic potential φ, reading
d2φ dz2 = − en+0 ϵ e−eφ/kBT+ en− 0 ϵ eeφ/kBT− ezsns ϵ Θ ≈ k2Dφ − ezsns ϵ Θ+ enD ϵ , (2)
where nD= −(n+0− n−0) and the function Θ(z)
= (θ(w − h − z) + θ(z − w + h)), constructed as the sum of two Heaviside functions, describes the localization of the poly-mers in two slabs adjacent to the walls. Notice that in the r.h.s. of Eq. (2) we separated the source into three contributions, the first two taking into account the mobile ionic charges and the third the fixed charges of the monomers. In the analytic treatment, we employ the linear Debye-Huckel approximation for the electrostatic potential corresponding to the second approximated equality in Eq.(2), whereas in the LB treatment we consider the full non-linear Poisson-Boltzmann equation. The steady state fluid velocity is governed by the Stokes equation
η ∂2
∂z2ux= γ ρmΘ(z)ux+ ϵE
∂2
∂z2φ + ezsEnsΘ, (3)
where the last term in the right hand side is due to the fact that the polymer charge density, zsnsΘ, does not contribute to the
flow but is fixed. We introduced the driving electric field E parallel to the walls. No-slip boundary conditions are applied to the fluid velocity at the walls, and continuity of the velocity and of its derivative is applied at x= ±(w − h). The normal component of the electric field at the wall is subject to the condition of being
Ew= Σϵ. (4)
The associated value of the potential at the wall is ζ . The analytic solution of the coupled system of equations is obtained in the linear approximation to Poisson-Boltzmann equation(2) by imposing the continuity of the electric potential and electric field at the polymer-fluid interface as presented in Ref.26and reads φ(z) = Acosh(kDz) + ezsns ϵ k2 D (1 − sinh(kDh)e−kD|z|) if w ≥ |z| ≥ h ˜ Acosh(kDz) if h ≥ |z| ≥ 0 , (5) with A= 1 sinh(kDw) * , Σ ϵ kD −ezsns ϵ k2 D sinh(kDh)e−kDw+ -, (6) ˜ A= A +ezsns ϵ k2 D e−kDh. (7)
In order to obtain the velocity ux(z) we use the following trial function:
ux(z) = G cosh(kDz) + F if h ≥ |z| ≥ 0 ux(z) = C cosh( βz) + D cosh(kDz) + Be−kD|z|− ezsExns η β2 if w ≥|z| ≥ h , (8)
where the inverse length β is
and determine the three constants D, B, G by substituting(5)and(7)into(3), D=ϵ Ex η k2D k2D−β2A, B= −Ex η ezsns k2D−β2sinh(kDh), G=ϵ Ex η A.˜ (9)
Finally, by imposing that the fluid velocity is continuous at z= ±h and vanishes at the walls, z = ±w, we determine C, F, Ccosh( βw) = −D cosh(kDw) − Be−kDw+ ezsExns η β2 ,
F= C cosh(βh) + D cosh(kDh) + Be−kDh− G cosh(kDh) −
ezsExns
η β2 .
(10)
When the polymeric charge vanishes we find that the mobility, ux(0)/Ex, of the fluid at the center of the slit is
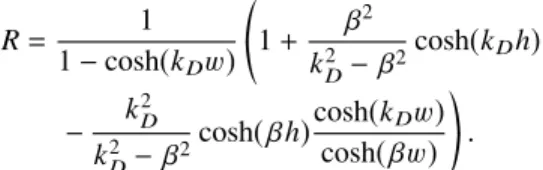
reduced with respect to the polymer free case by a factor R given by R= 1 1 − cosh(kDw) * , 1+ β 2 k2 D−β2 cosh(kDh) − k 2 D k2D−β2cosh( βh) cosh(kDw) cosh( βw)+ -.
A similar, but more lengthy, expression can be derived in the case of a charged polymer coating starting from Eq. (8) at z= 0.
IV. RESULTS AND DISCUSSION
At first, we take the nominal charge of the polymer coating as our reference value to be inserted in the analytical and simulation treatments. The experimental polymeric charge is given by Fig.2, left panel. On the other hand, the silica surface charge (Fig.2, left panel inset) is determined starting from the
EOF mobility in the uncoated capillary, as detailed in Sec.III. The silica is charged negatively and the polymer is charged positively.
In the case of the charged coating, the electric potential de-pends altogether on the surface charge, the polymeric charge, and the ionic charge in the EDL. For low values of the negative surface charge, that is, at acid pH, we observe an EOF reversal. The flow reversal is as large as the direct flow at basic pH and, as previously reported17,26,33the overall polymeric charge per
unit surface does not need to be larger in the absolute value than the surface charge in order to induce the reversal.
Given the above, we determined how the EOF curves depend on the polymeric charge and the intensity of the fric-tional forces, as shown in Fig.3. The polymeric charge features a strong dependence of the mobility at lower pH, due to the major role of the polymeric charge on modulating the mobility, together with a wide variability of the reversal point (that is, the pH at which the EOF is zero).
Therefore, the polymer charge is initially determined ad hocby matching the experimental and theoretical EOF curves,
FIG. 3. Electroosmotic mobility vs. pH as obtained theoretically for different values of the polymeric charge density (left) and of the frictional coefficient (right panel).
184907-6 Monteferrante et al. J. Chem. Phys. 143, 184907 (2015)
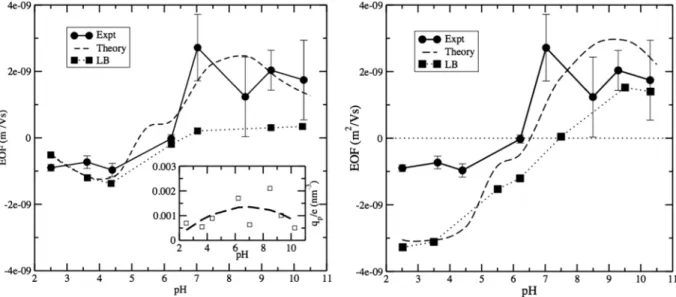
FIG. 4. Mobility versus pH as obtained from experiments (circles), the analytical theory (dashed line), and LB simulations (squares). Top panel: EOF obtained by optimizing the effective polymeric charge such that the experimental and theoretical curves match. The resulting effective charge corresponding to the experimental points is reported in the inset. Bottom panel: EOF obtained by taking 19% of the nominal polymeric charge. For the experimental and LB simulation data, the lines are guides for the eye.
as shown in Fig.4. The resulting effective polymeric charge, taking into account both the protonation state and the self-dissociation of silanoles, is shown in Fig.4, inset. It is worth noticing that the effective charge is about 0.001 e/nm3 and has a rather flat dependence on pH, in contrast to the nominal polymeric charge of Fig. 2. Once the effective charge has been determined, our procedure allows us to finely reconstruct the experimental EOF curve and reveals that the non-trivial oscillatory pattern of the EOF profile has a counterpart in the theoretical curve.
In our second approach, we take the experimental nominal charge of the polymer as an input to the theoretical analysis and notice that the theoretical EOF mobility is larger by a factor ∼20 in the low pH region as compared to the experimental one. One explanation for such a difference is the fact that
silanoles are dissociated in the buffer solution, with a dissoci-ation equilibrium that depends on the pH. At the same time, as the inset of Fig.4shows, the effective polymeric charge that matches at best by theoretical prediction with the experimental EOF curves has a weak dependence on pH. Therefore, we simply take the effective polymeric charge equal to 19% of the nominal one for all pH values as a tentative lumped value that accommodates the effect of dissociation. Such a choice allows us to match at best the curves without any further ad hoc optimization and is shown to be a good compromise in order to match the low pH plateau and the reversal point.
The central results in Fig.4exhibit a good match between the experimental and theoretical curves at basic pH, a similar reversal point, and mismatch in the acid pH region. The overall shape of the curves is similar for all approaches, in particular,
FIG. 5. Density profiles of the counter and co-ions along the orthogonal direction at pH 3.5 (left panel) and pH 7.5 (right panel). The gray zones indicate the polymer coated regions, with polymer charge densities, qp/e, equal to 1.8 × 10⁻³nm−3and 1.2 × 10⁻³nm−3, respectively, for pH 3.5 and 7.5. The polymeric charge is taken as 19% of the nominal polymeric charge. The inset represents a zoom in of the figure to appreciate the differences between the curves.
FIG. 6. Velocity profiles of the analytical results (barycentric velocity) and the LB solutions for polymer charge densities, qp/e, equal to 1.8 × 10⁻³nm−3and 1.2 × 10⁻⁵nm−3, respectively, for pH 3.5 (left) and pH 9.5 (right panel). The gray zones indicate the polymer coated regions. The polymeric charge is taken as 19% of the nominal polymeric charge. The range of the coordinates axis is different because the box length along the orthogonal direction was chosen such as to have the polymer-free region fixed to 30 nm (while the polymer thickness increases).
by having a plateau at low pH and a bell shape in the high pH region. Interestingly, the theoretical and LB results present some degree of departures in the high pH region, probably arising from different accuracies of the linearized versus the fully non-linear Poisson-Boltzmann solutions, that seems to affect the fine details of the EDL.
In order to understand further such differences, we report the density and velocity profiles of the solution, as investigated by the theoretical and LB treatments. The density profiles of the counter- and co-ions are reported in Fig.5. At low pH, the profiles show a strong impact of the polymeric charge on the typical EDL structure, with smooth profiles in the polymer-rich regions as compared to the typical exponential shape of the EDL. At higher pH, the polymeric charge has no major impact, and the profiles have a more conventional EDL shape.
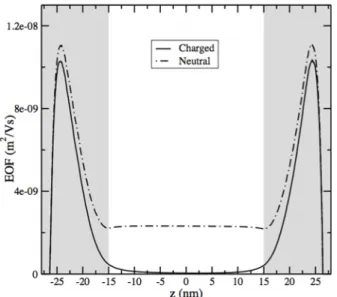
FIG. 7. Same as Fig.6at pH 7.5 comparing the EOF profiles as obtained via LB simulations for the charged polymer case, with charge density 1.2 × 10⁻³nm−3, and for the neutral polymer case.
Overall, it is important to remark the excellent match between the theoretical and LB density profiles.
In Fig. 6, we analyze the velocity profiles. The veloc-ity features an efficient suppression in the polymeric region, due to the strong frictional forces that suppress the velocity away from the polymeric region. In the right panel of Fig.6, the charge separation is limited to the polymeric region and the associated EDL does not contribute significantly to the charge current. In addition, the effect of non-linearity of in the Poisson-Boltzmann solution is to suppress even more the velocity in the polymer-free region in the case of high pH.
Finally, we consider the effect of the polymer charge on the velocity profile, as reported in Fig.7, and at pH 7.5. The profiles show that the polymeric charges have a major role in reducing the EDL in this region and therefore to suppress the EOF mobility away from it. Such a role is comparable to the frictional forces that, as shown in advance, have a similar modulation of the curves.
V. CONCLUSIONS
We have found that, in order to account for the dissoci-ation equilibrium of silanoles and the protondissoci-ation state of the polymer near the capillary wall, the EOF curve as a function of pH can be used as a mean to determine the effective polymeric charge. As a result, the non-trivial patterns of the EOF curve are reproduced by the theoretical curves in a wide pH range. Once the polymeric charge has been determined, as much as consid-ering other coating characteristics such as the coating density and thickness, the methodology can be used as a predictive tool in most general operating conditions.
Our work is particularly useful because it asserts that the simple one-dimensional description of the system, under the assumption of a linear Poisson-Boltzmann solution for the EDL and by assimilating the coating region to a porous medium, is accurate enough for quantitative analysis. More complex treatments of the coating and the more demanding
184907-8 Monteferrante et al. J. Chem. Phys. 143, 184907 (2015)
usage of simulation methodology, such as the one encoded by the Lattice Boltzmann technique, are needed in more complex scenarios, where the local electric field is intense and the polymeric structure requires the determination of locally the three-dimensional flow structure.
ACKNOWLEDGMENTS
This work was partially supported by the Italian Ministry of University and Research through FIRB “Futuro in Ricerca” Project No. RBFR12OO1G — NEMATIC.
1M. Geiger, A. L. Hogerton, and M. T. Bowser,Anal. Chem.84, 577 (2011). 2V. Kostal, J. Katzenmeyer, and E. A. Arriaga,Anal. Chem.80, 4533 (2008). 3J. Berthier and P. Silberzan, Microfluidics for Biotechnology (Artech House,
2010).
4K. Kontturi, L. Murtomäki, and J. A. Manzanares, Ionic Transport Pro-cesses: In Electrochemistry and Membrane Science(Oxford University Press, Oxford, 2008).
5S. Ghosal,Electrophoresis25, 214 (2004).
6W. Wang, F. Zhou, L. Zhao, J.-R. Zhang, and J.-J. Zhu,J. Chromatogr. A 1170, 1 (2007).
7B. Kirby, Micro and Nanoscale Fluid Mechanics: Transport in Microfluidic Devices(Cambridge University Press, 2010).
8C. W. Huck and G. K. Bonn, Capillary Electrophoresis (Springer, 2008), pp. 507–540.
9J. Harden, D. Long, and A. Ajdari,Langmuir17, 705 (2001).
10O. A. Hickey, C. Holm, J. L. Harden, and G. W. Slater,Macromolecules44, 9455 (2011).
11O. A. Hickey, J. L. Harden, and G. W. Slater,Microfluid. Nanofluid.13, 91 (2012).
12E. A. Doherty, K. D. Berglund, B. A. Buchholz, I. V. Kourkine, T. M. Przybycien, R. D. Tilton, and A. E. Barron,Electrophoresis23, 2766 (2002).
13J. S. Green and J. W. Jorgenson,J. Chromatogr. A478, 63 (1989). 14M. M. Bushey and J. W. Jorgenson,J. Chromatogr. A480, 301 (1989). 15T. Manabe,Electrophoresis20, 3116 (1999).
16M. Cretich, M. Stastna, A. Chrambach, and M. Chiari,Electrophoresis23, 2274 (2002).
17J. Horvath and V. Dolník,Electrophoresis22, 644 (2001).
18M. Cretich, M. Chiari, G. Pirri, and A. Crippa,Electrophoresis26, 1913 (2005).
19C. A. Lucy, A. M. MacDonald, and M. D. Gulcev,J. Chromatogr. A1184, 81 (2008).
20C. Dongre, J. Van Weerd, G. A. Besselink, R. van Weeghel, R. M. Vazquez, R. Osellame, G. Cerullo, M. Cretich, M. Chiari, H. J. Hoekstra et al., Elec-trophoresis31, 2584 (2010).
21L. Sola and M. Chiari,J. Chromatogr. A1270, 324 (2012).
22C. Quang, A. Malek, and M. G. Khaledi,Electrophoresis24, 824 (2003). 23A. Mendes, L. C. Branco, C. Morais, and A. L. Simplício,Electrophoresis
33, 1182 (2012).
24F. Tessier and G. W. Slater,Macromolecules39, 1250 (2006).
25C. Zilio, L. Sola, F. Damin, L. Faggioni, and M. Chiari,Biomed.
Microde-vices16, 107 (2014).
26U. M. B. Marconi, M. Monteferrante, and S. Melchionna,Phys. Chem.
Chem. Phys.16, 25473 (2014).
27M. Swann, N. Freeman, and G. Cross, “Dual polarization interferometry: A real-time optical technique for measuring (bio)molecular orientation, struc-ture and function at the solid/liquid interface,” in Handbook of Biosensors and Biochips(Wiley, 2007), Vol. 1, Chap. 33, pp. 549–568.
28M. Monteferrante, S. Melchionna, U. M. B. Marconi, M. Cretich, M. Chiari, and L. Sola,Microfluid. Nanofluid.18, 475 (2015).
29J. R. Looker, “The electrokinetics of porous colloidal particles,” Ph.D. thesis, Department of Mathematics and Statistics, University of Melbourne, 2006. 30R. Benzi, S. Succi, and M. Vergassola,Phys. Rep.222, 145 (1992). 31S. Succi, The Lattice Boltzmann Equation: For Fluid Dynamics and Beyond
(Oxford University Press, 2001).
32U. M. B. Marconi and S. Melchionna,Langmuir28, 13727 (2012). 33O. A. Hickey, J. L. Harden, and G. W. Slater,Phys. Rev. Lett.102, 108304