FULL PAPER
INTRODUCTION
Nosocomial infections are one of the leading causes of death among hospitalized patients and remain a major problem in all health care centres across the world (Wen-zel, 2007). Many types of microorganisms cause infections in humans. Over the past decades, most pathogenic spe-cies have developed resistance to one or more antimicro-bials becoming a public health problem. Members of the Enterobacteriaceae family are among the most important bacterial human pathogens. Escherichia coli, Klebsiella spp. and Proteus spp. account for the majority of Entero-bacteriaceae isolated from clinical specimens and their antimicrobial resistance is increasing (Eisenstein et al., 2000). Current antimicrobial issues for Enterobacteriaceae include the emergence and proliferation of resistances to many antibiotics classes including broad-spectrum peni-cillins, third-generation cephalosporins, fluoroquinolones, aminoglycosides and carbapenems (Bradford et al., 2001).
©2016 by EDIMES - Edizioni Internazionali Srl. All rights reserved
Surveillance data indicate that the Enterococcus species are one of the most isolated nosocomial pathogens (12.0% of all hospital infections) (Sievert et al., 2013) and its rise in prevalence is influenced by the ability to resist and es-cape the action of the most commonly used antibiotics. Other important bacterial pathogens most frequently responsible for nosocomial infections are Acinetobacter species, Pseudomonas species and Staphylococcus aureus (Livermore et al., 2001, Karageorgopoulos et al., 2008, Mera et al., 2011). Acinetobacter causes various nosocomi-al infections with high mortnosocomi-ality, and the infection caused by multidrug-resistant A. baumannii is currently one of the most difficult to treat (Maragakis, 2008). We also need to consider Pseudomonas spp. resistance patterns because of the strong evidence that inappropriate empiric therapy leads to increased hospital mortality (Iregui et al., 2002), and patients with a resistant infection are less likely to re-ceive appropriate initial treatment (Micek et al., 2005). S. aureus strains, in particular methicillin-resistant (MRSA) strains associated with hospitals, are one of the most common causes of hospital-acquired infections and their prevalence has increased over the last 10 years. (Durai et al., 2010). MRSA drug resistance continues to evolve. New multiresistant MRSA phenotypes show ri-fampicin and trimethoprim-sulfamethoxazole resistance. To date, more than 50% of MRSA strains are resistant to drugs such as macrolides, lincosamides, fluoroquinolones
Key words:
Healthcare-associated infections, Nosocomial infections, Antibiotic resistance, Multidrug resistance, Prevalence, Susceptibility, Incidence.
Received April 4, 2015 Accepted November 11, 2015
SUMMARY
Nosocomial infections are one of the leading causes of morbidity and mortality in hospitalized pa-tients. Studies of their prevalence in single institutions can reveal trends over time and help to iden-tify risk factors. The aim of this study was to investigate the nosocomial infections trend and ideniden-tify the prevalence of predominant bacterial microorganisms and their drug resistance patterns in an Italian tertiary care hospital. Infections were classified according to the Centres for Disease Control and Prevention definitions. A retrospective study was carried out from March 2011 to June 2014, based on the bacterial isolate reports of a hospital located in Central Italy. During the 40-month study period, a total of 1547 isolates were obtained from 1046 hospitalized patients and tested for their antibiotic sensitivity. The most common isolates belonged to the Enterobacteriaceae family (61.7%), followed by Enterococcus species (12.4%), Pseudomonas species (10.7%) and S. aureus (10.0%). The incidence density rate of nosocomial infections was 7.4 per 1000 patient days, with a significant difference among the 3 annual infection rates (P<0.001). The highest infection prevalence rate was found in Internal Medicine Unit (41.3%), followed by Intensive Care Units (12.4%), Surgical Units (9.0%,) and Cardiology (7.1%).
Retrospective analysis of nosocomial infections
in an Italian tertiary care hospital
Alessio Mancini
1, Daniele Verdini
2, Giorgio La Vigna
3, Claudia Recanatini
4,
Francesca Elena Lombardi
5, Simone Barocci
61Scuola di Specializzazione in Biochimica Clinica, Universita degli Studi ‘G. D’Annunzio’, Chieti, Italy; 2Dipartimento di Economia e Management, Università degli Studi di Trento, Italy;
3School of Biosciences and Veterinary Medicine, University of Camerino, Italy;
4School of Specialization in Hygiene and Preventive Medicine, Università Politecnica delle Marche, Ancona, Italy; 5Facolta di Medicina e Chirurgia, Università Politecnica delle Marche, Ancona, Italy;
6ASUR Marche AV2, O.U. Clinical Pathology, Senigallia (AN), Italy
Corresponding author: Simone Barocci
and aminoglycosides (Archer et al., 1998). Among human pathogens, multidrug-resistant strains (MDR) are a major concern because of their therapeutic complications, ac-quisition of additional resistance and high potential for a large-scale dissemination. (Sievert et al., 2013).
Many therapies are available and mortality has fallen drastically, but the high rate of antibiotic resistance and intrinsic resistance could increase the risk of inappropri-ate empirical therapy. Intrinsic resistance, the inninappropri-ate abil-ity of a bacterial species to resist the activabil-ity of a particular antimicrobial agent due to certain resistance-conferring genes allows the development of tolerance to a particular drug or antimicrobial class.
A deeper understanding of the hospital bacterial popula-tion, relative resistances and incidence rates may help to adopt the best possible antibiotic therapy. The aim of this study was to investigate the nosocomial infections and to identify the prevalence of predominant bacterial micro-organisms and their drug sensitivity and resistance in an Italian tertiary care hospital.
METHODS
A retrospective study was carried out based on the bacte-rial isolates reports of a hospital located in Central Italy with 288 beds and a mean of 31,000 inpatient days per semester. All patients admitted from March 2011 to June 2014 (40 months) were included in the study. Isolates col-lected from infections that occurred 48 hours after admis-sion were identified as nosocomial infections, as defined by the Centres for Disease Control and Prevention (CDC/ NHSN, 2013). A total of 1046 patients and 1286 clinical samples were considered for this study. The clinical speci-mens were urine samples, pulmonary samples, blood sam-ples, surgical samsam-ples, cutaneous swabs, urethral/vaginal swabs, catheter tip and throat swabs. Specimens were pro-cessed according to good laboratory practice and standard methods for identification. Blood cultures were collected using Bactec aerobic and anaerobic blood culture bottles (BD Blood Culture System, Becton, Dickinson and Com-pany) and incubated at 37°C in BD BACTEC™ 9120. Blood samples were obtained from 2 separate sites within min-utes of each other from patients who were acutely ill or those in whom the likelihood of continuous bacteraemia was high. By contrast, in patients suspected to have inter-mittent bacteraemia, multiple blood cultures 6-36 hours apart were obtained. Positive bottles were subcultured on blood, chocolate and MacConkey agar. All antimicrobial
susceptibility tests were performed with VITEK®2
(Bio-Mérieux, Marcy l’Etoile, France). Resistance to glycopep-tides or others drugs were not confirmed by tests different from VITEK2 because confirmation tests are not routinely performed in our laboratory.
The 1547 isolates were grouped and organized in 7 major pathogen classes: Acinetobacter spp., E. coli, Enterococcus spp., Klebsiella spp., Pseudomonas spp., S. aureus, Strep-tococcus spp. and other bacteria belonging to the Entero-bacteriaceae family. The most representative species in this family were Proteus spp., Enterobacter spp. and Citrobacter spp. An isolate was considered resistant to an antimicro-bial agent when tested and interpreted as resistant (R) in accordance with the EUCAST breakpoints criteria adopt-ed by our laboratory. An isolate was consideradopt-ed non-sus-ceptible to an antimicrobial agent when tested and found resistant (R) or with intermediate susceptibility (I) using
the same clinical breakpoints as interpretive criteria. Mul-tidrug resistance was defined as being resistant to 3 or more antimicrobial classes among piperacillin (±tazobac-tam), ceftazidime, fluoroquinolones, aminoglycosides and carbapenems (ECDC, 2012).
Duplicate data were discarded using the Bio-Mérieux
VI-GIguard™ software if all the following conditions were true: isolate collected from the same patient, same spec-imen, same ward, same species and similar antibiotic pattern (S/R=1; I/R–S/I=2) within 20 days. After duplicate
elimination, data were checked with Microsoft® Excel and
verified. Tables for sensitivity patterns, and antimicrobial
susceptibility graphics were built with Microsoft® Excel.
For selected analyses, a 95% confidence interval was de-termined for percentages by applying an exact confidence interval for binomial data. The number of inpatient-days and the sum of each daily inpatient census for each semes-ter were obtained from hospital administrative records.
RESULTS
During the 40-month study period 1286 clinical samples were collected from 1046 patients. The gender distribu-tion was 37.1% male and 62.9% female. The mean age was 74.6±18.1 years. The highest infection prevalence was found in Internal Medicine Unit (41.3%, 95% CI 38.8 to 43.8), followed by Intensive Care Units (12.4%, 95% CI 10.7 to 14.1), Surgical Units (9.0%, 95% CI 7.4 to 10.4) and Cardiology (7.1%, 95% CI 5.8 to 8.5).
Overall, the most common isolates belonged to the terobacteriaceae family (500 E.coli 32.3%, 296 other En-terobacteriaceae 19.1%, 158 Klebsiella spp 10.2%), followed by Enterococcus species (193, 12.4%), Pseudomonas spe-cies (166, 10.7%) and S. aureus (155, 10%). While Acine-tobacter (52, 3.4%) and Streptococcus species (27, 1.8%) were the least isolated microorganisms. The microorgan-isms isolated from the 8 different clinical specimen were 1008 in urine samples (65.5%), 208 in pulmonary samples (12.9%), 95 in blood samples (6.2%), 93 in surgical sam-ples (6.1%), 74 in cutaneous swabs (4.8%), 40 in urethral/ vaginal swabs (2.6%), 26 in catheter tip (1.7%) and 3 in throat swabs (0.2%).
E.coli was the most common isolated bacteria from urine samples (39.4%) and in surgical samples (48.4%). Other common isolations in urine were other Enterobacteriace-ae (22.3%), Enterococcus spp. (15.9%) and Klebsiella spp. (10.0%). Among pulmonary specimens Pseudomonas spp. (31.7%), S. aureus (16.8%) and Acinetobacter spp. (12.5%) had the highest isolation rate. In blood samples 36.8% of all cultures resulted positive to S. aureus followed by E.co-li (15.8%) and Klebsiella spp. (14.7%). S. aureus was also highly prevalent in catheter tip samples and cutaneous swabs with 65.4% and 28.4% respectively of all isolations by sample. Isolates from urethral and vaginal swabs re-ported 45.0% on E.coli, 15.0% on Streptococcus spp. and 10.0% on Streptococcus spp.
The incidence density rate of nosocomial infections was 7.4 per 1000 patient days, with a significant difference among the 3 annual infection rates (P<0.001). Rates have increased from 6.1 in 2011 to over 10 per 1000 pa-tient-days to date. E. coli had the higher incidence with 3.41 infections in 2014. In general, during the 40-month study period all the analyzed microorganisms had a posi-tive rise. The Enterobacteriaceae family (E. coli, Klebsiella spp. and others) rose from 4 to 6.29 infections,
Pseudomo-nas spp. from 0.67 to 0.93, S.aureus from 0.73 to 0.83. The first semester of 2011 reported a lack of Acinetobacter spp infections, while in 2014 this rate reached 0.20 infections. Lastly Enterococcus spp. increased from 0.67 to 1.32 and Streptococcus spp. from 0.06 to 0.20 (Table 1).
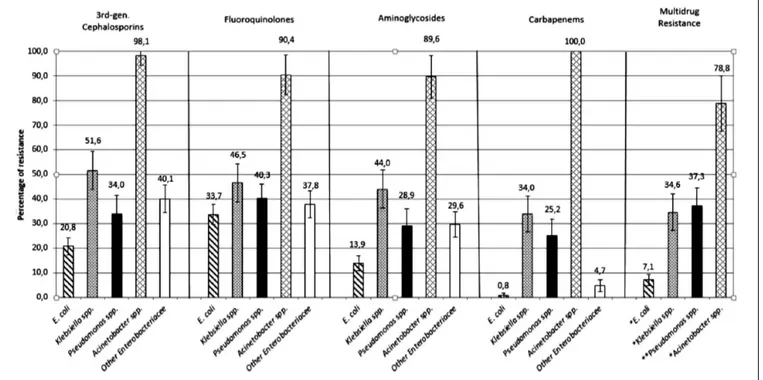
The antibiotic sensitivity patterns are listed in Table 2. Data were expressed as a sensitivity percentage (S), that is the percentage of sensitive isolates out of all isolates with antimicrobial susceptibility testing information on that specific organism-antimicrobial agent combination (T). If these were fewer than 50.0% of all isolates (n), data for that specific organism-antimicrobial agent combina-tion were not displayed. Several microorganisms showed 100% antibiotic resistance. Acinetobacter species were
ful-ly resistant to ertapenem and fosfomycin, Enterococcus species to clindamycin and Pseudomonas species to ampi-cillin, ertapenem and nitrofurantoin.
The most effective drug against Acinetobacter spp was Colistin with 91.4% of sensitivity. Colistin was also very effective to E. coli (98.2%) and Pseudomonas spp. (94.2%). Tigecycline was the drug with the highest efficacy among all tested drugs, results showed 4 bacteria families (En-terococcus spp., E. coli, Klebsiella spp. and S. aureus) up to 90.0% of sensitivity. Ertapenem, imipenem and meropen-em were the most effective to E.coli isolates with percent-ages ranging from 99.6% to 99.8%.
Data on antimicrobial resistance patterns are shown in Figure 1 and expressed as the percentage of non-suscep-Table 1 - Incidence density adjusted for total inpatioent-days every 6 months.
Microorganism 2011 2112 2013 2014 Trend 2011-2014 s1 s2 s1 s2 s1 s2 s1 E.coli 2,73 2,57 1,46 2,51 2,13 2,41 3,41 Enterobac-teriaceae 1,09 1,07 1,11 1,71 1,28 1,31 2,12 Pseudomonas spp. 0,67 0,64 0,77 0,98 0,67 0,95 0,93 Klebsiella spp. 0,18 0,86 0,43 0,95 0,73 1,13 0,76 Enterococcus spp. 0,67 0,89 0,97 0,92 0,91 0,66 1,32 S. aureus 0,73 0,86 0,49 0,73 0,85 0,66 0,83 Acinetobacter spp. 0,00 0,21 0,06 0,22 0,12 0,47 0,56 Streptococcus spp. 0,06 0,06 0,06 0,13 0,21 0,18 0,20 Total 6,12 7,15 5,34 8,16 6,90 7,78 10,13 E. coli Entero- bacteria-ceae Pseudo-monas spp. Kleb-siella spp. Entero-coccus spp. S.
aureus Acineto-bacter spp. Streptococcus spp. s1 2011 2,73 1,09 0,67 0,18 0,67 0,73 0,00 0,06 s2 2011 2,57 1,07 0,64 0,86 0,89 0,86 0,21 0,06 s1 2012 1,46 1,11 0,77 0,43 0,97 0,49 0,06 0,06 s2 2012 2,51 1,71 0,98 0,95 0,92 0,73 0,22 0,13 s1 2013 2,13 1,28 0,67 0,73 0,91 0,85 0,12 0,21 s2 2013 2,41 1,31 0,95 1,13 0,66 0,66 0,47 0,18 s1 2014 3,41 2,12 0,93 0,76 1,32 0,83 0,56 0,20
Table 2 -
Antimicrobial sensitivity by microorganism. *Isolates tested for that antimicrobial agent. **Isolates sensitive for that antimi
crobial agent. Antibiotic Mcroorganism Acinetobacter spp. (n=52) Other Enterobacteriaceae (n=296) Enterococcus spp. (n=193) E. coli (n=500) Klebsiella spp. (n=158) Pseudomonas spp. (n=166) S. aureus (n=155) Streptococcus spp. (n=27) T * (%) S** % (95% CI) T (%) S % (95% CI) T (%) S % (95% CI) T (%) S % (95% CI) T (%) S % (95% CI) T (%) S % (95% CI) T (%) S % (95% CI) T (%) S % (95% CI) AMC 52 1 218 114 _ _ 496 369 158 85 158 4 _ _ _ _ Amox+ac.clavul. 100,0% 1,9 (0-5,7) 73,6% 52,3 (45,7-58,9) 99,2% 74,4 (70,6-78,2) 100,0% 53,8 (46,0-61,6) 95,2% 2,5 (0,1-5,0) AM _ _ _ _ 190 165 343 120 _ _ 100 0 _ _ _ _ Ampicillin 98,4% 86,8 (82,0-91,6) 68,6% 35,0 (29,9-40,0) 60,2% 0,0% AN _ _ 296 279 _ _ 496 471 158 101 159 122 _ _ _ _ Amikacin 100,0% 94,3 (91,6-96,9) 99,2% 95,0 (93,0-96,9) 100,0% 63,9 (56,4-71,4) 95,8% 76,7 (70,2-83,3) CIP 52 5 296 184 _ _ 496 329 159 85 159 92 _ _ _ _ Ciprofloxacin 100,0% 9,6 (1,6-17,6) 100,0% 62,2 (56,6-67,7) 99,2% 66,3 (62,2-70,5) 100,6% 53,5 (45,7-61,2) 95,8% 57,9 (50,2-65,5) CLI _ _ _ _ 193 0 _ _ _ _ _ _ 153 83 25 19 Clindamycin 100,0% 0,0% 98,7% 54,2 (46,4-62,1) 92,6% 76,0 (59,3-92,7) CS 48 44 240 83 _ _ 387 380 138 87 138 130 _ _ _ _ Colistin 92,3% 91,7 (83,8-99,5) 81,1% 34,6 (27,5-39,2) 77,4% 98,2 (96,9-99,5) 87,3% 63,0 (55,0-71,1) 83,1% 94,2 (90,3-98,1) CTX 48 1 271 173 _ _ 479 381 148 73 143 3 _ _ _ _ Cefotaxime 92,3% 2,1 (0-6,1) 91,6% 63,8 (58,1-69,6) 95,8% 79,5 (75,9-83,2) 93,7% 49,3 (41,3-57,4) 86,1% 2,1 (0-4,4) E _ _ _ _ 193 186 _ _ _ _ _ _ 154 87 _ _ Erythromycin 100,0% 96,4 (93,7-99,0) 99,4% 56,5 (48,7-64,3) ETP 51 0 280 272 _ _ 487 485 129 104 143 0 _ _ _ _ Ertapenem 98,1% 0,0% 94,6% 97,1 (95,2-99,1) 97,4% 99,6 (99,0 -100) 81,6% 80,6 (73,8-87,4) 86,1% 0,0% FA _ _ _ _ _ _ _ _ _ _ _ _ 149 135 _ _ Fusidic Acid 96,1% 90,6 (85,9-95,3) FAM _ _ _ _ 189 172 _ _ _ _ _ _ _ _ _ _ Ampicillin-sulb. 97,9% 91,0 (91,9-98,2) FEP 47 1 296 235 _ _ 496 418 158 83 159 122 _ _ _ _ Cefepime 90,4% 2,1 (0-6,3) 100,0% 79,4 (74,8-84,0) 99,2% 84,3 (81,1-87,5) 100,0% 52,5 (44,7-60,3) 95,8% 76,7 (70,2-83,3) FOS 39 0 198 91 _ _ 283 277 108 46 _ _ _ _ _ _ Fosfomycin 75,0% 0,0% 66,9% 46,0 (39,0-52,9) 56,6% 97,9 (96,2-99,6) 68,4% 42,6 (33,3-51,9) FTN _ _ _ _ 180 173 280 274 _ _ 79 0 _ _ 15 15 Nitrofurantoin 93,3% 96,1 (93,3-98,9) 56,0% 97,9 (96,2-99,6) 47,6% 0,0% 55,6% 100,0% GEN _ _ _ _ 189 90 _ _ _ _ _ _ _ _ _ _ Gentamicin HR 97,9% 47,6 (40,5-54,7) GM 48 5 273 172 _ _ 479 421 148 88 147 106 148 103 _ _ Gentamicin 92,3% 10,4 (1,8-19,1) 92,2% 63,0 (57,3-68,7) 95,8% 87,9 (85,0-90,8) 93,7% 59,5 (51,5-67,4) 88,6% 72,1 (64,9-79,4) 95,5% 69,6 (62,2-77,0) IPM 52 4 _ _ 189 172 495 494 158 106 159 120 _ _ _ _ Imipenem 100,0% 7,7 (0,4-14,9) 97,9% 91,0 (86,9-95,1) 99,0% 99,8 (99,4-100) 100,0% 67,1 (59,8-74,4) 95,8% 75,5 (68,8-82,2) LEV _ _ _ _ 192 22 _ _ _ _ _ _ 153 83 24 21 Levofloxacin 99,5% 11,5 (7,0-16,0) 98,7% 54,2 (46,4-62,1) 88,9% 87,5 (74,3-100,7) Antibiotic Mcroorganism Acinetobacter spp. (n=52) Other Enterobacteriaceae (n=296) Enterococcus spp. (n=193) E. coli (n=500) Klebsiella spp. (n=158) Pseudomonas spp. (n=166) S. aureus (n=155) Streptococcus spp. (n=27) T * (%) S** % (95% CI) T (%) S % (95% CI) T (%) S % (95% CI) T (%) S % (95% CI) T (%) S % (95% CI) T (%) S % (95% CI) T (%) S % (95% CI) T (%) S % (95% CI) MEM _ _ 295 286 _ _ 490 489 158 106 158 121 _ _ _ _ Meropenem 99,7% 96,9 (95,0-98,9) 98,0% 99,8 (99,4-100) 100,0% 67,1 (59,8-74,4) 95,2% 76,6 (70,0-83,2) MXF _ _ _ _ 179 14 _ _ _ _ _ _ 134 74 19 18 Moxifloxacin 92,7% 7,8 (3,9-11,8) 86,5% 55,2 (46,8-63,6) 70,4% 94,7 (84,7-100) OXA _ _ _ _ _ _ _ _ _ _ _ _ 149 73 _ _ Oxacillin 96,1% 49,0 (41,0-57,0) OXS _ _ _ _ _ _ _ _ _ _ _ _ 149 73 _ _ Cefoxitin 96,1% 49,0 (41,0-57,0) PEN _ _ _ _ _ _ _ _ _ _ _ _ 148 21 19 17 Penicillin G 95,5% 14,2 (8,6-19,8) 70,4% 89,5 (75,7-100) RC _ _ _ _ 193 193 _ _ _ _ _ _ _ _ _ _ Cefuroxime- Sodium 100,0% 100,0% RIF _ _ _ _ _ _ _ _ _ _ _ _ 69 28 _ _ Rifampicin 44,5% 40,6 (29,0-52,2) SRH _ _ _ _ 188 123 _ _ _ _ _ _ _ _ _ _ Streptomycin HR 97,4% 65,4 (58,6-72,2) SXT 52 17 296 196 106 1 496 325 158 92 160 9 150 133 22 20 Trimeth-sulfa. 100,0% 32,7 (19,9-45,4) 100,0% 66,2 (60,8-71,6) 54,9% 0,9 (0-2,8) 99,2% 65,5 (61,3-69,7) 100,0% 58,2 (50,5-65,9) 96,4% 5,6 (2,1-9,2) 96,8% 88,7 (83,6-93,7) 81,5% 90,9 (78,9-100) TAZ 47 1 296 199 _ _ 496 409 158 79 159 117 _ _ _ _ Ceftazidime 90,4% 2,1 (0-6,3) 100,0% 67,2 (61,9-72,6) 99,2% 82,5 (79,1-85,8) 100,0% 50,0 (42,2-57,8) 95,8% 73,6 (66,7-80,4) TEC _ _ _ _ 193 192 _ _ _ _ _ _ 155 142 16 16 Teicoplanin 100,0% 99,5 (98,5-100) 100,0% 91,6 (87,2-96,0) 59,3% 100,0% TET _ _ _ _ _ _ _ _ _ _ _ _ 154 120 26 9 Tetracycline 99,4% 77,9 (71,4-84,5) 96,3% 34,6 (16,3-52,9) TGC _ _ 200 67 190 190 364 364 92 83 _ _ 153 153 15 15 Tigecycline 67,6% 33,5 (27,0-40,0) 98,4% 100,0% 72,8% 100,0% 58,2% 90,2 (84,1-96,3) 98,7% 100,0% 55,6% 100,0% TOB _ _ _ _ _ _ _ _ _ _ _ _ 127 74 _ _ Tobramycin 81,9% 58,3 (49,7-66,8) TZP _ _ 294 246 _ _ 226 199 91 39 153 86 _ _ _ _ Pip-T azobactam 99,3% 83,7 (79,4-87,9) 45,2% 88,1 (83,8-92,3) 57,6% 42,9 (32,7-53,0) 92,2% 56,2 (48,3-64,1) VA _ _ _ _ 193 188 _ _ _ _ _ _ 155 144 24 24 Vancomycin 100,0% 97,4 (95,2-99,7) 100,0% 92,9 (88,9-96,9) 88,9% 100,0%
tible (I+R) isolates to at least one antimicrobial agent of the antimicrobial class (cephalosporins, fluoroquinolo-nes, aminoglycosides and carbapenems) out of all the strains tested for that precise combination bacterial species-antimicrobial class. The graph shows the high-est resistance of Acinetobacter spp. to all the 4 consid-ered antimicrobial families. Tests reported that 98.1% of
isolates were resistant to 3rd generation cephalosporins,
90.4% to fluoroquinolones, 86.6% to aminoglycosides and all the species were resistant to the carbapenems family. Acinetobacter spp. overcame the multidrug resis-tant section with 78.8% of resistance to
fluoroquinolo-nes, third-generation cephalosporins and aminoglyco-sides combined together. Klebsiella spp. was the second most resistant bacteria to antimicrobials: 51.6% of all
isolates were resistant to 3rd generation cephalosporins,
46.5% to fluoroquinolones, 44.0% to aminoglycosides and 34.0% to carbapenems.
Less than half of the Klebsiella spp. isolates were multire-sistant compared to Acinetobacter spp. Pseudomonas spp., and the other Enterobacteriaceae were the third and the fourth most resistant bacteria with percentages of resis-tance slightly lower than Klebsiella. The other Enterobac-teriaceae along with E.coli alone had the lower resistance
Figure 1 - Antimicrobial resistance by microorganism.
rates to carbapenems with 4.7% and 0.8%. E. coli resis-tance rates were the lowest among all the isolates.
In depth analysis of antimicrobial susceptibility patterns of S. aureus and Enterococcus spp. are shown in Figure 2: 49.4% of all S. aureus isolations were methicillin resistant. Among these, 40.3% were resistant to fluoroquinolones and 23.4% to rifampicin. The non-MRSA isolates had a lower resistance to both fluoroquinolones (6.5%) and ri-fampicin (3.2%). No isolates were resistant to linezolid. Regarding Enterococcus spp., 62.1% were resistant to the aminoglycosides and only 3.6% to vancomycin.
DISCUSSION
Several surveillance studies on antimicrobial resistance have been performed in recent years. Many of them have exclusively examined nosocomial isolates, others have focused on community isolates while others have consid-ered combined or single clinical sources of isolation. The resistance profiles that emerged in the present study were, in most of cases, consistent with the Italian data described in the 2012 European Centre for Disease Prevention and Control antimicrobial resistance surveillance report (ECDC, 2012). A comparison with EARS-Net data may not be appropriate, since the report is exclusively based on in-vasive isolates collected from blood or cerebrospinal fluid, therefore matching results could not be representative for isolates of the same bacterial species from different speci-mens. Comparing findings of the present study with those described in the EARS-Net report, some discrepancies emerged: a lower resistance level to cephalosporins, fluo-roquilonones and aminoglycosides and a higher multidrug resistance in E. coli isolates, than those reported by EARS-Net data. Moreover, S. aureus isolates were more resistant to rifampicin and methicillin, while Pseudomonas spp. isolates had a higher resistance to fluoroquinolones and a higher rate of multiresistance. Cavallo et al. ’s analysis carried out in 2001 reported similar rates of fluoroquino-lone-resistant Pseudomonas spp (Cavallo et al., 2001). A study performed in an Indian Intensive Care Unit (Rath et al., 2014) showed higher resistance rates among E. coli
isolates: 75.5% were resistant to 3rd generation
cephalo-sporins, 71.0% to fluoroquinolones and aminoglycosides, and 72.2% to carbapenems. Lower resistance rates in Klebsiella spp. for cephalosporins (17.2%), fluoroquino-lones (12.8%), aminoglycosides (9.2%) and carbapenems (4.3%) had been shown in a study performed in United States (Sanchez et al., 2013). In contrast with our data, a study carried out in Spain showed a peak in 2006 of rifam-picin-resistant MRSA (45.0%), more than twice our rates, with fewer MRSA isolates (30.5%) (Mick et al., 2010). A much higher resistance to macrolides, lincosamides, flu-oroquinolones, and aminoglycosides, more than 50%, had been reported in a study in 2005 by Owens et al. (Owens et al., 2005). A multicenter epidemiological study showed that 28.0% of enterococci isolated from 25 North American In-tensive Care Units were resistant to vancomycin (Zirakza-deh et al., 2006). An Italian multicentre study reported 9.0% of E. faecium isolates resistant to vancomycin (Fontana et al., 1998); our vancomicyn-resistant enterococcus rate falls well below this result. Similar rates of resistance in Acine-tobacter spp. were reported from a hospital-based study in
China except for 3rd generation cephalosporins (91.0%) and
carbapenems (85.0%) (Takagi et al., 2009).
Some bacteria reported complete resistance to certain
an-tibiotic families. The ability to resist a particular antimi-crobial agent is widely discussed in previous publications and our data are in agreement with them. Ertapenem has limited in vitro activity against Pseudomonas spp. and Acinetobacter spp. (Livermore et al., 2002). Other studies show a very high resistance among Pseudomonas spp. to ampicillin, nitrofurantoin, amoxicillin and trimetho-prim/sulphamethoxazole (Khan et al., 2008, Loureiro et al., 2002). Trimethoprim/sulphamethoxazole resistance is also common in Enterococcus spp. (Gordon et al., 2003, Hoban et al., 2001), which shows high rates of resistance to clindamycin (Duh et al., 2001). Finally, fosfomycin alone showed no significant antibacterial effects on Acine-tobacter baumannii (Zhang et al., 2013).
The most commonly observed nosocomial infections were similar to observations of a United States study, with a rate of 31.0% for UTIs, followed by 27.0% for pneumonia (Richards et al., 2000), although our UTI rate was almost double. The urinary tract was the most common site of nosocomial infection also in a hospital-based survey car-ried out in the UK, in the Republic of Ireland (Emmerson et al., 1996) and in a multicentre prevalence survey of nos-ocomial infections in Greek hospitals (Gikas et al., 2002). A decreasing prevalence of UTIs over the years has al-ready been noted, but our data include a high proportion of patients well over 60 years. Studies on elderly patients reported a higher prevalence of UTIs (Reilly et al., 2008, Pellizzer et al., 2008) than others with a relatively young group of patients.
A multicentre study of the ECDC classifies surgical infec-tions as the second to fourth most common nosocomial infection in agreement with our results (Zarb et al., 2012). In other surveys, surgical infections were the most fre-quent (Ilic´ et al., 2009, Fitzpatrick et al., 2008), but our centre is not a surgery-focused hospital.
The isolated microorganisms patterns are similar to those of other industrialized nations studies, where E. coli, Pseu-domonas spp, Enterococcus spp, and Staphylococcus spp, were predominant (Gikas et al., 2002, Pellizer et al., 2008). Another survey reported that the most common isolated bacteria were Enterobacter spp., followed by E. coli, Pseu-domonas spp. and Staphylococcus spp (Assar et al., 2012). By contrast, other studies reported Acinetobacter spp. and S. aureus as the most frequent pathogens, but these results are related to the high rates of respiratory tract and sur-gical infections, respectively (Pradhan et al., 2014, Scher-baum et al., 2014). In our study, UTIs represented the most frequent infection and this may be the cause of the high Enterobacteriacee isolation rate (Linhares et al., 2013). The incidence density rate of nosocomial infections is increasing. The estimated incidence rate in the United States was 9.3 infections per 1000 patient-days and a re-cent European multire-centre study showed an average of 17 episodes per 1000 patient-days (WHO, 2014). Compared to our average rate, these results are higher but infec-tion rates have increased to date. A study performed in an acute Rehabilitation Unit showed a rate of infection of 6 episodes per 1000 patient-days (Mylotte et al., 2000) and in a Pediatric Intensive Care Unit, Simon et al. (2000) reported a rate of 14.5 infections per 1000 inpatient-days (Simon et al., 2000). These differences are due to varia-tions in definivaria-tions of infection, the characteristics of the patients studied, or different wards considered.
There are several limitations to this study. The 40 month study period is relatively short. Matching results with the
current literature was quite difficult due to the differences in infection control measures among hospitals, different wards and different specimens evaluated. Our results may not be generalizable to hospitals in other geographic ar-eas. In addition, there are very few multi-ward retrospec-tive record-based infection studies in Italy.
We included patients from the Internal Medicine ward and Intensive Care Units with severe medical disabilities, con-ditions that might interfere with the ability to collect urine properly. Therefore, the prevalence of UTIs has probably been overestimated. The relatively old age of the sample (mean age =74.6 years) may also play a part.
We excluded Streptococcus species, due to their not rep-resentative isolation rate. Although we considered only infections that occurred 48h after hospital admission, it is possible that patients were misclassified as hospital-ac-quired, given the lack of available documentation in the administrative and clinical records. Data like risk factors, diseases at admission, use of peptic ulcer drugs, anti-biotic empirical treatments and data on clinical outcomes were not available. Patients who showed infections soon after discharge and carriers of nosocomial infections were not included in this study.
To avoid an even more marked rise in resistance, an ac-tive surveillance program combined with proper hand hy-giene, environmental cleaning, contact precautions, and antimicrobial stewardship should be improved.
References
Archer G.L. (1998). Staphylococcus aureus: a well-armed pathogen. Clini-cal Infectious Diseases : An Official Publication of the Infectious Diseas-es Society of America, 26, 1179-1181.
Assar S., Akhoundzadeh R., Aleali A.M., Latifi S.M., Salemzadeh M. (2012). Survey of nosocomial infections and causative bacteria: A hospi-tal-based study. Pak J Med Sci. 28, 455-458.
Bradford P.A. (2001). Extended-spectrum b-lactamases in the 21st century: Characterization, epidemiology, and detection of this important resis-tance threat. Clinical Microbiology Reviews.
Cavallo J.D., Leblanc F., Fabre R., Fourticq-Esqueöute A. (2001). Survey of the antibiotic sensitivity of Pseudomonas aeruginosa in France and the distribution of beta-lactam resistance mechanisms: the GERPB 1999 study. Pathologie-Biologie. 49, 534-539.
CDC/NHSN Surveillance. (2013). Definition of Healthcare-Associated In-fection and Criteria for Specific Types of InIn-fections in the Acute Care Setting;. Available from: http://www.cdc.gov/nhsn/pdfs/pscmanual/17p-scnosinfdef_current.pdf.
Duh R.W., Singh K.V, Malathum K., Murray B.E. (2001). In vitro activity of 19 antimicrobial agents against enterococci from healthy subjects and hospitalized patients and use of an ace gene probe from Enterococcus faecalis for species identification. Microbial Drug Resistance (Larch-mont, N.Y.). 7, 39-46.
Durai R., Ng P.C.H., Hoque H. (2010). Methicillin-resistant Staphylococcus aureus: an update. AORN Journal. 91, 599-606; quiz 607-609. ECDC. European Centre for Disease Prevention and Control. (2012).
An-timicrobial resistance surveillance in Europe 2012. Available from: http://ecdc.europa.eu/en/publications/Publications/antimicrobial-resis-tance-surveillance-europe-2012.pdf
Eisenstein B.I., Zaleznik D.F. (2000). Enterobacteriaceae. G. L. Mandell, J. E. Bennett, and R. Dolin (ed.). Principles and practice of infectious diseases, 5th ed. Churchill Livingstone, Philadelphia, Pa. 2294-2310. Emmerson A.M., Enstone J.E., Griffin M., Kelsey M.C., Smyth, E.T. (1996).
The Second National Prevalence Survey of infection in hospitals-over-view of the results. J Hosp Infect. 32, 175-190.
Fontana R., Ligozzi M., Mazzariol A., Veneri G., Cornaglia G. (1998). Resis-tance of enterococci to ampicillin and glycopeptide antibiotics in Italy. The Italian Surveillance Group for Antimicrobial Resistance. Clin Infect Dis. (Suppl, 1) S84-6. PubMed PMID: 9710675.
Fitzpatrick F., McIlvenny G., Oza A., Newcombe R.G., Humphreys H., Cun-ney R., Smyth E.T.M. (2008). Hospital Infection Society Prevalence Survey of Healthcare Associated Infection 2006: comparison of results between Northern Ireland and the Republic of Ireland. Journal of Hos-pital Infection. 69, 265-273.
Gikas A., Pediaditis J., Papadakis J.A., Starakis J., Levidiotou S., Nikolaides P., Apidianaki, N. (2002). Prevalence study of hospital-acquired
infec-tions in 14 Greek hospitals: Planning from the local to the national surveillance level. Journal of Hospital Infection. 50, 269-275.
Gordon K.A., Jones R.N. (2003). Susceptibility patterns of orally admin-is-tered antimicrobials among urinary tract infection pathogens from hos- pitalized patients in North America: comparison report to Europe and Latin America. Results from the SENTRY Antimicrobial Surveil-lance Program (2000). Diagn Microbiol Infect Dis. 45, 295-301. Hoban D., Bouchillon S., Johnson J., Zhanel G., Butler D., Miller L.,
Poupard J. (2001). Comparative in vitro potency of gemifloxacin and fluoroquinolones against recent European clinical isolates from a global surveillance study. European Journal of Clinical Microbiology and Infectious Diseases. 20, 814-819.
Ilic ´ M., Markovic ´-Denic ´ L. (2009). Nosocomial infections prevalence study in a Serbian university hospital. Vojnosanitetski Pregled. 66, 868-875. Iregui M., Ward S., Sherman G., Fraser V.J., Kollef M.H. (2002). Clinical
importance of delays in the initiation of appropriate antibiotic treat-ment for ventilator-associated pneumonia. Chest. 122, 262-268. Karageorgopoulos D.E., Falagas M.E. (2008). Current control and
treat-ment of multidrug-resistant Acinetobacter baumannii infections. The Lancet Infectious Diseases.
Khan J.A., Iqbal Z., Ur Rahman S., Farzana K., Khan A. (2008). Prevalence and resistance pattern of Pseudomonas aeruginosa against various antibiotics. Pakistan Journal of Pharmaceutical Sciences. 21, 311-315. Linhares I., Raposo T., Rodrigues A., Almeida A. (2013). Frequency and
antimicrobial resistance patterns of bacteria implicated in communi-ty urinary tract infections: a ten-year surveillance study (2000-2009). BMC Infectious Diseases. 13, 19.
Livermore D.M., Carter M.W., Bagel S., Wiedemann, B., Baquero, F., Loza, E., … Shungu, D. L. (2001). In vitro activities of ertapenem (MK-0826) against recent clinical bacteria collected in Europe and Australia. An-timicrobial Agents and Chemotherapy. 45, 1860-1867.
Livermore D.M. (2002). Multiple mechanisms of antimicrobial resistance in Pseudomonas aeruginosa: our worst nightmare? CID: Clinical Infec-tious Dissease. 34, 634-640.
Loureiro M.M., De Moraes B.A., Mendonça V.L.F., Quadra M.R.R., Pin-heiro G.S., Asensi M.D. (2002). Pseudomonas aeruginosa: Study of an-tibiotic resistance and molecular typing in hospital infection cases in a neonatal intensive care unit from Rio de Janeiro City, Brazil. Memorias Do Instituto Oswaldo Cruz. 97, 387-394.
Maragakis L.L., Perl T.M. (2008). Acinetobacter baumannii: epidemiolo-gy, antimicrobial resistance, and treatment options. Clinical Infectious Diseases : An Official Publication of the Infectious Diseases Society of America. 46, 1254-1263.
Mera R.M., Suaya J.A., Amrine-Madsen H., Hogea C.S., Miller L.A., Lu E.P., Acosta C.J. (2011). Increasing role of Staphylococcus aureus and community-acquired methicillin-resistant Staphylococcus aureus infections in the United States: a 10-year trend of replacement and expansion. Microbial Drug Resistance (Larchmont, N.Y.). 17, 321-328. Micek S.T., Lloyd A.E., Ritchie D.J., Reichley R.M., Fraser V.J., Kollef M.H.
(2005). Pseudomonas aeruginosa bloodstream infection: Importance of appropriate initial antimicrobial treatment. Antimicrobial Agents and Chemotherapy. 49, 1306-1311.
Mick V., Domínguez M.A., Tubau F., Liñares J., Pujol M., Martín, R. (2010). Molecular characterization of resistance to Rifampicin in an emerging hospital-associated Methicillin-resistant Staphylococcus aureus clone ST228, Spain. BMC Microbiology. 10, 68.
Mylotte J.M., Graham R., Kahler L., Young,L., Goodnough S. (2000). Epi-demiology of nosocomial infection and resistant organisms in patients admitted for the first time to an acute rehabilitation unit. Clinical In-fectious Diseases : An Official Publication of the InIn-fectious Diseases So-ciety of America. 30, 425-432.
Owens R.C., Ambrose, P. G. (2005). Antimicrobial safety: focus on fluoro-quinolones. Clinical Infectious Diseases : An Official Publication of the Infectious Diseases Society of America. 41 (Suppl. 2), S144-S157. Pellizzer G., Mantoan P., Timillero L., Allegranzi B., Fedeli U., Schievano
E., Spolaore P. (2008). Prevalence and risk factors for nosocomial in-fections in hospitals of the Veneto Region, north-eastern Italy. Infec-tion. 36, 112-119.
Pradhan N.P., Bhat S.M., Ghadage D.P. (2014). Nosocomial Infections in the Medical ICU: A Retrospective Study Highlighting their Prevalence, Microbiological Profile and Impact on ICU Stay and Mortality. JAPI. vol. 62.
Rath S., Dubey D., Sahu M.C., Debata N.K., Padhy R.N. (2014). Surveillance of ESBL producing multidrug resistant Escherichia coli in a teaching hospital in India. Asian Pacific Journal of Tropical Disease. 4, 140-149. Reilly J., Stewart S., Allardice G.A., Noone A., Robertson C., Walker A.,
Coubrough S. (2008). Results from the Scottish National HAI Preva-lence Survey. Journal of Hospital Infection. 69, 62-68.
Richards M.J., Edwards J.R., Culver D.H., Gaynes, R.P. (2000). Nosoco-mial infections in combined medical-surgical intensive care units in the United States. Infection Control and Hospital Epidemiology : The Official Journal of the Society of Hospital Epidemiologists of America.
21, 510-515.
Sanchez G.V., Master R.N., Clark R.B., Fyyaz M., Duvvuri P., Ekta G., Bor-don J. (2013). Klebsiella pneumoniae antimicrobial drug resistance,
United States, 1998-2010. Emerging Infectious Diseases. 19, 133-136. Scherbaum M., Kösters K., Mürbeth R.E., Ngoa U.A., Kremsner P.G., Lell
B., Alabi A. (2014). Incidence, pathogens and resistance patterns of nosocomial infections at a rural hospital in Gabon. BMC Infectious Diseases. 14, 124.
Sievert D.M., Ricks P., Edwards J.R., Schneider A., Patel J., Srinivasan A., Frid-kin, S. (2013). Antimicrobial-resistant pathogens associated with health-care-associated infections: summary of data reported to the National Healthcare Safety Network at the Centers for Disease Control and Preven-tion, 2009-2010. Infection Control and Hospital Epidemiology : The Official Journal of the Society of Hospital Epidemiologists of America. 34, 1-14. Simon A., Bindl L., Kramer M.H. (2000). Surveillance of nosocomial
infec-tions: prospective study in a pediatric intensive care unit. Background, patients and methods. Klin Padiatr. 212, 2-9.
Takagi E.H., Lincopan N., Cassettari V.C., Passadore L.F., Mamizuka E.M.,
Martinez M.B. (2009). Carbapenem-resistant Acinetobacter bauman-nii outbreak at university hospital. Brazilian Journal of Microbiology. WHO. World Health Organization. (2014). Health care-associated
infec-tions FACT SHEET. Available from: http://www.who.int/gpsc/country_ work/gpsc_ccisc_fact_sheet_en.pdf.
Zarb P., Coignard B., Griskeviciene J., Muller A., Vankerckhoven V., Weist K., Suetens C. (2012). The european centre for disease prevention and control (ECDC) pilot point prevalence survey of healthcare-associated infections and antimicrobial use. Eurosurveillance. 17, 1-16. Zhang Y., Chen F., Sun E., Ma R., Qu C., Ma L. (2013). In vitro antibacterial
activity of combinations of fosfomycin, minocycline and polymyxin B on pan-drug-resistant Acinetobacter baumannii. Experimental and Therapeutic Medicine. 5, 1737-1739.
Zirakzadeh A., Patel R. (2006). Vancomycin-resistant enterococci: coloni-zation, infection, detection, and treat