Molecules 2019, 24, 1226; doi:10.3390/molecules24071226 www.mdpi.com/journal/molecules Article
Liquid Phase and Microwave-Assisted Extractions for
Multicomponent Phenolic Pattern Determination of
Five Romanian Galium Species Coupled with
Bioassays
Andrei Mocan 1, Alina Diuzheva 2, Sabin Bădărău 3, Cadmiel Moldovan 1, Vasil Andruch 2,
Simone Carradori 4, Cristina Campestre 4, Angela Tartaglia 4, Marta De Simone 4, Dan Vodnar 5,
Matteo Tiecco 6, Raimondo Germani 6, Gianina Crișan 1 and Marcello Locatelli 4,*
1 Department of Pharmaceutical Botany, “Iuliu Haţieganu” University of Medicine and Pharmacy,
400012 Cluj-Napoca, Romania; [email protected] (A.M.); [email protected] (C.M.); [email protected] (G.C.)
2 Department of Analytical Chemistry, Pavol Jozef Šafárik University, SK-04180 Košice, Slovakia;
[email protected] (A.D.); [email protected] (V.A.)
3 Department of Environmental Sciences, Babeș-Bolyai University, 400084 Cluj-Napoca, Romania;
4 Department of Pharmacy, University “G. D’Annunzio” of Chieti-Pescara, 66100 Chieti, Italy;
[email protected] (S.C.); [email protected] (C.C.); [email protected] (A.T.); [email protected] (M.D.S.)
5 Department of Food Science, University of Agricultural Sciences and Veterinary Medicine,
400372 Cluj-Napoca, Romania; [email protected]
6 Department of Chemistry, Biology and Biotechnology, University of Perugia, 06132 Perugia, Italy;
[email protected] (M.T.); [email protected] (R.G.)
* Correspondence: [email protected]; Tel.: +39-0871-3554590; Fax: +39-0871-3554911
Received: 28 February 2019; Accepted: 26 March 2019; Published: 28 March 2019
Abstract: Background: Galium is a plant rich in iridoid glycosides, flavonoids, anthraquinones, and small amounts of essential oils and vitamin C. Recent works showed the antibacterial, antifungal, antiparasitic, and antioxidant activity of this plant genus. Methods: For the determination of the multicomponent phenolic pattern, liquid phase microextraction procedures were applied, combined with HPLC-PDA instrument configuration in five Galium species aerial parts (G. verum,
G. album, G. rivale, G. pseudoaristatum, and G. purpureum). Dispersive Liquid–Liquid MicroExtraction
(DLLME) with NaCl and NAtural Deep Eutectic Solvent (NADES) medium and Ultrasound-Assisted (UA)-DLLME with β-cyclodextrin medium were optimized. Results: The optimal DLLME conditions were found to be: 10 mg of the sample, 10% NaCl, 15% NADES or 1% β-cyclodextrin as extraction solvent—400 μL of ethyl acetate as dispersive solvent—300 μL of ethanol, vortex time— 30 s, extraction time—1 min, centrifugation at 12000× g for 5 min. Conclusions: These results were compared with microwave-assisted extraction procedures. G. purpureum and G. verum extracts showed the highest total phenolic and flavonoid content, respectively. The most potent extract in terms of antioxidant capacity was obtained from G. purpureum, whereas the extract obtained from
G. album exhibited the strongest inhibitory effect against tyrosinase.
Keywords: dispersive liquid-liquid microextraction; microwave-assisted extraction; natural deep eutectic solvent; β-cyclodextrin; Galium species; tyrosinase inhibition
1. Introduction
The use of plants for the treatment of human diseases is a centuries-old tradition, based on phytotherapy research as well as on ethnopharmacological knowledge. Recently, the use of herbal medicines applied for the prevention and/or preservation of health covers a central role in modern medicine related to the fact that these plant-derived materials avoid the classical side effects of synthetic drugs. Additionally, there are benefits of their long-term historic use—safety, accessibility, and efficacy with a wide range of therapeutic actions [1]. Galium is a well-known genus with many medicinal representatives that are rich sources of iridoid glycosides [2–4], flavonoids [5], anthraquinones [6], and small amounts of essential oils and vitamin C [7]. Recent studies showed the antibacterial, antifungal, antiparasitic, and antioxidant activities of representatives of this plant genus [7,8].
G. verum L., also known as Lady’s Bedstraw, is an herbaceous perennial plant, native to Europe
and Asia, and used commonly in many countries’ folk medicine for a large variety of treatments. The dried plants’ aerial parts were used to stuff mattresses, and the flowers were also used to coagulate milk for cheese production [9]. The cut and dried aerial parts of the plant, ‘Herba gallii verii’, are used for homeopathic purposes. These are still used for exogenous treatment of psoriasis or as a tea with diuretic effect for the cure of pyelitis or cystitis [10]. Moreover, G. verum L. has been used as a diuretic for bladder and kidney irritation, externally for poorly healing wounds, as well as for epilepsy and hysteria in Montenegro’s traditional medicine [11]. Regarding Turkish folk medicine, it has been used for its diuretic, choleretic, antidiarrheal, and sedative effects [4]. In Romania, the plant is used in traditional medicine mainly for its diuretic, depurative, laxative, sedative, and antirheumatic effects. Additionally, in the Romanian traditional medicine, several Galium species are used as components of different cosmetic formulations [12]. G. album Mill., the “white bedstraw” or “hedge bedstraw”, is an herbaceous annual plant, cited in traditional Albanian pharmacopoeias and folk medicine for healing wounds and gingival inflammations [13]. G. rivale, G. pseudoaristatum, and G. purpureum (syn.
Asperula purpurea) are less-known species, and to the extent of our knowledge, they have not been
investigated yet in terms of chemical composition and antioxidant capacity, nor in terms of enzyme inhibitory potential.
Generally, the use of different extraction procedures on plant-derived material yields different biological activities. In this field, the availability of an efficient, fast, exhaustive, and reproducible extraction procedure allows obtaining a standardized starting material for food additives, nutraceuticals, and phytoformulations. For the extraction of bioactive compounds from Galium maceration in methanol [7] or ethanol [14], percolation in methanol [8], and ultrasound-assisted extraction [12] were applied, wherein the extraction time was varied from 30 min to one week. In order to reduce the extraction time and retain or increase the extraction efficiency, new extraction methods are required.
Liquid phase microextraction techniques are positioned as ‘green’ chemistry methodologies, which require small amounts of organic solvents. In order to make the procedures more environmentally-friendly, ionic liquids (ILs) or natural deep eutectic solvents (NADESs) are frequently used. Comparing ILs with NADESs, more advantages are on the side of NADESs due to their natural original (the main components can be sugars and organic acids), which may vary depending on analysis purpose, making them nontoxic, biodegradable, and incombustible. In comparison with NADESs, most ILs are toxic, have low biodegradability, and have high cost. Either IL or NADES can have high viscosity, so their extracts are limited for direct analysis using HPLC or GC systems [15–18].
Regarding biological activities, in the current work, a key enzyme was considered in order to further evaluate the extracts. Particularly, pigmentation is one of the most obvious phenotypical characteristics in the natural world. Between the pigments, melanin is one of the most widely distributed and is found in bacteria, fungi, plants, and animals. Melanins are heterogeneous polyphenol-like biopolymers with complex structure and color varying from yellow to black. The synthesis of melanin plays an important role in skin color and pigmentation. Tyrosinase, a
copper-containing mono-oxygenase, is a key enzyme in melanin biosynthesis [19]. Skin disorders, such as melasma (facial pigmentation), scarce, and freckles, are related to excessive melanin biosynthesis. Thus, tyrosinase inhibitors are used to control or treat pigmentation disorders and are widely used in the cosmetic industry. In fact, some tyrosinase inhibitors, such as kojic acid and hydroquinones, are nowadays commercially produced, but they can present severe side effects, such as skin inflammation [20]. Hence, in recent years, more attention has been paid to the use of natural plant extracts as a safe and alternative source of tyrosinase inhibitors for cosmetic purposes.
In the present study, following our research on innovative microextraction procedures [21–27], different microextraction procedures were examined for the analysis of phenolic compounds in G.
verum aerial parts, and then applied for the determination of the phenolic pattern of four other Galium
species (G. album, G. rivale, G. pseudoaristatum, and G. purpureum). As an alternative, the microwave-assisted extraction (MAE) technique was used as a reference method [27–29]. To the best of our knowledge, it is the first time that microextraction techniques have been applied for the recovery and the establishment of phenolic compounds in Galium species.
2. Results and Discussion
2.1. Preliminary Examinations
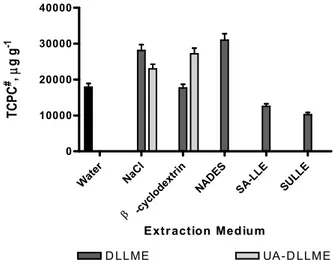
Several liquid phase extraction techniques, such as DLLME, UA-DLLME in water, 10% NaCl, NADES, and 1% β-CD media, SA-LLE, and SULLE, were performed in order to select the procedure providing the better quali-quantitative multicomponent profile of phenolic compounds. The extractions were carried out as described in the experimental section. Figure 1 shows that the best results were achieved in the case of DLLME in 10% NaCl and 10% NADES media and UA-DLLME in 1% β-CD. In UA-DLLME, the phase separation was observed only with β-CD, whereas no phase separation was observed using the other additives. The notable increasing of extraction recovery using UA-DLLME with β-CD could be explained because β-CD was able to better dissolve the metabolites in the extraction solvent, contributing to an increased inclusion in its cavity of a higher amount of phenolic compounds. Therefore, DLLME in NaCl and NADES, UA-DLLME in β-CD media were selected for optimization.
Figure 1. Selection of microextraction procedure. # TCPC—Total concentration of phenolic
compounds. Values expressed are means ± S.D. of three measurements. All the values were statistically significant (p < 0.001). Raw data regarding the statistical analyses were reported in Supplementary Materials section S1.
Wat er NaC l -cyc lode xtri n NA DES SA -LLE SU LLE 0 10000 20000 30000 40000 D LLME UA -D LLME
E xtr action Med ium
TC PC # , g g -1
2.2. Optimization of DLLME and UA-DLLME
Several parameters that could influence the extraction efficiency, such as solid:liquid ratio, extraction and dispersive solvent types, and volume, were selected for optimization. For UA-DLLME, ultrasonication time was also optimized.
2.2.1. Optimization of Extraction Medium Concentration
The extraction medium can significantly affect the extraction yields; therefore, a series of experiments were carried out by adding 5–15% NaCl or NADES solution, or 0.5–1.5% β-CD solution into the vessel containing 10 mg of the dry herbal material. For β-CD, the concentration was lower due to their low water solubility. With 10% NaCl, 15% NADES, and 1% β-CD, the best extraction recoveries were achieved (Figure 2a). Thus, these conditions were applied in further experiments. 2.2.2. Optimization of Solid:Liquid Ratio
Three solid:liquid ratios, expressed as mg/mL (5:1.4, 10:1.4, 15:1.4 w:v), were examined for their impact on the extraction efficiency. The experimental results showed that the tendency for NaCl and NADES was similar, and the maximum of the extraction recovery was reached with the ratio 10:1.4. For β-CD, with the ratios 10:1.4 and 15:1.4 (w:v), no significant differences were observed. Therefore, the optimal solid:liquid ratio was established as 10:1.4 (w:v) (Figure 2b). In fact, in the analytical chemistry workflow, if two different systems show similar data, the lower ratio is generally used because it can get the same analytical performances using a lower amount of solvents, raw material, chemicals, etc.
2.2.3. Selection of Extraction Solvent Type and Volume
n-Hexane, ethyl acetate, chloroform, and diethyl ether were tested as potential extractants. The
experiments revealed that a higher amount of phenolic compounds was extracted using ethyl acetate (Figure 2c). This could be explained by the different polarities of the extraction solvents and by the interaction with polar phenolic compounds. For instance, with n-hexane, a nonpolar solvent, the phenolic compounds were poorly extracted. Diethyl ether and chloroform showed similar extraction efficiency with NaCl and NADES additives, whereas the addition of β-CD did not provide an exhaustive extraction. Taking into account the high volatility of diethyl ether, it was easier to work with ethyl acetate. Therefore, ethyl acetate was selected as appropriate solvent for all samples.
To determine the optimal volume of the extraction solvent, 200, 300, 400, and 500 μL were examined. When the volume is less than 300 μL, the phase separation was not achieved in DLLME and UA-DLLME, while phase separation was reached with 300 μL or more of NaCl and NADES. In order to apply this volume amount to other solvent media, the extraction procedure was modified as follows: the extraction solvent was added in two steps, firstly 200 μL were added in order to achieve an emulsion, then an additional 100 μL of ethyl acetate were rapidly injected. The phase separation was achieved after 5 min in the rest. Applying this procedure, no phase separation in UA-DLLME in β-CD media was observed; therefore, the UA-DLLME was carried out with 400 and 500 μL of ethyl acetate. It was found that with the increase of volume of ethyl acetate, the extraction of total content of phenolics decreased. Therefore, 400 μL was selected for further study on solid samples (Figure 2d). 2.2.4. Selection of Dispersive Solvent Volume
Commonly, ethanol, methanol, and acetonitrile are reported as dispersive solvents in DLLME. In this study, ethanol was selected as dispersive solvent because some food supplements, not considered in this study, of Galium are in ethanolic solution. Therefore, the effect of its volume (100– 500 μL) on the extraction yields was tested. The results showed that the extraction efficiency was enhanced with the increase of the ethanol volume in the solution until 300 μL, while for higher volumes, phase separation was not achieved (Figure 2e).
2.2.5. Optimization of Ultrasonication Time in UA-DLLME
The cyclodextrins (α, β, γ) show amphiphilic characteristics related to a hydrophilic shell and a hydrophobic cavity and could be usefully used as emulsifiers in order to enhance the extraction recovery for the target analytes. Their capacity to improve the extraction efficiency is related to their ability to reduce the interfacial tension between the two phases by an organic solvent/cyclodextrin complex located in the liquid–liquid interface. In this way, an increased contact area between the two phases was observed [30–33]. The aid of ultrasonication was generally required in order to enhance the solubility, as discussed by Saokham et al. [34] in a recent review paper. Different times have been investigated in the range of 2 to 10 min. Since 5 and 10 min showed similar responses, 5 min was selected as optimal in order to reduce the time of analysis.
Figure 2. Optimization of DLLME, UA-DLLME, and MAE. (a) Effect of medium concentration; (b)
Effect of solid:liquid ratio; (c) Selection of extraction solvent; (d) Effect of extraction solvent volume; (e) Effect of dispersive solvent volume. # TCPC—Total concentration of phenolic compounds. Values
expressed are means ± S.D. of three measurements. All the values were statistically significant (p < 0.001), unless otherwise indicated as n.s. (not statistically significant), ** (statistically significant at p <
-CD 0.5 % -C D 1 .0% -C D 1 .5% N aCl 5 % NaC l 10% NaC l 15% NAD ES 5 % NAD ES 1 0% NAD ES 1 5% 0 10000 20000 30000 40000 50000 60000
DLLME UA-DLLME MAE
** ** ns ns ns ns ns a) Medium Concentration TCP C #, g g -1 ns 5:1. 4 10:1 .4 15:1 .4 0 10000 20000 30000 40000 50000 60000 NaCl NADES -CD * * ns ns ns b) Solid:Liquid ratio ( w:v) T CP C #, g g -1 Eth yl a ceta te Die thyl eth er Chl orof orm n-H exan e 0 10000 20000 30000 40000 50000 60000 NaCl NADES -CD c) ns * ns ns ** ns ns Solid:Liquid ratio ( w:v) T CPC #, g g -1 300 400 500 0 10000 20000 30000 40000 50000 60000 NaCl NADES -CD d) ns ns ** ns no phase separation ns ns ns
Extraction solvent volume, L
T CP C #, g g -1 ns 100 200 300 0 10000 20000 30000 40000 50000 60000 NaCl NADES -CD e) ns * ns ns ns
Dispersive solvent volume, L
T CP C #, g g -1
0.01), or * (statistically significant at p < 0.05). Raw data regarding the statistical analyses were reported in Supplementary Materials section S1.
2.3. Reference Method: Microwave-Assisted Extraction
In order to evaluate the performances of the proposed procedure, as in the comparison method, MAE was selected and carried out in the same media as LPME procedures at different concentration levels of the solvents (5–15% solution of NaCl and NADES, and 0.5–1.5% solution of β-CD). Figure 2a shows that the extraction efficiencies obtained in 10% NaCl and 15% NADES were comparable to DLLME and UA-DLLME. Therefore, the recovery of total phenolics, using LPME and MAE, was also comparable.
Following our experimental data, the optimized DLLME conditions found were: 10 mg of the sample, 10% NaCl, 15% NADES or 1% β-cyclodextrin, extraction solvent—400 μL of ethyl acetate, dispersive solvent—300 μL of ethanol, vortex time—30 s, extraction time—1 min, centrifugation at 12000× g for 5 min. In the case of UA-DLLME, 5 min of ultrasonication was required.
2.4. Total Phenolic and Flavonoid Content, Antioxidant Capacity, and Tyrosinase Inhibitory Activity
2.4.1. Total Phenolic Content (TPC) by Spectrophotometric Assay
The Folin–Ciocâlteau assay was employed to determine the TPC of Galium extracts. The maximum TPC was registered in the ethanolic extract of G. purpureum (10.3 ± 0.8 mg GAE/g extract), whereas the lowest concentration was present in the ethanolic extract of G. rivale (1.3 ± 0.2 mg GAE/g extract). A recent study by Lakić et al. showed similar results regarding the low phenolic content of
G. verum (2.4–5.2 mg GAE/g extract), using different extraction solvents [7].
2.4.2. Total Flavonoid Content (TFC) by Spectrophotometric Assay
Results of the total flavonoid content (TFC) of the different plant materials are presented in Table 1. The highest amount for the TFC was obtained for G. verum extract, with a value of 8.60 ± 0.07 mg QE/g d.w., comparable with the value obtained for G. purpureum extract, containing 8.50 ± 0.04 mg QE/g (d.w.). According to the results of the present study, Vlase et al. reported a TPC of 5.2 ± 0.2 g/100 g for a G. verum extract [12] and, additionally, Lakić et al. reported values of 6.4–17.9 mg QE/g (d.w.), for G. verum extracts, using different solvents and extraction times [7] confirming the results herein presented.
2.4.3. Antioxidant Potential Assays
The ferric reducing antioxidant power (FRAP), scavenging of DPPH, and ABTS free radical assays were used to evaluate the antioxidant capacity of Galium species (Table 1). These methods are simple and widely used for the evaluation of antioxidant capacity of herbal extracts/pure compounds. Moreover, the values regarding the total phenolic content (TPC) and total flavonoid content (TFC) are in accordance with antioxidant capacity values of the extracts. In the DPPH assay, G. purpureum (6.3 ± 0.7 mg TE/g extract) exhibited a higher DPPH scavenging capacity than any other considered species (0.4–1.9 mg TE/g extract). The ABTS value for G. purpureum (16.7 ± 0.8 mg TE/g extract) was higher in comparison with the values obtained for the other considered species, which ranged from 4.5 to 7.6 mg TE/g extract.
2.4.4. Tyrosinase Inhibitory Activity
Galium extracts had good tyrosinase inhibitory activities (4.66–70.98% at 8 mg/mL), as reported
in Table 1. The extract of G. album presented the highest tyrosinase inhibition, with a value of 70.98%. Despite the highest concentration of rutin and chlorogenic acid, the ethanolic extract of G. rivale showed no inhibitory effect against tyrosinase. This shows that the synergic effect of the compounds from the tested Galium samples have no or low inhibitory effects in some cases, although it was
demonstrated by many studies that phenolic and flavonoid compounds are, in general, good inhibitors of tyrosinase [19]. The modest tyrosinase inhibitory activity for Galium species is confirmed by other studies as well. For example, Chiocchio et al. reported no tyrosinase inhibitory activity for
G. album [35]. The low inhibitory activity of these extracts can be explained by the presence of other
nondetected compounds, which might block or interfere with the enzyme.
2.5. Quantitative Analysis of Galium Species
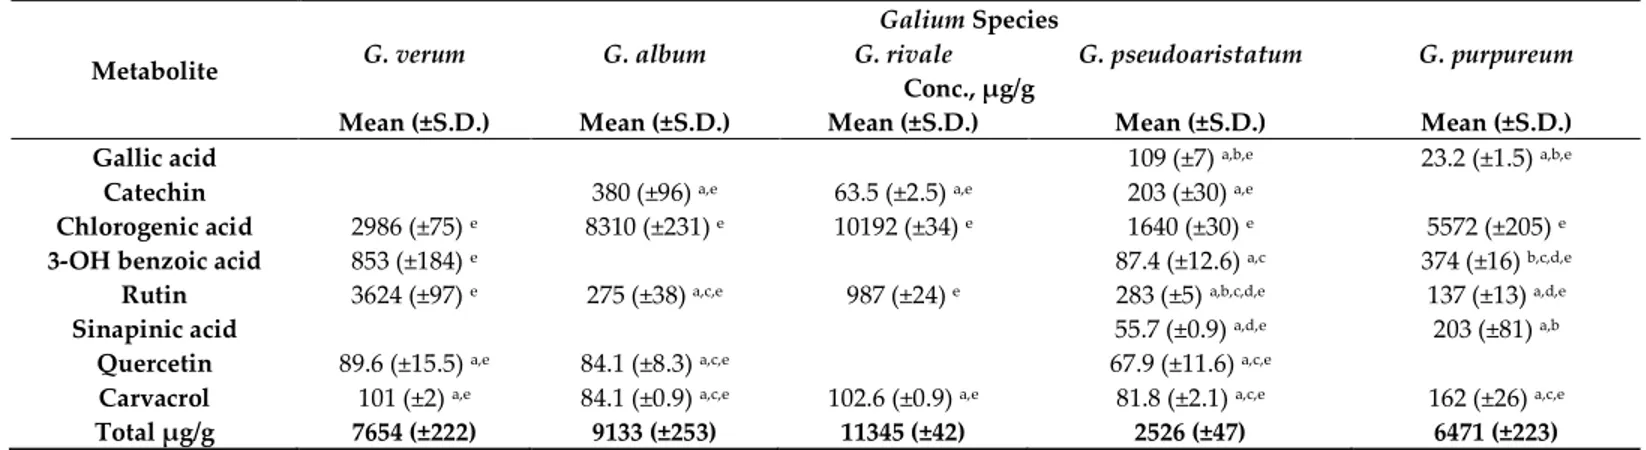
The dry extracts were analyzed to establish the fingerprint of phenolic compounds in five Galium species. Table 2 summarizes the results obtained by means of a validated HPLC-PDA method for phenolics determination. All measurements were performed in triplicate in order to obtain standard deviation. It can be observed that the amount of the phenolic compounds for all Galium species is in the range from 2526.2–11345.1 μg g−1. The major biologically active compounds are chlorogenic acid and rutin. The highest number of the detected phenolic compounds was found in G. rivale (11345.1 μg g−1), where the main compound was chlorogenic acid (10192 ± 34 μg g−1), but the fingerprint was poorer in comparison with other species. The richest multicomponent pattern was observed in G.
pseudoaristatum, but the quantity of phenolic compounds was the lowest (2526.2 μg g−1 ± 46.21). Chromatograms for each Galium sp. were reported in Supplementary Materials Section S2.
OH benzoic acid, vanillic acid, epicatechin, syringic acid, 3-OH-4-MeO benzaldehyde,
p-coumaric acid, t-ferulic acid, naringin, 2.3-diMeO benzoic acid, benzoic acid, o-p-coumaric acid, harpagoside, t-cinnamic acid, and naringenin were not reported into the table because they were not detected by the HPLC-PDA method.
Table 1. Total phenolic and flavonoid content, antioxidant capacity, and enzyme inhibitory effects of the extracts of Galium spp. (values expressed are means ± S.D. of three measurements). TPC (mg GAE/g Extract) TFC (mg QE/g Extract) DPPH Scavenging (mg TE/g Extract) ABTS Scavenging (mg TE/g Extract) FRAP (mg TE/g Extract) Tyrosinase Inhibit. (mg KAE/g Extract) Tyrosinase Inhibit. (% Inhibition)
G. verum 3.1 ± 0.3 a,e 8.60 ± 0.07 a,e 1.9 ± 0.5 a,e 6.15 ± 0.02 a,e 21.9 ± 0.9 a,c,e 7.3 ± 0.2 a,e 36.96
G. album 2.7 ± 0.1 a,e 4.88 ± 0.03 a,e 1.1 ± 0.2 a,e 6.1 ± 0.1 a,e 17.19 ± 0.04 b,e 13.8 ± 3.4 e 70.98
G. rivale 1.3 ± 0.2 a,d,e 4.01 ± 0.08 a,c,e 0.4 ± 0.25 a,e 4.5 ± 0.5 a,d,e 12.6 ± 0.2 a,e na na
G.
pseudoaristatum 4.5 ± 0.6
a,d,e 6.7 ± 0.3 a,c 1.9 ± 0.1 a,e 7.6 ± 0.2 a,d,e 19.4 ± 0.9 a,b,c,e 2.5 ± 1.6 e 4.66
G. purpureum 10.3 ± 0.8 e 8.50 ± 0.04 a,e 6.3 ± 0.7 e 16.7 ± 0.8 e 45.2 ± 1.1 e 6.3 ± 1.4 a,e 29.71
KA (0.1 mg/mL) 62.52
Na—not active; for tyrosinase inhibition (in percentages), the extracts concentration was 8 mg/mL. TFC = Total Flavonoid Content by spectrophotometric assay; TPC = Total Phenolic Content by spectrophotometric assay; ABTS = 2,2’-azino-bis(3-ethylbenzothiazoline-6-sulphonic acid); DPPH = 2,2-diphenyl-1-picryl-hydrazyl-hydrate; FRAP = Ferric Reducing Antioxidant Power; GAE = Gallic Acid Equivalents; QE = Quercetin Equivalents; TE = Trolox Equivalents; KAE = Kojic Acid Equivalents; KA = Kojic Acid. Raw data regarding the statistical analyses were reported in Supplementary Materials Section S1. Data marked with different letters indicates significant difference (p < 0.05).
Table 2. Phenolic compounds quantified in Galium spp. using DLLME in 15% NADES (values expressed are means ± S.D. of three measurements).
Metabolite
Galium Species
G. verum G. album G. rivale G. pseudoaristatum G. purpureum
Conc., μg/g
Mean (±S.D.) Mean (±S.D.) Mean (±S.D.) Mean (±S.D.) Mean (±S.D.)
Gallic acid 109 (±7) a,b,e 23.2 (±1.5) a,b,e
Catechin 380 (±96) a,e 63.5 (±2.5) a,e 203 (±30) a,e
Chlorogenic acid 2986 (±75) e 8310 (±231) e 10192 (±34) e 1640 (±30) e 5572 (±205) e
3-OH benzoic acid 853 (±184) e 87.4 (±12.6) a,c 374 (±16) b,c,d,e
Rutin 3624 (±97) e 275 (±38) a,c,e 987 (±24) e 283 (±5) a,b,c,d,e 137 (±13) a,d,e
Sinapinic acid 55.7 (±0.9) a,d,e 203 (±81) a,b
Quercetin 89.6 (±15.5) a,e 84.1 (±8.3) a,c,e 67.9 (±11.6) a,c,e
Carvacrol 101 (±2) a,e 84.1 (±0.9) a,c,e 102.6 (±0.9) a,e 81.8 (±2.1) a,c,e 162 (±26) a,c,e
Total μg/g 7654 (±222) 9133 (±253) 11345 (±42) 2526 (±47) 6471 (±223)
3. Materials and Methods
3.1. Materials
Chemical standards of phenolic compounds (benzoic acid, carvacrol, catechin, chlorogenic acid,
t-cinnamic acid, 8-cinnamoyl harpagide (harpagoside), o-coumaric acid, p-coumaric acid,
2,3-dimethoxybenzoic acid, epicatechin, t-ferulic acid, gallic acid, 3-hydroxybenzoic acid, 4-hydroxybenzoic acid, 3-hydroxy-4-methoxybenzaldehyde, naringin, naringenin, quercetin, rutin, sinapinic acid, syringic acid, vanillic acid (all purity > 98%)), β-cyclodextrin (≥97%), n-hexane (HPLC-grade), diethyl ether (≥99%), and chloroform (HPLC-grade) were purchased from Sigma-Aldrich (Milan, Italy).
Ethyl acetate (≥99%), acetonitrile grade), methanol grade), ethanol (HPLC-grade), acetic acid (≥99%) as well as D-(+)-glucose were obtained from Carlo Erba Reagents (Milan, Italy). Sodium chloride (≥99%) was obtained from Honeywell (Seelze, Germany). NADES (glycolic acid/betaine mixture) was newly synthesized and supplied by University of Perugia. It was chosen between differently structured novel DES and NADES mixtures for its suitable properties (low freezing point and low viscosity, absence of aromatic compounds in its composition, low cost and natural source of the molecules forming it). Ultra-pure water was obtained using a Millipore Milli-Q Plus water treatment system (18 MΩ cm at 23 °C, Millipore Bedford Corp., Bedford, MA, USA).
3.2. Sampling and Sample Preparation
Samples of Galium species were collected from different locations from Romania, as follows: G.
verum L. from Apuseni mountains region, Sartăș, Alba County, Transylvania, Romania in June 2017, G. album Mill. from Podeni, Cluj Coutry, Romania and from Rimetea, Alba Coutry, Romania, G. purpureum L. and G. pseudoaristatum Schur from Băile Herculane, Caraş-Severin Coutry, in August
2014. All species were authenticated by Dr. Sabin Bădărău and Dr. Andrei Mocan, and voucher specimens were deposited at the herbarium of the Department of Pharmaceutical Botany, “Iuliu Hațieganu” University of Medicine and Pharmacy. Fresh herbal material was dried at room temperature until reaching a constant mass. Afterwards, the plant material was ground into a fine powder using a laboratory mill, mixed to obtain homogenous sample, and kept at 4 °C, for further analyses. All assays were carried out three times (three separate samplings) and in triplicate, and the values reported are represented by average and the standard deviation (S.D.).
3.3. Apparatus
3.3.1. HPLC Analysis
The quantitative analysis of phenolic compounds was performed according to the reported method [36]. The chromatographic system consisted of HPLC Waters liquid chromatograph instrument (model 600 solvent pump, 2996 PDA). Mobile phase was directly on-line degassed by using a Biotech 4CH DEGASI Compact (Onsala, Sweden). For separation of phenolic compounds, C18 reversed-phase column (Prodigy ODS(3), 4.6 × 150 mm, 5 μm; Phenomenex, Torrance, CA), thermostated at 30 °C (±1 °C) was used. The collection and analysis of the data were performed by Empower v.2 software (Waters Corporation, Milford, MA, USA). The mobile phase was a mixture of solution A (3% solution of acetic acid in water) and solution B (3% solution of acetic acid in acetonitrile) in a ratio 93:7 and the gradient mode was applied. The total separation was completed in 1 h (the chemical standards chromatograms, retention times and maximum wavelengths are shown in Supplementary Materials section S3).
3.3.2. Auxiliary Equipment
As auxiliary equipment for the extraction procedures, centrifuge model NF048 (Nuve, Ankara, Turkey), vortex (VELP Scientifica Srl, Usmate, Italy), and ultrasonic bath (Falc Instruments, Treviglio,
Italy) were used. MAE was performed using an automatic Biotage Initiator™ 2.0 (Uppsala, Sweden) characterized by 2.45 GHz high-frequency microwaves and power range 0–300 W. An IR sensor probe controlled the internal vial temperature.
3.4. Extraction Procedures
Extraction optimization was carried out using G. verum and after, under optimized conditions, the microextraction procedure was applied for the other four Galium species. The following microextraction procedure were investigated: DLLME, ultrasound-assisted dispersive liquid-liquid microextraction (UA-DLLME), Salting-out liquid-liquid extraction (SA-LLE), and Sugaring-out liquid-liquid extraction (SULLE). The general procedure for the extractions reported in the following paragraphs was described in Figure 3.
Figure 3. General extraction procedure. 3.4.1. DLLME and UA-DLLME
10 mg of the dry plant material of G. verum were accurately weighted and placed into a 2 mL Eppendorf tube. Subsequently, 700 μL of solvent medium (water, 10% NaCl, NADES, IL or 1% β-cyclodextrin (β-CD)), 400 μL of ethyl acetate, and 300 μL of ethanol were added to the Eppendorf tube by automatic pipette. The solution was vortexed during 30 s until a cloudy solution was formed. In the case of UA-DLLME, after those steps, the test tube was placed into the ultrasound bath for 5 min. Then, the solution was kept at rest for 1 min, for the analytes to distribute into the extraction solvent. For the phase separation, the solution was centrifuged at 12000× g for 5 min. The extraction solvent was found on the top of the Eppendorf tube, and its whole volume was collected using a microsyringe and transferred to the new Eppendorf tube, and then dried under a gentle stream of nitrogen. The dried residue was redissolved in 50 μL of mobile phase under ultrasonication for 5 min and 20 μL of the obtained solution were injected into the HPLC system.
3.4.2. Salting-out-LLE
For salting-out-DLLME (SA-LLE), 10 mg of the dry herbal material of G. verum were placed into a 2 mL Eppendorf tube. Then, 200 μL of water and 400 μL of acetonitrile were added. To obtain the
phase separation, 200 μL of 300 g L−1 solution of NaCl were rapidly injected into the Eppendorf tube. The mixture was vortexed for 1 min and a cloudy solution was formed. The next procedures were the same as in the Section 3.4.1.
3.4.3. Sugaring-out-LLE
For the sugaring-out-LLE (SULLE), the procedure was similar to the SA-LLE. Instead of aqueous NaCl, 200 μL of glucose solution (600 g L−1) was utilized for phase separation.
3.4.4. MAE
10 mg of the dry plant material were placed into a 2 mL sealed vessel suitable for an automatic single-mode microwave reactor and 1 mL of appropriate solvent medium (see Section 3.3.) was added, forming a yellow-green emulsion. MAE was carried out heating by microwave irradiation for 13 min 8 s at 80 °C (which correspond approximatively to 24 h of maceration at 25 °C), and then cooling to room temperature by pressurized air. Then, the homogenate was centrifuged at 12000× g for 5 min and 20 μL of the solution were directly injected into the HPLC system.
3.5. Total Phenolic and Flavonoid Content, Antioxidant Capacity, and Tyrosinase Inhibitory Activity
3.5.1. Antioxidant Assays
Total Phenolic Content (TPC) by Spectrophotometric Assay
The TPC was determined using the Folin–Ciocâlteu method described by Mocan et al. [37]. For a high throughput of samples, a SPECTROstar Nano Multi—Detection Microplate Reader with 96-well plates (BMG Labtech, Ortenberg, Germany) was used. Briefly, a mixture solution consisting of 20 μL of extract, 100 μL of Folin-Ciocâlteu reagent, and 80 μL of sodium carbonate (Na2CO3, 7.5%
w/v) was homogenized and incubated at room temperature in the dark for 30 min. Afterwards, the
absorbance of the samples was measured at 760 nm. Gallic acid was used as a reference standard, and the TPC was expressed as gallic acid equivalents (GAE) in mg/g dry weight (d.w.) of plant material.
Total Flavonoid Content (TFC) by Spectrophotometric Assay
The total flavonoid content (TFC) was calculated and expressed as quercetin equivalents using a method previously described by Mocan et al. [38]. Briefly, a 100 μL aliquot of 2% AlCl3 aqueous solution was mixed with 100 μL of sample. After an incubation time of 15 min, the absorbance of the sample was measured at 420 nm. Quercetin was used as a reference standard, and the TFC was expressed as quercetin equivalents (QE) in mg/g dry weight (d.w.) of plant material.
DPPH Radical Scavenging Assay
The capacity to scavenge the “stable” free radical DPPH, monitored according to the method described by Martins et al. [39], with some modifications, was performed by using a SPECTROstar Nano microplate reader (BMG Labtech, Offenburg, Germany). The reaction mixture in each of the 96-wells consisted of 30 μL of sample solution (in an appropriated dilution) and a 0.004% methanolic solution of DPPH. The mixture was further incubated for 30 min in the dark, and the reduction of the DPPH radical was determined at 515 nm. Trolox was used as a standard reference and the results were expressed as Trolox equivalents per g of dry weight herbal extract (mg TE/g d.w. of herbal extract).
Trolox Equivalent Antioxidant Capacity (TEAC) Assay
In the Trolox equivalent antioxidant capacity (TEAC) assay, the antioxidant capacity is reflected in the ability of the Galium extracts to decrease the color, reacting directly with the ABTS radical. The
latter was obtained by oxidation of ABTS (2,2’-azinobis(3-ethylbenzothiazoline-6-sulfonic acid)) with potassium peroxydisulfate (K2S2O8). The amount of ABTS radical consumed by the tested compound was measured at 760 nm after 6 min of reaction time. The evaluation of the antioxidant capacity was obtained using the total change in absorbance at this wavelength. The percentage of ABTS consumption was transformed in Trolox equivalents (TE) using a calibration curve.
FRAP Assay
In FRAP assays, the reduction of Fe3+-TPTZ to blue-colored Fe2+-TPTZ complex was monitored by the method described by Damiano et al., (2017) with slight modifications [40]. The FRAP reagent was prepared by mixing ten volumes of acetate buffer (300 mM, pH 3.6), one volume of TPTZ solution (10 mM TPTZ in 40 mM HCl) and one volume of FeCl3 solution (20 mM FeCl3·6H2O in 40 mM HCl). Reaction mixture (25 μL sample and 175 μL FRAP reagent) was incubated in the dark for 30 min at room temperature and the absorbance of each solution was measured at 593 nm using a SPECTROstar Nano Multi-Detection Microplate Reader with 96-well plates (BMG Labtech, Ortenberg, Germany). A TroloxTM calibration curve (0.01–0.10 mg/mL) was plotted as a function of blue-colored Fe2+-TPTZ complex formation, and the results were expressed as milligrams of trolox equivalents (TE) per milligram of extract (mg TE/mg extract).
3.5.2. Tyrosinase Inhibitory Activity
Tyrosinase inhibitory activity of each sample was determined by the method previously described by Likhitwitayawuid and Sritularak, (2001) and Masuda et al., (2005) [41,42] using a SPECTROstar Nano Multi-Detection Microplate Reader with 96-well plates (BMG Labtech, Ortenberg, Germany). Samples were dissolved in water containing 5% DMSO; for each sample four wells were designated as A, B, C, D; each one contained the reaction mixture (200 μL) as follows: (A) 120 μL of 0.66 M phosphate buffer solution (pH = 6.8) (PBS) and 40 μL of mushroom tyrosinase in PBS (46 U/mL) (Tyr), (B) 160 μL of PBS, (C) 80 μL of PBS, 40 μL of Tyr, and 40 μL of sample, and (D) 120 μL of PBS and 40 μL of sample. The plate was then incubated at room temperature for 10 min; after incubation, 40 μL of 2.5 mM L-DOPA in PBS solution were added in each well and the mixtures were incubated again at room temperature for 20 min. The absorbance of each well was measured at 475 nm, and the inhibition percentage of the tyrosinase activity was calculated by the following equation, using as positive control a kojic acid solution (0.10 mg/mL):
% =( − ) − ( − )
( − ) × (1)
The results were also expressed as mg kojic acid equivalents per gram of dry weight extract (mg KAE/g extract) using a calibration curve between 0.01–0.10 mg kojic acid per milliliter of solution.
3.6. Statistical Analysis
All experiments were performed in triplicate and the results were expressed as the mean value ± standard deviation (S.D.). All comparisons were determined by using two-way ANOVA followed by Bonferroni post-test and GraphPad Prism v.4 for data elaboration. Raw data regarding the statistical analyses were reported in Supplementary Materials Section S1.
4. Conclusions
In this work, a microextraction procedure was developed and applied for the establishment of the multicomponent phenolic pattern of aerial parts from G. verum, G. album, G. rivale, G.
pseudoaristatum, and G. purpureum. The DLLME procedure in NADES solvent medium could provide
high extraction efficiency within a short extraction time and with good correspondence with the MAE procedure. The biological results showed that G. purpureum and G. verum extracts contained the highest total phenolic and flavonoid contents, respectively. G. purpureum extract was the most active extract in terms of antioxidant capacity, whereas the G. album extract exhibited the strongest
inhibitory effect against tyrosinase, an enzyme involved in several skin disorders. The results indicate that Galium extracts have the potential to be used as an alternative source of multifunctional agents and are a promising starting point for development of new bioactive formulations. Further studies are essential for the isolation of pure bioactive compounds and investigation of their molecular mechanisms of action.
Supplementary Materials: The following are available online. In section S1 were reported all the raw data
obtained using GraphPad v.4 and Bonferroni post-test related to the statistical analyses for Figures and Tables present in the main text. In section S2 the chromatograms of dry extracts of Galium species obtained using DLLME (@ 278 nm as example of wavelength in which all compounds show absorbance) were reported. In section S3 the chromatogram (@ 278 nm as example of wavelength in which all compounds show absorbance) for the 22 chemical standards, with a table reporting the retention times and the maximum wavelengths used for the quantitative analyses was reported.
Author Contributions: Data curation, A.T., A.D., and M.D.S.; Investigation, A.T., A.D., and M.D.S.;
Methodology, M.L., A.M., S.B., C.M., V.A., S.C., C.C., M.T., R.G., D.V. and G.C.; Project administration, M.L., A.M., S.B., C.M., V.A., S.C., D.V. and G.C.; Supervision, M.L., A.M., S.B., C.M., V.A., S.C., D.V. and G.C.
Funding: This work was financially supported by MIUR ex 60%, University “G. d’Annunzio” of Chieti – Pescara,
Chieti, Italy, and the Scientific Grant Agency of the Ministry of Education, Science, Research and Sport of the Slovak Republic (VEGA 1/0010/15). Andrei Mocan was supported by the Competitiveness Operational Programme, Priority Axis 1, Action 114, Project Type “Attracting high level personal from abroad” POC-A1-A1.1.4-E_2015 developed with the support of MCI (Acronym: ProGlyCom, Project ID: POC/ID P_37_637, 2016-2020).
Acknowledgements: A.D. gratefully thanks the University “G. d’Annunzio” of Chieti – Pescara, Dept. of
Pharmacy and Erasmus+ program for giving her the opportunity of the research project implementation.
Conflicts of Interest: Authors declare no competing financial interest. Abbreviations
ABTS 2,2’-azino-bis(3-ethylbenzothiazoline-6-sulphonic acid) β-CD β-cyclodextrin
DLLME Dispersive Liquid–Liquid MicroExtraction DMSO Dimethyl sulfoxide
DPPH 2,2-diphenyl-1-picryl-hydrazyl-hydrate d.w. dry weight
FRAP Ferric Reducing Antioxidant Power GAE Gallic Acid Equivalents
GC Gas Chromatography
HPLC High Performance Liquid Chromatography
HPLC-PDA High Performance Liquid Chromatography-Photodiode array detector ILs ionic liquids
KA Kojic Acid
KAE Kojic Acid Equivalents LPME Liquid Phase MicroExtraction MAE Microwave-Assisted Extraction NADES NAtural Deep Eutectic Solvent QE Quercetin Equivalents
SA-LLE Salting-out Liquid-liquid extraction SULLE Sugaring-out Liquid-liquid extraction TCPC Total Concentration of Phenolic Compounds TE Trolox Equivalents
TEAC Trolox Equivalent Antioxidant Capacity
TFC Total Flavonoid Content by spectrophotometric assay TPC Total Phenolic Content by spectrophotometric assay
References
1. Efferth, T. Perspectives for globalized natural medicines. Chin. J. Nat. Med. 2011, 9, 1–6, doi:10.1016/S1875-5364(11)60010-1.
2. Böjthe-Horváth, K.; Kocsis, A.; Párkány, L.; Simon, K. A new iridoid glycoside from Galium verum L. First X-ray analysis of a tricyclic iridoid glycoside. Tetrahedron Lett. 1982, 23, 965–966, doi:10.1016/S0040-4039(00)86995-6.
3. Mitova, M.I.; Anchev, M.E.; Handjieva, N.V.; Popov, S.S. Iridoid patterns in Galium L. and some phylogenetic considerations, Zeitschrift Fur Naturforsch. J. Biosci. 2002, 57, 226–234, doi:10.1515/znc-2002-3-405.
4. Demirezer, L.O.; Gürbüz, F.; Güvenalp, Z.; Ströch, K.; Zeeck, A. Iridoids, flavonoids and monoterpene glycosides from Galium verum subsp. Verum. Turk J. Chem. 2006, 30, 525–534.
5. Zhao, C.C.; Shao, J.H.; Li, X.; Kang, X.D.; Zhang, Y.W.; Meng, D.L.; Li, N. Flavonoids from Galium verum L.
J. Asian Nat. Prod. Res. 2008, 10, 611–615, doi:10.1080/10286020802133217.
6. Zhao, C.C.; Shao, J.H.; Li, X.; Xu, J.; Wang, J.H. A new anthraquinone from Galium verum L. Nat. Prod. Res.
2006, 20, 981–984, doi:10.1080/14786410600921532.
7. Lakić, N.S.; Mimica-Dukić, N.M.; Isak, J.M.; Božin, B.N. Antioxidant properties of Galium verum L. (Rubiaceae) extracts. Cent. Eur. J. Biol. 2010, 5, 331–337, doi:10.2478/s11535-010-0022-4.
8. Khalili, M.; Ebrahimzadeh, M.A.; Safdari, Y. Antihaemolytic activity of thirty herbal extracts in mouse red blood cells. Arh. Hig. Rada Toksikol. 2014, 65, 399–406, doi:10.2478/10004-1254-65-2014-2513.
9. Il’ina, T.V.; Kovaleva, A.M.; Goryachaya, O.V.; Aleksandrov, A.N. Essential oil from Galium verum flowers.
Chem. Nat. Compd. 2009, 45, 587–588, doi:10.1007/s10600-009-9375-1.
10. Schmidt, M.; Scholz, C.; Gavril, G.; Otto, C.; Polednik, C.; Roller, J.; Hagen, R. Effect of Galium verum aqueous extract on growth, motility and gene expression in drug-sensitive and -resistant laryngeal carcinoma cell lines. Int. J. Oncol. 2014, 44, 745–760, doi:10.3892/ijo.2013.2220.
11. Menković, N.; Šavikin, K.; Tasić, S.; Zdunić, G.; Stešević, D.; Milosavljević, S.; Vincek, D. Ethnobotanical study on traditional uses of wild medicinal plants in Prokletije Mountains (Montenegro). J. Ethnopharmacol.
2011, 133, 97–107, doi:10.1016/j.jep.2010.09.008.
12. Vlase, L.; Mocan, A.; Hanganu, D.; Gheldiu, A.; Crișan, G. Comparative study of polyphenolic content, antioxidant and antimicrobial activity of four Galium species (Rubiaceae). Dig. J. Nanomater. Biostruct. 2014,
9, 1085–1094.
13. Pieroni, A.; Quave, C.L. Traditional pharmacopoeias and medicines among Albanians and Italians in southern Italy: A comparison. J. Ethnopharmacol. 2005, 101, 258–270, doi:10.1016/j.jep.2005.04.028.
14. Schmidt, M.; Polednik, C.; Roller, J.; Hagen, R. Galium verum aqueous extract strongly inhibits the motility of head and neck cancer cell lines and protects mucosal keratinocytes against toxic DNA damage. Oncol.
Rep. 2014, 32, 1296–1302, doi:10.3892/or.2014.3316.
15. Płotka-Wasylka, J.; Rutkowska, M.; Owczarek, K.; Tobiszewski, M.; Namieśnik, J. Extraction with environmentally friendly solvents. TrAC. 2017, 91, 12–25, doi:10.1016/j.trac.2017.03.006.
16. Craveiro, R.; Aroso, I.; Flammia, V.; Carvalho, T.; Viciosa, M.T.; Dionísio, M.; Barreiros, S.; Reis, R.L.; Duarte, A.R.C.; Paiva, A. Properties and thermal behavior of natural deep eutectic solvents. J. Mol. Liq. 2016,
215, 534–540, doi:10.1016/j.molliq.2016.01.038.
17. Khezeli, T.; Daneshfar, A.; Sahraei, R. A green ultrasonic-assisted liquid-liquid microextraction based on deep eutectic solvent for the HPLC-UV determination of ferulic, caffeic and cinnamic acid from olive, almond, sesame and cinnamon oil. Talanta 2016, 150, 577–585, doi:10.1016/j.talanta.2015.12.077.
18. Shishov, A.; Bulatov, A.; Locatelli, M.; Carradori, S.; Andruch, V. Application of deep eutectic solvents in analytical chemistry. A review. Microchem. J. 2017, 135, 33–38, doi:10.1016/j.microc.2017.07.015.
19. Kim, Y.J.; Uyama, H. Tyrosinase inhibitors from natural and synthetic sources: Structure, inhibition mechanism and perspective for the future. Cell. Mol. Life Sci. 2005, 62, 1707–1723, doi:10.1007/s00018-005-5054-y.
20. Loizzo, M.R.; Tundis, R.; Menichini, F. Natural and synthetic tyrosinase inhibitors as antibrowning agents: An update. Compr. Rev. Food Sci. Food Saf. 2012, 11, 378–398, doi:10.1111/j.1541-4337.2012.00191.x.
21. Zengin, G.; Menghini, L.; Di Sotto, A.; Mancinelli, R.; Sisto, F.; Carradori, S.; Cesa, S.; Fraschetti, C.; Filippi, A.; Angiolella, L.; et al. Chromatographic analyses, in vitro biological activities and cytotoxicity of Cannabis
22. Di Sotto, A.; Di Giacomo, S.; Amatore, D.; Locatelli, M.; Vitalone, A.; Toniolo, C.; Rotino, G.L.; Lo Scalzo, R.; Palamara, A.T.; Marcocci, M.E.; et al. A Polyphenol Rich Extract from Solanum melongena L. DR2 Peel Exhibits Antioxidant Properties and Anti-Herpes Simplex Virus Type 1 Activity In Vitro. Molecules 2018,
23, doi:10.3390/molecules23082066.
23. Boutaoui, N.; Zaiter, L.; Benayache, F.; Benayache, S.; Cacciagrano, F.; Cesa, S.; Secci, D.; Carradori, S.; Giusti, A.M.; Campestre, C.; et al. Atriplex mollis Desf. Aerial Parts: Extraction Procedures, Secondary Metabolites and Color Analysis. Molecules 2018, 23, doi:10.3390/molecules23081962.
24. Locatelli, M.; Macchione, N.; Ferrante, C.; Chiavaroli, A.; Recinella, L.; Carradori, S.; Zengin, G.; Cesa, S.; Leporini, L.; Leone, S.; et al. Graminex pollen: Phenolic pattern, colorimetric analysis and protective effects in immortalized prostate cells (PC3) and rat prostate challenged with LPS. Molecules 2018, 23, doi:10.3390/molecules23051145.
25. Boutaoui, N.; Zaiter, L.; Benayache, F.; Benayache, S.; Carradori, S.; Cesa, S.; Giusti, A.M.; Campestre, C.; Menghini, L.; Innosa, D.; et al. Qualitative and Quantitative Phytochemical Analysis of Different Extracts from Thymus algeriensis Aerial Parts. Molecules 2018, 23, doi:10.3390/molecules23020463.
26. Melucci, D.; Locatelli, M.; Locatelli, C.; Zappi, A.; De Laurentiis, F.; Carradori, S.; Campestre, C.; Leporini, L.; Zengin, G.; Picot, C.M.N.; et al. A Comparative Assessment of Biological Effects and Chemical Profile of Italian Asphodeline lutea Extracts. Molecules 2018, 23, doi:10.3390/molecules23020461.
27. Tartaglia, A.; Locatelli, M.; Kabir, A.; Furton, K.G.; Macerola, D.; Sperandio, E.; Piccolantonio, S.; Ulusoy, H.I.; Maroni, F.; Bruni, P.; et al. Comparison between Exhaustive and Equilibrium Extraction Using Different SPE Sorbents and Sol-Gel Carbowax 20M Coated FPSE Media. Molecules 2019, 24, 382–398, doi:10.3390/molecules24030382.
28. Hemwimon, S.; Pavasant, P.; Shotipruk, A. Microwave-assisted extraction of antioxidative anthraquinones from roots of Morinda citrifolia. Sep. Purif. Technol. 2007, 54, 44–50, doi:10.1016/j.seppur.2006.08.014. 29. Mollica, A.; Locatelli, M.; Macedonio, G.; Carradori, S.; Sobolev, A.P.; De Salvador, R.F.; Monti, S.M.;
Buonanno, M.; Zengin, G.; Angeli, A.; et al. Microwave-assisted extraction, HPLC analysis, and inhibitory effects on carbonic anhydrase I, II, VA, and VII isoforms of 14 blueberry Italian cultivars. J. Enzyme Inhib.
Med. Chem. 2016, 6366, 1–6, doi:10.1080/14756366.2016.1214951.
30. Hashizaki, K.; Kageyama, T.; Inoue, M.; Taguchi, H.; Ueda, H.; Saito, Y. Study on preparation and formation mechanism of n-alkanol/water emulsion using α-cyclodextrin. Chem. Pharm. Bull. 2007, 55, 1620– 1625.
31. Inoue, M.; Hashizaki, K.; Taguchi, H.; Saito, Y. Preparation and characterization of n-alkane/water emulsion stabilized by cyclodextrin. J. Oleo. Sci. 2009, 58, 85–90, doi:10.5650/jos.58.85.
32. Duchêne, D.; Bochot, A.; Yu, S.C.; Pépin, C.; Seiller, M. Cyclodextrins and emulsions. Int. J. Pharm. 2003,
266, 85–90, doi:10.1039/c3cp52116h.
33. Diuzheva, A.; Carradori, S.; Andruch, V.; Locatelli, M.; De Luca, E.; Tiecco, M.; Germani, R.; Menghini, L.; Nocentini, A.; Gratteri, P.; et al. Use of Innovative (Micro)Extraction Techniques to Characterise
Harpagophytum procumbens Root and its Commercial Food Supplements. Phytochem. Anal. 2018, 3, 233–241,
doi:0.1002/pca.2737.
34. Saokham, P.; Muankaew, C.; Jansook, P.; Loftsson, T. Solubility of Cyclodextrins and Drug/Cyclodextrin Complexes. Molecules 2018, 23, doi:10.3390/molecules23051161.
35. Chiocchio, I.; Mandrone, M.; Sanna, C.; Maxia, A.; Tacchini, M.; Poli, F. Industrial Crops & Products screening of a hundred plant extracts as tyrosinase and elastase inhibitors, two enzymatic targets of cosmetic interest. Ind. Crop. Prod. 2018, 122, 498–505, doi:10.1016/j.indcrop.2018.06.029.
36. Zengin, G.; Menghini, L.; Malatesta, L.; De Luca, E.; Bellagamba, G.; Uysal, S.; Aktumsek, A.; Locatelli, M. Comparative study of biological activities and multicomponent pattern of two wild Turkish species:
Asphodeline anatolica and Potentilla speciosa. J. Enzyme Inhib. Med. Chem. 2016, 31, 203–208,
doi:10.1080/14756366.2016.1178247.
37. Mocan, A.; Schafberg, M.; Crisan, G.; Rohn, S. Determination of lignans and phenolic components of
Schisandra chinensis (Turcz.) Baill. using HPLC-ESI-ToF-MS and HPLC-online TEAC: Contribution of
individual components to overall antioxidant activity and comparison with traditional antioxidant assays.
J. Funct. Food. 2016, 24, 579–594, doi:10.1016/j.jff.2016.05.007.
38. Mocan, A.; Crişan, G.; Vlase, L.; Crişan, O.; Vodnar, D.C.; Raita, O.; Gheldiu, A.M.; Toiu, A.; Oprean, R.; Tilea, I. Comparative studies on polyphenolic composition, antioxidant and antimicrobial activities of
39. Martins, N.; Barros, L.; Dueñas, M.; Santos-Buelga, C.; Ferreira, I.C.F.R. Characterization of phenolic compounds and antioxidant properties of Glycyrrhiza glabra L. rhizomes and roots. RSC Adv. 2015, 5, 26991– 26997, doi:10.1039/C5RA03963K.
40. Damiano, S.; Forino, M.; De, A.; Vitali, L.A.; Lupidi, G.; Taglialatela-Scafati, O. Antioxidant and antibiofilm activities of secondary metabolites from Ziziphus jujuba leaves used for infusion preparation. Food Chem.
2017, 230, 24–29, doi:10.1016/j.foodchem.2017.02.141.
41. Likhitwitayawuid, K.; Sritularak, B. A new dimeric stilbene with tyrosinase inhibitory activity from
Artocarpus gomezianus. J. Nat. Prod. 2001, 64, 1457–1459, doi:10.1021/np0101806.
42. Masuda, T.; Yamashita, D.; Takeda, Y.; Yonemori, S. Screening for tyrosinase inhibitors among extracts of seashore plants and identification of potent inhibitors from Garcinia subelliptica. Biosci. Biotechnol. Biochem.
2005, 69, 197–201, doi:10.1271/bbb.69.197.
Sample Availability: Samples of the compounds are not available from the authors.
© 2019 by the authors. Licensee MDPI, Basel, Switzerland. This article is an open access article distributed under the terms and conditions of the Creative Commons Attribution (CC BY) license (http://creativecommons.org/licenses/by/4.0/).