DOTTORATO DI RICERCA IN
"BIOLOGIA EVOLUZIONISTICA E AMBIENTALE" CICLO XXVI
COORDINATORE Prof. Guido Barbujani
Dissection of pleiotropic effects in genome-wide
association studies of phenotypes related to
cardiometabolic health
Settore Scientifico Disciplinare BIO/18
Dottorando Tutore
Dott.ssa Marullo Letizia Prof.ssa Chiara Scapoli
Cotutore
Dott.ssa Inga Prokopenko
1 Index
1 Index ... 1
2 Literature Review ... 7
2.1 Introduction ... 8
2.1.1 Mendelian and Complex phenotypes, causal variants and Genome Wide Association Studies (GWASs) ... 8
2.1.2 Cross-Phenotype association and definition of pleiotropy ... 15
2.1.3 History of Pleiotropy definition ... 18
2.1.4 Insights into the definition of pleiotropy ... 20
2.1.4.1 Other types of pleiotropy ... 20
2.1.4.2 The extent of pleiotropy and its relationship with evolutionary processes ... 21
2.1.4.3 Features of pleiotropic genes ... 24
2.2 State of the art in the study of pleiotropic effects ... 25
2.2.1 General introduction ... 25
2.2.2 Methods for studying cross-phenotype effects ... 27
2.2.2.1 Multiple univariate analyses ... 27
Simple comparison of univariate analysis results ... 28
Simple meta-analytical approaches ... 29
Cross-phenotype meta-analysis (CPMA) method ... 29
Meta-analyses of the effects of genetic variants on multiple phenotypes ... 30
O’Brien’s linear combination test and its extensions ... 32
TATES ... 33
PRIMe ... 34
2.2.2.2 Dimension reduction techniques ... 34
Decomposition of covariance matrix ... 34
Principal components analysis ... 35
2.2.2.3 Multivariate approaches ... 37
Multivariate regression framework for continuous phenotypes ... 37
2 1 | Index
Multivariate methods for continuous and categorical phenotypes together ... 41
2.2.2.4 Graphical multivariate approaches ... 46
Graph-based methods ... 46
Tree-based methods ... 48
Bayesian network methods ... 49
2.2.2.5 Polygenic approaches ... 50
2.2.2.6 Knock-out, knock-down and knock-in models ... 51
2.2.3 Distinguishing real pleiotropy from mediation and allelic heterogeneity ... 52
2.2.3.1 Identifying mediation ... 52
2.2.3.2 Identifying allelic heterogeneity ... 54
2.2.3.3 Functional characterisation ... 54
2.3 Overview of genetics of cardiometabolic phenotypes ... 56
2.3.1 Genetic discoveries for cardiometabolic phenotypes ... 56
2.3.1.1 General introduction ... 56
2.3.1.2 Type 2 Diabetes ... 58
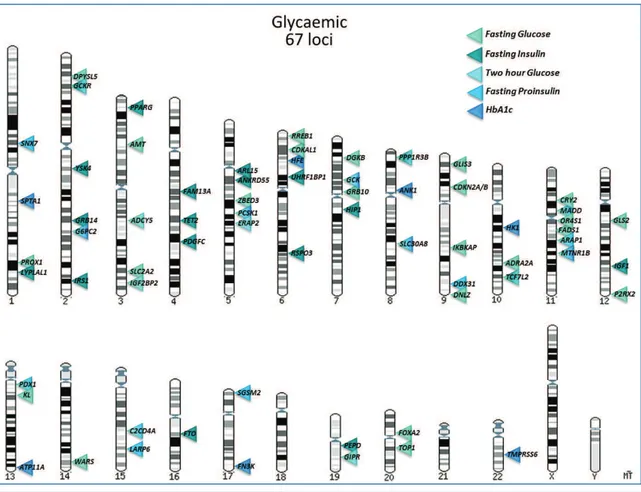
2.3.1.3 Glycaemic Traits ... 62
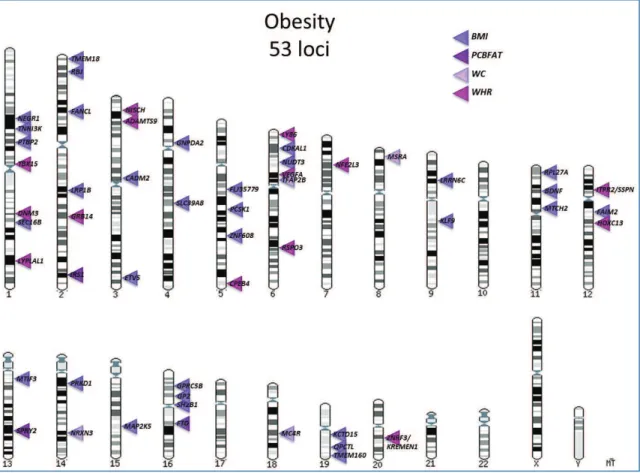
2.3.1.4 Obesity, obesity-related traits and Height ... 66
2.3.1.5 Lipids ... 71
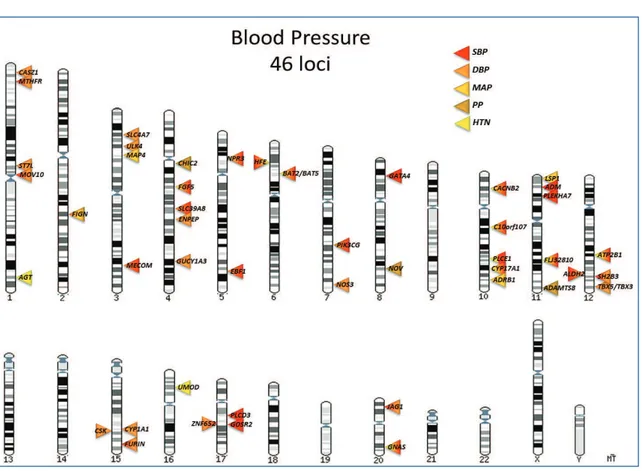
2.3.1.6 Blood pressure and Hypertension ... 74
2.3.2 Evidence of CP effects in cardiometabolic phenotypes ... 78
2.3.3 Relationships between cardiometabolic phenotypes... 81
2.3.3.1 Proposed models: Metabolic Syndrome ... 81
2.3.3.2 Alternative models and methods of study ... 82
3 PhD Project ... 85
3.1 Preliminary data and General aim ... 86
3.1.1 Preliminary analysis: multi-phenotype effects of glycaemic loci and evidence of directional consistency ... 86
3.1.1.1 Introduction ... 86
3.1.1.2 Materials and Methods ... 86
False Discovery Rate analysis ... 86
Graphical visualisation of associations of glycaemic trait variants with other cardiometabolic traits ... 87
Analyses of directional consistency of cardiometabolic trait associations between
discovery and follow-up studies ... 88
3.1.1.3 Results ... 89
3.1.1.4 Discussion ... 90
3.1.2 The Cross-Consortia Pleiotropy Group ... 93
3.1.3 Aims of my PhD project ... 94
3.2 Project 1: Clustering and pathway analysis of univariate GWAS results for the detection of pleiotropic effects ... 96
3.2.1 Introduction and Aim ... 96
3.2.2 Materials and Methods ... 97
3.2.2.1 Starting data: cardiometabolic univariate meta-analyses results ... 97
3.2.2.2 Selection of variants at cardiometabolic loci ... 98
3.2.2.3 Alignment of multi-phenotype effects and meta-analysis of multiple association . 98 Omnibus p-value calculation through Fisher’s omnibus test as a simple multi-phenotype meta-analysis ... 98
Z-score calculation ... 99
Used software... 100
3.2.2.4 Clustering of cardiometabolic loci effects on multiple phenotypes... 100
Clustering method ... 100
Sub-cluster sets definition ... 100
Used software... 101
3.2.2.5 Pathway analysis ... 101
DAPPLE ... 101
STRING ... 103
Other approaches to evaluate pathways ... 104
3.2.3 Results ... 106
3.2.3.1 Alignment of meta-analysis results for cardiometabolic SNPs and Fisher’s Omnibus p-value calculation ... 106
3.2.3.2 Evaluation of multi- phenotype effects and association significance at cardiometabolic loci through complete hierarchical clustering ... 110
3.2.3.3 Definition of sub-clusters of loci with shared effects and Pathway analyses ... 113
Sub-clusters of cardiometabolic loci without a uniform trend of multi- phenotype effects ... 113
4 1 | Index
Sub-clusters of cardiometabolic loci characterised by an effect on a single phenotype or on
a specific subgroup of phenotypes ... 114
Sub-clusters with unexpected effects on a specific subgroup of phenotypes ... 117
Sub-clusters with multiple effects consistent with the definition of MetS ... 121
Sub-clusters with multiple unexpected effects ... 125
3.2.4 Discussion ... 129
3.3 Project 2: Validating pleiotropy, and analysis of locus architecture in potential pleiotropic regions 132 3.3.1 Introduction and Aim ... 132
3.3.2 Materials and methods ... 133
3.3.2.1 Identification of variants with multi-phenotype cardiometabolic associations .... 133
3.3.2.2 Definition and characterization of genomic regions with multi-phenotype association signals ... 134
Genomic region definition ... 134
Region categorisation based on Linkage Disequilibrium ... 134
Region categorisation based on correlation between associated traits ... 134
3.3.2.3 Regional plots examination for genome-wide associations ... 135
3.3.2.4 Approximate Conditional Analysis ... 135
3.3.3 Results ... 137
3.3.3.1 Genomic regions with multi- phenotype cardiometabolic associations and their descriptive characterisation ... 137
3.3.3.2 Visualisation of the association signals ... 141
3.3.3.3 Approximate Conditional Analysis ... 143
3.3.3.4 Final interpretation of cardiometabolic loci architecture ... 146
3.3.4 Discussion ... 147
3.4 Project 3: A multivariate approach for the study of pleiotropy within cardiometabolic phenotypes ... 150
3.4.1 Introduction and Aim ... 150
3.4.1.1 The ENGAGE consortium ... 151
3.4.2 Stage one: Genome-wide multi-phenotype meta-analysis of lipids five-trait and BMI 152 3.4.2.1 Materials and Methods ... 152
Studies ... 152
Traits ... 154
Statistical analysis ... 154
3.4.2.2 Results ... 155
3.4.3 Stage two: Multi-phenotype follow-up analysis of two selected loci, FTO and FADS1, to dissect the mechanism of multi-phenotype effects ... 161
3.4.3.1 Materials and Methods ... 161
Studies ... 161
SNPs and proxies at FTO and FADS1... 161
Sets of analysed phenotypes ... 161
Statistical analysis ... 163
3.4.3.2 Results ... 165
3.4.4 Discussion ... 166
4 Final discussion and conclusions ... 169
4.1 Main conclusions of our study ... 170
4.1.1 Hypothesis about pleiotropic effects on metabolic phenotype ... 170
4.1.2 What we discovered in developed projects ... 170
Both univariate and multivariate approaches can be applied for the study of pleiotropy 171 Cardiometabolic phenotypes share genetic background ... 171
Cardiometabolic phenotype loci can be grouped according to the combination of their multi-phenotype effects ... 171
Genetic loci with similar cardiometabolic effects are involved in shared biological pathways ... 172
Many T2D loci are related to beta-cell function ... 172
There is a causal relationship between adiposity and cardiometabolic phenotypes ... 172
Many cardiometabolic phenotype associated variants constitute potential multi-phenotype allelic heterogeneity ... 172
4.1.3 What remains uncovered, future directions for the study of pleiotropy and its applications ... 173
4.1.3.1 Additional methods and fields to explore ... 173
4.1.3.2 Clinical implications of cross-phenotype effects and pleiotropy ... 174
4.2 Main conclusion of my PhD experience ... 176
5 Appendix tables ... 177
8 2 | Literature review
2.1 Introduction
2.1.1 Mendelian and Complex phenotypes, causal variants and Genome
Wide Association Studies (GWASs)
One of the most important challenges in human genetics is the identification of polymorphisms and variants in the DNA sequence, related to phenotypic traits and/or lead to an increased risk of developing diseases. In this context, the multifaceted goals of genetics can be summarised as describing, understanding and utilising the relationship between genotypes and phenotypes, or the genotype–phenotype map (GPM)1.
Generally, human hereditary phenotypes are classified into two primary groups: Mendelian and non-Mendelian or multifactorial complex phenotypes.
Mendelian phenotypes have, as we can derive from the name, a hereditary modality which is ascribable to a Mendelian model. Commonly, they are rare, with a frequency in the population less than 0.05%.
In the case of Mendelian diseases, as for example sickle-cell anaemia or cystic fibrosis, the genetic association is with a single gene, therefore the genotype-phenotype relationship is easily interpretable.
There exist six main different schemes of heredity for Mendelian characters: · Autosomal dominant, · Autosomal recessive, · X-linked dominant, · X-linked recessive, · Y-linked, · Mitochondrial.
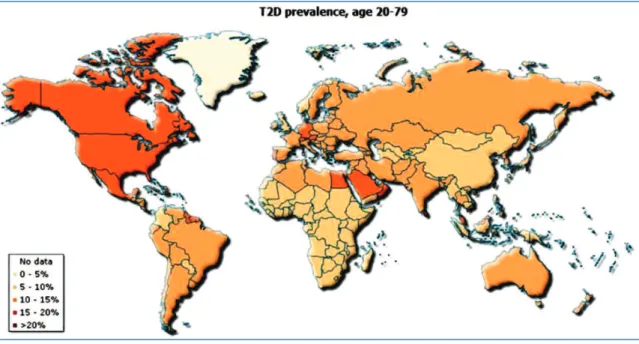
Non-Mendelian phenotypes represent a more serious hazard for public health as they can assume a population frequency more than 1%. In fact, the most common human diseases - such as Type 2 Diabetes (T2D), obesity, Cardio-vascular Diseases (CVD) and schizophrenia - reside in this group. From this, it is easy to deduce that understanding risk factors and etiological processes involved in the development of complex traits and disorders, in particular of common complex human diseases, is one of the biggest challenges of human genetics. A common characteristic of complex phenotypes is that they present an increased familiarity without recognising a clear Mendelian model of inheritance: for example, generally, in the same family several individuals are affected by the same pathology, but this is not attributable to either a dominant model, nor to a recessive one, nor to a sex-linked heredity.
Non-Mendelian complex phenotypes are caused by multiple genetic, but also environmental, factors; for this reason, they are labelled as “multi-factorial” phenotypes. One set of traits that are
particularly difficult to deal with are those that exhibit continuous or metrical variation. For these traits multiple genetic and non-genetic factors contribute to their population-level variability. Therefore, the genetic dissection of complex traits and diseases may require study designs and research protocols that are various and sophisticated2.
Actually, Mendelian and non-Mendelian characteristics can be imagined as the two extremes of a shade of intermediate situations where we can find, for example, genetic heterogeneity (polymorphisms in different genes can cause similar clinical profile), clinical heterogeneity (the same phenotype, with same genotype, can have different features), incomplete penetrance (when the effect of a variant in the DNA is not always manifested) or oligogenic phenotypes (a handful of genes are involved).
The combination of the effects of genetic and environmental factors which augment and diminish a quantitative phenotype or the risk of developing a disease determines a curve of distribution of the phenotype that has a Gaussian trend (figure 2.1). Central values of the distribution represent the most common values for a quantitative trait or a population risk of developing a disease. The left tail of the distribution represents extreme lowest values for the quantitative trait or a lower risk of developing a disease compared with the normal population or, in other words, a situation of protection from the disease.
On the other hand, if one considers the right tail of the distribution, it contains extreme highest values for a quantitative characteristic or an increased risk of developing the disease, therefore it is possible to define a threshold beyond which the disease occurs.
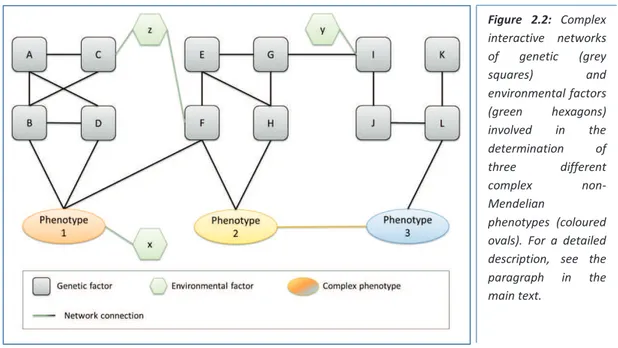
The combinations of factors, genetic and non-genetic, determinant for particular multifactorial phenotypes, can be represented as complex interactive networks, as shown in figure 2.2. It is possible to identify some genes directly connected with the influenced phenotype (B and D and F for Phenotype 1; F and H for Phenotype 2; L for Phenotype 3), as well as gene-gene interactions (A, B, C, D and E, F for Phenotype 1,; E, F, G, H, I for Phenotype 2; I, J, K, L for Phenotype 3). Some environmental factors have a direct influence on the trait (x on Phenotype 1) while others influence phenotypes through gene-environment interactions (z with C and F, y with I). A gene can be involved
Figure 2.1: Gaussian
distribution of a
complex phenotype determined by all influencing (risk and
protective) factors.
On the green line
there are definitions
referred to a
quantitative phenotype; on the pink line there are definitions based on the evaluation of a disease risk.
10 2 | Literature review
in more than one phenotype (F for Phenotype 1 and 2), and a phenotype can have an effect on other traits or diseases (Phenotype 2 on Phenotype 3).
If we consider the only genetic component of susceptibility for a non-Mendelian disease, it has already a notable complexity by itself. The allele frequency of variants that contribute to cause a common disease and the magnitude of their contribution is subject of debate3. In particular, the two main hypotheses proposed in literature are:
· Common Disease/Common Variant (CDCV) hypothesis: on the basis of this theory, the genetic component of a complex disease is constituted by a number of variants with low penetrance, any of which is rather frequent in the control population (minor allele frequency, MAF ≥ 5%). Simultaneous combination of multiple risk alleles at these variants leads to a greater susceptibility to the disease.
· Common Disease/Rare Variant (CDRV) hypothesis: this theory says that a complex disease is genetically determined by several low frequency (MAF < 5%) variants with bigger effects compared to those of common variants.
There is evidence from the literature of studies in favour of both theories; however none of these studies clarified what is the exact allele-frequency spectrum of risk variants involved, the effect size at any disease gene, and hence the total number of risk alleles3.
Nowadays, different approaches for genetic studies demonstrated that complex diseases cannot be explained by a small number of rare variants with large effects, but neither by a limited number of common variants of moderate effect. Thus, the most accepted hypothesis is a “unifying” one, where variants with all combinations of allele frequency and strength of genetic effect, as represented in figure 2.3, contribute to the genetic susceptibility of a particular phenotype4.
Defining the genetic architecture of a trait or disease means to define its biological and physiological
Figure 2.2: Complex interactive networks of genetic (grey squares) and environmental factors (green hexagons) involved in the determination of three different complex non-Mendelian phenotypes (coloured ovals). For a detailed description, see the
paragraph in the
characterisation of effects of single genes, of functional gene-gene interactions, and of possible influence of environmental factors. An articulate genetic architecture is peculiar for complex common phenotypes and its resolution, reconstructing the molecular and physiological mechanisms involved, has as the final aim the translation of the findings into clinical practice, for achieving better diagnosis and prevention and for the development of more specific treatments. There are two main ways through which such translation might be undertaken: in the first, identification of novel causal pathways might lead to the characterisation of novel therapeutic targets and/or novel therapeutic agents for treatment and prevention. Another positive outcome is the discovery of biomarkers, allowing improved disease prediction and monitoring of disease progression and treatment response5. The second translational route considers using the knowledge of individual patterns of disease predisposition (for example, through genetic profiling) to develop more specialised approaches to disease treatment5.
One widely discussed point is the exact definition of “causal variant” for a disease or a trait. Mutations that directly contribute to a particular quantitative trait, or to an increased or decreased risk of developing a disease, are associated with other variants in the genome through linkage disequilibrium (LD): LD is the non-random association between alleles at different positions in the DNA sequence, and is created by evolutionary forces such as mutation, drift, and selection, but it is broken down by recombination3. Therefore, it is possible that a genotyped variant, robustly associated with a disease in multiple samples, is not directly causative in risk predisposition, but instead, it is just a mutation lying sufficiently near the causal variant and in LD with it. A ‘‘causal variant’’, in fact, is a variant that has a direct functional effect on disease risk, rather than a variant that is associated with disease risk through LD; hence, it is the variant that causes the observed association signal3. It is important to keep in mind this concept when researching genetic variants in association with phenotypes, and to remember that, when a polymorphism is detected as significantly associated with a disease, it can be just a “tag” of a causal mutation, and not the causal mutation itself.
Figure 2.3: Possible
combinations of
frequency and genetic
effect for genetic
variants of
susceptibility. The
majority of published
genetic studies for
human traits aims in identifying associations with the characteristics shown within diagonal
dotted lines. From
12 2 | Literature review
Gene mapping through linkage analysis relies on the co-segregation of causal variants with tag polymorphisms (also called “markers”) within pedigrees. Because the number of recombination events per meiosis is relatively small, tagging a causal variant requires only a few genetic markers per chromosome3. The use of linkage analysis to map genomic loci -specific locations in the DNA of genes, groups of genes, or specific sequences on chromosomes - that have an effect on diseases, or on other traits, have been ubiquitous in the last two decades, and they have been extremely successful for Mendelian phenotypes, but much less so for common diseases and, in particular, in the identification of the underlying causative mutations.
The most widely used method for studying the genetic component of complex traits and diseases is association analysis, which aims to identify genetic variants that are statistically correlated with a phenotype in a population-based sample, without distinguishing between real causal variants and those in LD with the causative ones.
In particular, in the context of association analysis, the genome-wide association study (GWAS) approach has been an important advance compared to “candidate gene” studies, in which sample sizes are generally smaller, and the assayed variants are limited to a selected few, often based on imperfect understanding of biological pathways, and often yielding associations that are difficult to replicate.
Genome-Wide Association Studies (GWASs) are based upon the principle of LD at the population level: thanks to the ability of accurately genotyping hundreds of thousands of single-nucleotide polymorphisms (SNPs) in an automated and affordable manner and to the knowledge of the correlation (LD) structure of those markers in the human genome, these studies enable the analysis of a list of tag SNPs that capture most of the common genomic variation in a number of human populations in association with phenotypes of interest, avoiding the bias of prior biological knowledge (or prior beliefs), and of knowledge of genomic location.
Commercial companies produce dense SNP arrays or “SNP chips” that could genotype many markers in a single assay, capturing most, although not all, common variation in the genome. The technological advances together with bio-banks of either population cohorts or case-control samples, have facilitated the ability to conduct GWASs3.
The underlying rationale for GWAS is the CDCV hypothesis: in fact SNPs that lie on the majority of SNP chips have been selected to be common (most of them have a minor allele frequency > 5%). During the past seven years, GWASs have identified more than 8,500 confirmed associations with more than 350 human complex traits and diseases6. Published GWASs can be found at the National Cancer Institute (NCI)-National Human Genome Research Institute (NHGRI)’s catalog (http://www.genome.gov/gwastudies/, figure 2.4)7. These findings have considerably surpassed early expectations, reproducibly identifying hundreds of variants associated with many dozens of traits, and providing valuable insights into the genetic architecture of complex human disease. Despite the great success of GWASs, we are still far from full comprehension of all the mechanisms behind most common human phenotypes and several challenges underlie limitations of this kind of studies taken alone:
· Follow-up studies are not always able to replicate the discoveries of a previous GWAS. · For most of the studied phenotypes, discovered variants explain only a fraction of observed
familial aggregation.
· The patterns of association observed in GWAS at individual risk-loci are highly variable. · Allelic heterogeneity is often observed for associations within and between phenotypes. · GWAS discoveries minimally help in clarification of biological and pathophysiological
mechanisms underlying particular phenotypes.
However, at the present, there is little consensus about the best approaches and priorities for the research of these “dark matter” aspects of GWASs8.
Manolio and colleagues proposed a list of steps to help GWASs in clarifying different aspects of this “dark matter”8:
Figure 2.4: Published Genome-Wide Associations through 12/2012 at p-value of significance ≤ 5x10⁻⁸ for each chromosome, for 17 trait categories as they are reported in the legend below. From NHGRI GWA Catalog7: www.genome.gov/GWAStudies.
14 2 | Literature review
· Carefully plan the samples to use for the analyses: ensure the ancestry and other possible forms of population structure; choose carefully the individuals for follow-up analyses. · Increase sample size, for instance thorough meta- and mega-analyses of comparable data: in
association studies, in fact, the number of discovered variants is strongly correlated with experimental sample size, and an ever-increasing discovery sample size is expected to increase the number of discovered variants.
· Possibly expand the studies to non-European samples. · Enhance the investigation of the X and Y chromosome.
· Expand the study to rare variants and copy number variants (CNVs): much of the speculation about missing heritability from GWAS has been attributed to the contribution of variants of low minor allele frequency, defined as roughly 0.5% < MAF <5%, or rare variants (MAF < 0.5%); on the other hand structural variation, including CNVs may contribute to the genetic basis of human traits and disorders8.
· Investigate gene-gene and gene-environment interactions, including dominance and epistasis, since the detection or characterization of any one of the relevant genetic factors might be obscured or confounded by the influence of others.
· Improve phenotypes by expanding to subtypes, or to more quantitative ones, or to more precise ones.
· Explore multi-phenotype effects: there are thousands of quantitative or qualitative traits in a complex organism, such as the human, but the number of genes is limited (in the human genome it is only around 30,000) and therefore a single gene can simultaneously influence multiple characteristics. Considering this may help in the detection of processes that elucidate part of the missing heritability because some loci may be detectable only by analysing combination of multiple effects on combined phenotypes.
The study of multiple phenotypes simultaneously is becoming more and more relevant: the concept of “omics” is in fact gaining enormous importance. Both, clinical and molecular, phenotypes can be measured and analysed as part of metabolome, transcriptome, proteome, or other groups of “omics” phenotypes (phenome) for a wide spectrum of diseases and quantitative traits. Furthermore, systematic and “phenome-wide” association studies (PheWASs), in which a SNP with an established association with a phenotype is tested for association with hundreds of other phenotypes, have just been published6. An example of such an effort is the Population Architecture using Genomics and Epidemiology (PAGE) network, a large-scale collaboration that started in 2011 for harmonizing phenotypes characterisation and for conducting PheWASs on replicated GWAS hits across eight epidemiological studies and five ethnic groups9. Other efforts aim to analyse a broad range of phenotypes extracted from electronic medical records.
These new sampling and analysis strategies create a need for appropriate methodology for the identification of associations between genetic markers and combinations of multiple traits and diseases which denote causal relationships between them, and ultimately help in elucidating the underlying biological processes10.
2.1.2 Cross-Phenotype association and definition of pleiotropy
As cited above, GWASs have identified hundreds of variants associated with a wide variety of complex human phenotypes. Interestingly, many genetic loci appear to harbour variants that are associated with multiple, sometimes seemingly distinct, traits or disorders. We will term such associations as “Cross-Phenotype (CP) associations” as proposed by Nadia Solovieff and colleagues in their review6, or as “multi-phenotype effects”. Evidence of CP associations also comes from less recent discoveries for genetic studies, described below.
The most striking examples of CP effects are in monogenic syndromes. For example, the Pallister– Hall syndrome is caused by a mutation in a single gene encoding the transcription factor Glioma-Associated Oncogene Family Zinc Finger 3 (GLI3), but it manifests with a wide range of symptoms that include extra digits, webbing between digits, shortened limbs, structural abnormalities in the central nervous system, and kidney abnormalities11. This is because GLI3 acts as a transcription factor in several organ systems during foetal development.
Twin and family studies have also provided evidence for genetic correlations among diseases6. For example a bivariate twin analysis conducted by Kendler and colleagues in 1992 revealed that genetic factors were completely shared between major depression and generalized anxiety disorder12. Another example was reported by Criswell et al. on behalf of the multiple autoimmune disease genetics consortium (MADGC) in 2005; by studying 265 families, they discovered that a functional SNP in the intracellular tyrosine phosphatase gene (PTPN22) confers risk of four separate autoimmune disorders: type 1 diabetes, rheumatoid arthritis, systemic lupus erythematosus, and Hashimoto thyroiditis13.
Association studies and, especially, GWASs have suggested numerous CP effects. For example a SNP on chromosome 8q24 demonstrated association with both prostate14 and colorectal cancer15. Other examples are not only for single SNPs, but also for gene regions; this is the case of the fat mass and obesity associated (FTO) locus, where different variants have been associated with body mass index (BMI)16, melanoma17, fasting insulin18 and T2D19.
A recent evaluation of genome-wide-significant SNPs listed in the National Human Genome Research Institute (NHGRI)’s catalog found that 4.6% of SNPs, and 16.9% of genes known to be associated to physiological or disease traits, have CP effects20. These numbers can be underestimated because of many reasons: for example, many human phenotypes have not been extensively studied yet and therefore their associated variants and genes are not known; then, not all genes involved in the determination of studied phenotypes are known; in addition, it can happen that several SNPs distinctly identified as associated with different traits or diseases may underlie a common causal variant that is shared between phenotypes.
GWASs and other genomic analyses have also identified rare structural variants, such as rare CNVs, with CP effects. For example, multiple CNVs across the genome have been demonstrated to be associated with a variety of neurodevelopmental disorders21.
16 2 | Literature review
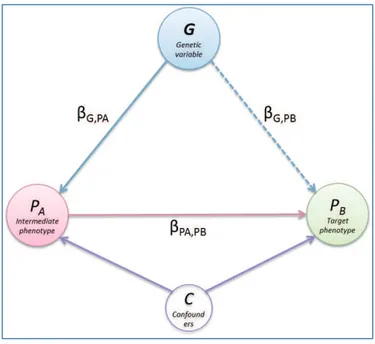
CP associations highlight that phenotypes share common underlying genetic pathways. However it is important to be cautious with the inference of their causes and to not wrongly label them as “pleiotropic” effects. In fact, we define that a CP association occurs when a genetic locus is associated with more than one trait, regardless of the underlying cause for the observed association. Pleiotropy, instead, underlies a specific mechanism that leads to multiple effects. There are several potential genetic mechanisms that can explain loci showing overlapping associations for multiple traits, and pleiotropy is just one of the possibilities6; we distinguish three main mechanisms of CP effects (figure 2.5):
· Pleiotropy occurs when the same genetic causal element affects more than one phenotype.
It can appear at the single variant level, where a single causal variant is related to multiple phenotypes (figure 2.5a or 2.5d), or at a locus level, that is when multiple variants in the same gene or locus are associated with different phenotypes by affecting the same functional element (figure 2.5g)6. The functional mechanism behind pleiotropy can be related to a gene product that is used by different tissues or cell types, or that is targeted to different signalling receptors. In general, we will refer to pleiotropy as occurring when a genetic variant or a set of variants in LD that constitute a functional unit, are independently associated with more than one phenotype, upon reciprocal conditioning on each phenotype in single-trait (or disease) analyses preserves the association signal at the other. Therefore we can say that multiple associations occur “in parallel”22.
· Mediation or mediated pleiotropy occurs when a genetic variant is directly associated with
a phenotype and that phenotype is itself causal for a second phenotype (figure 2.5b) or more phenotypes (figure 2.5e)6. In other words, the multi- trait association is “in series”. This mechanism includes also cases of pathophysiological change from healthy variation to disease.
· Multi-phenotype Allelic Heterogeneity is a phenomenon which involves independent
uncorrelated variants at the same locus which cause changes in multiple phenotypes. It can be determined by two causal variants lying in different adjacent genes (figure 2.5c) or around the same gene locus, but affecting the two phenotypes through independent paths underlied by distinct functional elements of the same locus (figure 2.5f).
Other phenomena can bias multi-phenotype analyses, leading to an erroneous identification of CP associations. For example, an ascertainment bias can occur when the recruitment of individuals with one phenotype increases the prevalence of a second, unrelated phenotype in the cohort6, and this is common in clinical samples, as patients suffering from two conditions are likely to seek treatment more often than those suffering from only one. Since unaffected control individuals are often shared across multiple studies, a biased CP association could also occur if an artefact (such as population stratification or batch effects) is present in the shared controls. Furthermore false CP effects can also be identified when subjects with a particular phenotype are systematically misclassified with a different one, as occurs for some behavioural disorders: for example patients with schizophrenia are
sometimes misdiagnosed as affected by bipolar disorder and vice versa6.
The interpretation of CP effects is not simple, but understanding the real mechanisms behind a CP effect is important, since the identification and characterisation of real pleiotropic mechanisms is crucial for a comprehensive biological understanding of complex traits and disease states, enabling better reconstruction of GPM6.
The impact of genetic studies of pleiotropy for common complex human diseases has been widely recognised and described. However, until now, it has not received sufficient attention, and few multi-phenotype analyses of empirical datasets have been undertaken. Recently, the idea of
Figure 2.5: Different mechanisms which determine overlapping associations for multiple traits. a., d. and g. represent real pleiotropic effects; b. and e. represent mediated effects; finally, c. and f. represent multi-trait allelic heterogeneity.
18 2 | Literature review
extending observations of CP effects, by considering a wider range of phenotypes (as described in the chapter above), is emerging. These multi-phenotype analysis approaches will improve our understanding of the extent of shared genetics between traits and diseases, and our global understanding of phenotypes as a range of inter-related manifestations of biological mechanisms, and not as isolated events6,20.
An understanding of pleiotropic effects is of key importance for drug development too: for example, statins inhibit 3-Hydroxy-3-Methylglutaryl-CoA (HMG-CoA) reductase, but they also have multiple other molecular actions with effects beyond cholesterol reduction, and this has been proposed as the cause for their efficacy in the reduction of cardiovascular outcomes. If a gene has opposing effects on different common diseases, this is likely to greatly complicate drug development and marketing. However, at the same time, knowledge of pleiotropic associations could help to improve drug efficacy and predict side effects.
Furthermore, gaining insight into the level of genetic connectivity between different phenotypes will provide an opportunity to rethink current classification/categorisation of diseases by considering distinctions based on different genetic determinants or whether genetic similarities traverse current divisions20.
These issues are likely to gain in importance as the full extent of pleiotropy in the genome becomes clear.
2.1.3 History of Pleiotropy definition
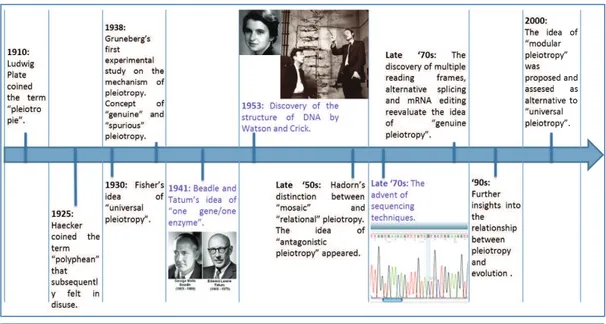
Pleiotropy is a concept that has evolved over time, also following the advent of ever more modern techniques for the study of DNA sequences, and pathological and physiological molecular mechanisms; in this section we will retrace the chronological history of definitions and concepts related to pleiotropy (for a synthesis see figure 2.6), placing them in the context of historical discoveries in genetics and molecular biology. In the following section (2.1.4_Insights into the definition of pleiotropy) we will deepen the concepts cited in this chapter.
The first time that the term “pleiotropy” was used in a published manuscript was in 1910, when the German geneticist Ludwig Plate used it to indicate some distinct phenotypes that were explicable only through the mechanism of a single gene:
“I call a unit of inheritance pleiotropic if several characteristics are dependent upon it; these characteristics will then always appear together and may thus appear correlated”.
“The more research into Mendelian factors advances, the more examples become known which
can be explained only under the assumption of pleiotropy”23.
In 1925, Haecker described the same mechanism under the name “polyphean”, but “pleiotropy” had received more attention and became established in the literature24,25.
locus has the potential to affect almost all traits26. This idea was then reclaimed and upgraded by Wright and Mayr27 in 1963.
Gruneberg published an article in 1938 about the study of rat developmental genetics and, in particular, about skeletal abnormality. From his experiments, he firstly deduced a theory on the mechanism of pleiotropy: he designed the division of pleiotropy into “genuine” and “spurious”. Genuine pleiotropy was characterised by two distinct primary products, each arising from a single locus. Spurious pleiotropy indicated, instead, two possible mechanisms: a single primary product that was utilised in different ways, or a primary product that initiated a cascade of events with different consequences for the phenotype25. This was the first definition of what we call today “type I” and “type II” pleiotropy1; but in 1941, Beadle and Tatum proposed their idea of “one gene/one enzyme”, that is a single gene codes for a single protein28, leaving no room for mechanisms of genuine pleiotropy25.
In the late ‘50s, after the discovery of the structure of DNA by Watson and Crick, other classifications of pleiotropy were defined based on insights in the ways a single gene product could have multiple uses. Richard Ernst Hadorn made a useful distinction between two types of pleiotropy that were defined as “mosaic” and “relational”: mosaic pleiotropy denotes instances where a single locus directly affects two phenotypes; relational pleiotropy describes the action of a single locus that initiates a cascade of events impacting multiple independent phenotypes29. These two definitions better describe the two possible mechanisms of spurious pleiotropy hypothesised by Gruneberg. Additionally, it was in those years that the idea of “antagonistic pleiotropy” started to be viewed as a well-known application of pleiotropy in evolution and medicine. In particular, Williams suggested that genes with antagonistic effects at different life stages could contribute to aging in a way that natural selection could not alter: genes that are beneficial prior to reproduction, but negative after
20 2 | Literature review
reproduction, would be favoured by natural selection over those that increase longevity, but which are less favourable to reproduction and survival to reproductive age30. This concept will be explained better below.
The advent of sequencing techniques in the late ‘70s demonstrated that a single locus can produce different primary products at all levels of gene expression and protein processing, for example due to multiple or overlapping reading frames (a strand could be read starting at different points producing different mRNAs and, thus, different proteins from the same single locus)31, or due to alternative splicing and alternate start/stop codons32, or to mRNA editing in different tissues and with differential expression33. These discoveries gave plausibility back to Gruneberg’s idea of “genuine pleiotropy” (or type I) as a possible molecular pleiotropic mechanism.
After the stabilisation of the “antagonistic pleiotropy” concept, the relationship between pleiotropy and evolution was further explored in the ‘90s. In particular, Waxman and Peck (1998) proposed a theory about the maintenance of pleiotropy, which asserts that pleiotropic traits under stabilising selection are more likely to reach an optimum genetic sequence. This suggests that pleiotropic phenotypes are more likely to be favoured by natural selection34,35.
In 2000, departing from Fisher’s concept of universal pleiotropy, Orr elaborated the “cost of complexity” theory36, but also the contrasting view about the extent of pleiotropy, and its consequent implications in evolution, has emerged more recently. Following on from Welch and Waxman’s idea, organisms can be broken up into modules, and pleiotropy is restricted to the action within these modules37. Several recent studies have tried to asses if pleiotropy is more universal or more modular, and their conclusion is that modular pleiotropy is more likely to represent reality38-42.
2.1.4 Insights into the definition of pleiotropy
2.1.4.1 Other types of pleiotropyThe above mentioned definitions of possible mechanisms of multi-phenotype effects which explain CP associations are not the only ones proposed. Several researchers or research groups have tried to order and define multi-phenotype genetic effects1,25,35.
Hodgking for example, defined seven different types of “pleiotropic effects”35:
· Artefactual pleiotropy: when adjacent but functionally unrelated genes are affected by the same mutation;
· Secondary pleiotropy: when a simple primary biochemical disorder leads to a complex final phenotype (similar to “mediation”);
· Adoptive pleiotropy: one gene product is used for quite different chemical purposes in different tissues;
multiple pathways;
· Opportunistic pleiotropy: arises when one gene product plays a secondary role in addition to its main function;
· Combinatorial pleiotropy: when one gene product is employed in various ways, and with distinct properties, depending on its different protein partners;
· Unifying pleiotropy: one gene, or cluster of adjacent genes, encodes multiple chemical activities that support a common biological function35.
This classification is rather complicated, and Hodgking’s definitions are not always easily discernible from each other.
From the point of view of the molecular basis of a pleiotropic phenomenon, Hans Gruneberg had already, in 1938, distinguished two main mechanisms of pleiotropy: “genuine” and “spurious” pleiotropy (already defined above)25.
Wagner and Zhang reconsidered Gruneberg’s definitions by defining “type I” and “type II” pleiotropy. Type I pleiotropy occurs when a gene product has multiple molecular functions; an example is the human serum albumin that maintains osmotic pressure in body tissues, but is also a plasma carrier for hydrophobic steroid hormones, a transport protein for haemin and fatty acids, and participates to the oxidation of nitric oxide1,43. Type II pleiotropy is, instead, characterised by a singular molecular function with multiple consequences, for example glutamine amidotransferase in yeast, which acts through its function of removal of the ammonia group from a glutamine molecule in both histidine biosynthesis and purine nucleotide monophosphate biosynthesis1,43.
From a study about the relationship between yeast gene pleiotropy and gene function, He and Zhang discovered that, at a genome-wide level, gene pleiotropy is generally represented by a singular molecular function in multiple biological processes, since part of gene products is distributed into multiple cellular components or contributes to multiple protein-protein interactions. This discovery has not to be taken as a rule because it was found only in yeast: in fact, yeast genes do not undergo alternative splicing, and therefore we do not know if this mechanism can importantly contribute to pleiotropy in species with prominent alternative splicing; similarly we cannot estimate the contribution of pleiotropy that arises from gene expression in multiple tissues of a multicellular organism. Anyway, it is important to highlight that this study found no correlation between pleiotropy and the number of different molecular functions43.
2.1.4.2 The extent of pleiotropy and its relationship with evolutionary processes
Another important point of discussion is the extent of pleiotropy in relation to different phenotypic characters: due to its importance in biology, several mathematical models of pleiotropy have been developed, and important theoretical results have been derived from the analyses of these models. The oldest hypothesis about the extent of pleiotropy is the “universal pleiotropy theory”, proposed by Fisher as part of his geometric model: every mutation affects every trait, and the effect size of mutations on a trait is uniformly distributed26.
22 2 | Literature review
The main alternative hypothesis is that of “modular pleiotropy”, which is equally important because of a number of theories about development and evolution derived from it37: gene–phenotype relationships can be represented by a bipartite network of genes and traits. where a link between gene nodes and phenotype nodes indicates that the gene affects the phenotype; modular pleiotropy is based on the definition of modules, which include limited number of genes and phenotypes, and refers to the phenomenon where links within a particular module are significantly more frequent than those across modules (figure 2.7)42.
Another proposed thesis is that of “rare pleiotropy” - where pleiotropic effects are attributable only to a few genes, and affect a very limited number of traits or disorders- but it has found little support in the literature. On the basis of Fisher’s geometric model (FGM), and the assumption that the total effect size of a mutation is constant in different organisms, Orr derived the so-called “cost of complexity” hypothesis: if the “universal pleiotropy” theory is true, the more traits that are observed in an organism (more complexity), the more of its genes are pleiotropic (as every gene affects all traits); complex organisms then are inherently less evolvable or adaptable to changing environments than simple organisms, because their mutations are more likely to be subject to the action of purifying selection36.
In other words, both the fixation probability of a beneficial mutation, and the fitness gain that is conferred by the fixation of the beneficial mutation, decrease with organismal complexity because there are more possibilities that that the beneficial mutation for a particular phenotype is deleterious in its effect on another phenotype1,42.
“The conformity of these statistical requirements with common experience will be perceived by comparison with the mechanical adaptation of an instrument, such as the microscope, when adjusted for distinct vision. If we imagine a derangement of the system by moving a little each of the lenses, either longitudinally or transversely, or by twisting through an angle, by altering the refractive index and transparency of the different components, or the curvature, or the polish of the interfaces, it is sufficiently obvious that any large derangement will have a very small
probability of improving the adjustment...”26
The modularity reduces the probability that a random mutation is deleterious, because that mutation will affect just a set of related traits, rather than all traits. Moreover, Wang et al. found a greater per-trait effect size for pleiotropic mutations in more complex organisms with consequent greater probability of fixation, and a larger amount of fitness gain when a beneficial mutation occurs; through this mechanism, pleiotropy may promote the evolution of complexity. Together, these two reflections lead to the conclusion that organisms of intermediate levels of effective complexity have greater adaptation rates than organisms of lower levels, and explain why complex organisms could have evolved, despite the cost of complexity42.
Figure 2.7: Visual explanation of “modular pleiotropy” theory from Wang et al. 201042. Genes are blue hexagons on the left; phenotypes are violet squares on the right.
From the literature, we can say that the model of universal pleiotropy is not empirically supported. For example, in 2008, Quantitative Trait Loci (QTLs) underlying a set of traits that represented all major subsystems of the bony skeleton were mapped in inbred mice with increased or reduced body size and, on a total of 102 QTLs identified for 70 traits, the median degree of pleiotropy was only six traits, or 8.6% of the traits examined38.
Similar work on 54 body-shape traits in sticklebacks identified approximately an average number of 3.5 traits affected by single QTL39.
Li and colleagues, in 2006, analysed the protein interaction networks of Saccharomyces cerevisiae,
Drosophila melanogaster, and Caenorhabditis elegans, addressing several aspects of network
properties. They determined that each gene in the three genomes affects, on average, four or five proteins41.
In 2010, Su, Zheng and Gu were able to estimate the number of traits affected by each gene in their sample of 321 genes from eight vertebrate species by using comparative data from protein sequence and microarray analysis, in conjunction with mathematical modelling: they found that the number of traits affected per gene was about six to seven40.
Additionally, in a genome-wide analysis of pleiotropy in yeast (Saccharomyces cerevisiae), nematode worm (Caenorhabditis elegans), and mouse (Mus musculus), Wang and colleagues robustly revealed a generally low level of pleiotropy for most genes, and a pleiotropic structure that is highly modular, with an average of 4.6 trait associations per gene, and larger per trait phenotypic effects of those genes affecting more traits42.
Therefore, the conclusion from current studies is that pleiotropic effects per gene involve a limited number of phenotypes. Consequently, previous estimates from evolutionary theory of the cost of complexity are flawed, since their basic assumptions are not empirically supported1.
It is largely thought that pleiotropy causes compromises among adaptations of different phenotypes, on the basis that a genetic change beneficial to one phenotype may also be deleterious to another. This property should underlie many fundamental principles and phenomena in biology, including senescence, trade-off, and cooperation43.
The most popular form to express this idea is the antagonistic pleiotropy theory of senescence: it asserts that mutant genes, advantageous to development and reproduction, are deleterious after the reproductive age and cause senescence; this may explain why all species have a limited life span (Williams 1957). An example that supports this theory is represented by an experiment conducted on social amoeba Dictyostelium discoideum: this organism can aggregate during starvation where some cells die to form a stalk that holds the other cells aloft as reproductive spores; deleting the gene dimA in D. discoideum allows cells to avoid death, but leads to a great reduction in spore production and, therefore, in reproduction39. Hence, dimA has a pleiotropic effect that stabilises the cooperation among amoeba43.
24 2 | Literature review
2.1.4.3 Features of pleiotropic genes
We have already cited a review by Sivakumaran and colleagues who found that pleiotropy is a property of only 17% of genes and 5% of SNPs that are known to be associated with diseases or disease-related traits in humans, and that these are likely to be lower-bound estimates20 .
It has also been demonstrated that pleiotropic genes are longer than non-pleiotropic ones: an effect that might be caused by: firstly, the fact that longer genes might encode an increased number of protein structural domains which might give rise to multiple functions; and secondly, longer genes usually contain more variants with a concomitant rise in the opportunity for some to be involved in different functions20.
Moreover, it seems more probable that pleiotropic SNPs are mostly exonic and structurally functional than non-pleiotropic SNPs. As yet, no data support the hypothesis that pleiotropic SNPs would be more likely to be present in regulatory regions20.
From an evolutionary perspective, highly pleiotropic genes are expected to be under stronger stabilising selection because they affect multiple traits, and thus are less likely to experience beneficial mutations as a result of the interwoven web of genetic and physiological interactions that are involved in development and function35. To this end, the genome-wide study by He and Zhang, published in 2006, found that, testing 21 different phenotypes, the 39.5 ± 0.8% of no-effect yeast genes have homologs in the fruit fly D. melanogaster, and that this proportion increases if we consider pleiotropic genes: 49.2 ± 2.3% of genes with effects on one or two phenotypes, and 54.7 ± 3.6% of high pleiotropic genes (with multiple effects on more than two phenotypes) have fruit fly homologs. Similarly, 52.6±2.7% of pleiotropic yeast genes have detectable homologs in the nematode C. elegans, in comparison to 38.3±1.1% of no-effect genes. In the same study, when the fungus S. pombe is compared, 71.7±3.3% of pleiotropic yeast genes have detectable homologs, in comparison to 58.4±1.3% of no-effect ones. These findings were all significant, and supported the idea that pleiotropy leads to the evolutionary conservation of genes and gene sequences43.
2.2 State of the art in the study of pleiotropic effects
2.2.1 General introduction
One of the major limitations of association studies and GWASs is that they have tended to focus on single phenotypes through “univariate” analyses.
The complexity in the overlap of associations for different phenotypes observed within univariate analyses might be due to several underlying factors: (i) the power of genetic analyses can change based on the differences in the magnitude of the observed effects for common signals and differences in sample sizes; (ii) on the other hand, heterogeneity increases when larger number of studies is included to maximise the sample size of the meta-analysis, and this has a detrimental effect on power; (iii) sometimes there is a non-genetic component of observed phenotypic correlations, for instance due to epigenetic effects or environmental impact; (iv) moreover, a limited knowledge of the functional physiological role of associated loci, with an impact on different groups of phenotypes, may lead to a misunderstanding of the relationships between traits and diseases. Over the last few years, it became clear that it is important to dissect the majority of the phenotypic and, to this aim, sampled cohorts have been surveyed with a large number of traits, hundreds of clinical phenotypes, and genome-wide profiling of gene expression, many of which are correlated10. The inability to properly dissect this kind of data, due to the absence of appropriate methodology, extensively complicates its analysis and interpretation.
There are two main challenges: the first is to obtain the greatest knowledge from the past and future univariate GWASs, by developing strategies to join together single-phenotype analyses to identify common determinants not yet discovered; the second is to explore methods to analyse a large number of variables at the same time through multivariate analysis. The projects that have been developed during my PhD programme, and that will be described in following sections, concern both these two challenges.
The analysis of multiple phenotypes enhances the ability to estimate both, the number of loci contributing to risk of multiple traits and diseases, and the spectrum of phenotypes that each locus influences, thus clarifying genetic relationships between them.
The biological advantages of performing joint analysis of multiple phenotypes include the ability to address the issue of pleiotropy vs. tight linkage or mediation, and the ability to investigate intermediate endophenotypes, e.g., serum metabolites, as a step toward understanding how biochemical pathways relate to complex traits and disorders44.
A variety of different approaches have been proposed in the last few years to test the relationship of genes with multiple phenotypes. These approaches are based on different statistics, some of which were applied to linkage studies, and others to case-control studies (see table 2.1 for a summary of reviewed methods).
Based on the reasoning described above, these methods can be broadly classified into two main groups: univariate analyses and multivariate analyses.
26 2 | Literature review
Within all proposed approaches, It is not possible to define a uniformly most powerful test, because the most suitable method depends on the circumstances and on the available data6.
Another important aspect to highlight is that the majority of proposed methods are able to detect co-association with multiple traits, that is CP effects, but this does not mean that they represent real pleiotropy.
In some cases, in fact, the same variants show association with multiple traits, but in other cases, although the same overall region is implicated, distinct nearby markers show signals of association with different traits: in this situation, it becomes fundamental to be able to distinguish the associations that represent genuinely shared effects of single variants from those that represent the effects of co-localising, but independent variants (multi-trait allelic heterogeneity, see figure 2.5)6. Equally important, although more difficult, it is to distinguish real pleiotropy from mediation (where the association of a genetic locus with more than one trait is due to a real association with only one of them and then to an influence of the gene-associated phenotype on the others).
An important issue to deal with, when you begin to plan a multi-phenotype association analysis, is whether the effects of a gene on correlated traits can be counted as independent contributions to the degree of pleiotropy. In other words, it is the problem of identifying the basic building blocks of the phenotype.
Just to give an example, a question can be: “are the depth and the width of a bird beak really two different characters?”1. Maybe the beak depth and width are two different measures of the same thing, and any mutation that affects both really has only one effect.
In fact, different phenotypes can be substantially correlated, and some correlation might be due to shared genetic covariance. A detected genetic association for one phenotype might reflect associations with other correlated phenotypes, in the sense that some genetic effects are partly or totally explained through an association with the other phenotype45.
In addition, as a gene variant might be truly associated with two or more different correlated phenotypes, other genes could also have clear pleiotropic effects on phenotypes that are apparently clinically uncorrelated45.
In general, ignoring phenotype correlations and relationships leads to an upward bias in estimates of pleiotropy.
This problem can be addressed, for example, by calculating and evaluating the degree of correlation between traits, and by detecting an “effective” number of phenotypes before running the analyses. Another empirical approach to estimate if two phenotypes are independent is to evaluate the presence of mutations that dissociates them, meaning for instance that a mutation affects one phenotype but not the other, or that a mutation has same directional effects on the two phenotypes and another has opposite effects1.
2.2.2 Methods for studying cross-phenotype effects
2.2.2.1 Multiple univariate analysesA possible strategy to detect and study CP effects is to combine results from standard univariate analyses, such as linkage analyses or association analyses (for example GWASs), across various
Table 2.1: Summary of proposed approaches for the study of the relationship of genes with multiple phenotypes.
Method Linkage or association studies Based on p-values or effects
Allows for effect heterogeneity Types of phenotype Accomodate overlapping subjects Identification of subsets of associated phenotypes Variants or region identification Reference
Simple comparison Both
Both, primarly
p-value Yes Any Yes
Two traits per
time Both 46
Fisher's omnibus test Both P-value Yes Any No No Variants 49
CPMA Association P-value Yes Any No No Variants 50
Fixed-effects MA Association Effect No Same No No Variants 45,48
Random-effects MA Association Effect
Yes, not opposite
effects Same No No Variants 45,48
Subset-based MA Association Effect Yes Same
Offer extension to
do it Yes Variants 51
Extensions to O'Brien Both Effect Yes Any Yes, only No Variants 52,53
TATES Association P-value Yes Any Yes, only No Variants 54
PRIMe Association P-value Yes Any Yes No Regions 55
Decomposition of covariance matrix Both
A priori
transformation Yes Any Yes, only Yes Variants 56,57
PCA Both
A priori
transformation Yes Any Yes, only Yes Variants 58
CCA Both
A priori
transformation Yes Any Yes, only Yes Variants 61,62
Multivariate linear
regression Both Raw data Yes Quatitative Yes, only
Should test
different models Variants 47,63-67
Multivariate logistic
regression Both Raw data Yes Discrete Yes, only
Should test
different models Variants 44
Log-linear regression Both Raw data Yes Discrete Yes, only
Should test
different models Variants 68
Bayesian model search Association Raw data Yes Discrete Yes, only Yes Variants 69,70
Variance-components method for multipoint
linkage Linkage Raw data Yes Any Yes, only
Should test
different models Variants 71
Variations of GEE Both Raw data Yes Any Yes, only
Should test
different models Variants 72-74
EGEE Association Raw data Yes Any Yes, only
Should test
different models Variants 75
Multiphen Association Raw data Yes Any Yes, only Yes Variants 62
Non-parametric tests Association Raw data Yes Any Yes, only
Should test
different models Variants 76
Graph-based methods Association Raw data Yes Any Yes, only Yes Variants 10
Tree-based methods Association Raw data Yes Any Yes, only Yes Variants 77
Bayesian network
methods Association Raw or
summary data Yes Quantitative Yes, only Yes Variants 78
Polygenic score Association Effect Yes Same No
Two traits per
time None 79
Genetic correlation Both Effect Yes Same No
Two traits per
time None 81
Polygenic approaches Multiple univariate analyses
Dimension reduction techniques
Multivariate analyses
28 2 | Literature review
phenotypes, to identify those variants that are associated with multiple traits6.
In the standard univariate approach, when considering a quantitative phenotype, a linear regression is usually performed for phenotype, Y, on genotype, X. Yi = [Yi1 ,…, YiK] denotes the phenotype data
corresponding to K phenotypes for an individual i and Xi = [Xi1 ,…, XiG] denotes their genotype data at
G SNPs, where, under an additive model, Xig ϵ [0,1,2]. The regression performed at a SNP, g, and a
phenotype, k, to test for association between the SNP genotype and the phenotype, is thus modelled as:
Yik = αk + βgkXig + εigk
where εigk is the residual error assumed to be normally distributed.
The null hypothesis of no association between genotype and phenotype (βgk = 0) can be tested by
performing a t-test or an ANOVA.
Studies that used univariate approaches on different phenotypes, not necessarily measured on the same individuals, may be combined together as described below; therefore it is clear that they are well suited to analysing existing GWAS results, including those already conducted by consortia that, moreover, can be organised into cross-disease groups. These methods are especially important for rare diseases, which are less likely to be ascertained simultaneously in the same cohort studies. Another advantage of univariate approaches is that, unlike multivariate approaches, most of them are based on summary statistics, which do not divulge individual-level data.
Below, several univariate approaches for the detection of CP effects are reported (see also table 2.1). There is not a single most powerful approach, but the appropriate statistical test should be chosen based on study design, the type of phenotypes to be analysed, assumptions on effect heterogeneity (do we expect that the effects have different direction and different sizes on different phenotypes, or not? Can we define a “prior” of the directionality and of the extent of multiple effects?), and other factors6.
Simple comparison of univariate analysis results
The simplest strategy to analyse genetic relationships with multiple phenotypes is to run a separate linkage or association analysis for each phenotype of interest, and to compare the results. Alternatively, the set of genome-wide significant SNPs for one phenotype can be tested for association with other phenotypes; in this case, the advantage is that the significance level for multiple testing is adjusted only for the number of tested SNPs, rather than for all SNPs genome-wide.
An example of a similar approach comes from an “expression quantitative trait loci” (eQTL) association study in mice by Chen et al. where the authors assembled a co-expression network and then applied a clustering algorithm to this network for the identification of subgroups of expressed genes whose members participate in the same molecular pathway or biological process. After that, within each subgroup of expressed genes, a univariate eQTL analysis was performed between genotypes and expression data: if the majority of expressed genes in each subgroup were mapped to a same locus in the genome, that locus was considered to be significantly associated with the subgroup46.
This kind of approach has two main disadvantages: first, it does not take into account the multivariate structure of the data; and second, testing of multiple phenotypes increases the type I