1
Simplified Analytical Models for Compressed Concrete Columns
Confined by FRP and FRCM System
Marinella Fossetti1*, Gioacchino Alotta1, Francesco Basone1, Giuseppe Macaluso1
1
Università degli Studi di Enna “Kore”, Facoltà di Ingegneria e Architettura, Cittadella Universitaria, 94100, Enna (Italy).
*Corresponding author
Marinella Fossetti, Associate Professor, Università degli Studi di Enna “Kore”, Facoltà di Ingegneria e Architettura, Cittadella Universitaria, 94100, Enna (Italy). Email: [email protected].
SUMMARY: In order to consider the response of concrete columns confined by FRP and FRCM system, proper models have to be formulated. In this context the present paper shows a generalized criterion for the determination of the increase in strength, in ductility and in dissipated energy for varying corner radius ratio of the cross section and fiber volumetric ratio. The procedure is based on the best fitting of several experimental data and unlike the usual empirical approaches available in the literature, the proposed technique relates the confinement effectiveness to a single parameter representative of the relative stiffness between the original concrete core and the reinforcement system. Furthermore, the proposed analytical models overcoming the limit of many empirical or semi-empirical models given in the literature that are applicable only to specific cases. A comparison with same available models confirm the reliability of the proposed procedure.
KEYWORDS: Concrete columns; FRP and FRCM jacketing; simplified model; corner radius ratio; fiber volumetric ratio.
2
1
Introduction
In the recent years the need for upgrading existing structures has become increasingly popular. Indeed, an increasingnumber of existing reinforced concrete structures need rehabilitation or strengthening because of improper design or construction, change of the design loads, damage caused by environmental factors or seismic events. One of the most common upgrading techniques involves the use of jackets, which have the aim to increase the deformation capacity of the concrete in critical regions [1]. The use of Fiber-Reinforced Polymers (FRP) has had an increasing popularity in the civil engineering field [2-9] for its favourable material properties: extremely high strength-to-weight ratio, corrosion resistance and ease and speed of application. Structural behavior of FRP jackets has been widely studied on the last decades and some studies have resulted in the first design guidelines of strengthened concrete [10-12]. However, some drawbacks were found: inapplicability on wet surfaces, high costs of epoxy resin and of specialized workers for application, inapplicability at temperatures lower than 10 °C or higher than 30°C.
To overcome this drawbacks, inorganic matrix systems have been introduced as a replacement for the organic systems [13-20]. The use of the fiber textile, in conjunction with the development of new materials for the fiber, is able to ensure an adequate bond between textile and matrix. However, as a consequence of the granularity of the mortar, penetration and impregnation of fiber sheets are very difficult to achieve since mortars cannot wet individual fibers. Despite a lower adherence with fibers, the inorganic matrix has a number of advantages, such as full compatibility with the concrete substrate, applicability on wet surfaces and low costs of application. Although such technique has many advantages and represents a good alternative to FRP jacket, few studies have been conducted on concrete columns with the use of the Fiber Reinforced Concrete Mortar (FRCM) technique and major research has been devoted to the behavior of FRP confined concrete columns.
The combination of fiber and cementitious mortar was initially studied by Triantafillou et al. [15]. The authors compared the behaviour obtained with FRP and FRCM jacketing system of concrete specimens of equal stiffness and strength. Results showed that the use of fiber in combination with cementitious mortars provides a substantial increase in compressive strength and deformation capacity although the same specimens reinforced with FRP system showed a better gain both in terms of strength and
3 deformation. Bournas et al. [16] studied the behaviour of reinforced concrete columns with limited capacity due to buckling of the longitudinal bars, strengthened with both reinforcement techniques. They showed a substantial gain in compressive strength and deformation capacity with a buckling delay of the longitudinal bars. Also in this case a lower effectiveness (about 10%) of FRCM jacketing system respect to FRP case was observed. However, experimental tests carried out on full-scale columns subjected to cyclic uniaxial flexure highlighted the same behavior for both reinforcement techniques.
Generally, the results of earlier research conducted on the FRP and FRCM confined concrete columns suggests that the confinement effectiveness depends on several parameters: concrete strength, type of fiber and resin, fiber volume and orientation, jacket thickness and shape and corner radius of the of cross section. Many research has been devoted to the evaluation of the incidence of this parameters. Wang et al. [7] analyzed the corner radius influence and proved that no confinement is offered by flexible jackets with a zero corner radius. Rochette and Labossière [22] showed that the confinement effect is directly related to the shape of the cross section for a given number of wraps around the column. Yang et al. [23] indicated that a small corner radius can significantly reduce the ultimate strength of the FRP laminate due to the stress concentration around the corner area. Trapko [20] investigated the efficiency of Polypara-phenylene-benzo-bisthiazole (PBO) fiber bidirectional wrapped mesh, with a quantity of fiber in the direction of the wrap four times than those in the direction of the weft, embedded in an inorganic matrix in order to confine concrete cylinders. De Caso y Basolo et al. [18] studied different type of grouts as inorganic matrices along different types of fiber (unidirectional and bidirectional meshes of low-density and high-density glass fiber sheets). They found that the use of low-density glass fiber allowed for more effective fiber impregnation, and was the most effective reinforcement both with acrylic and hydraulic cementitious matrix; higher levels of ultimate strength are reached with the hydraulic base grout and similar levels of ultimate strain are reached in the two cases.
A large number of empirical or semi-empirical models proposed for compressed concrete columns confined by FRP and FRCM jackets has been developed. Most of these models are based on steel confinement, using the approach of Mander et al. [24] to evaluate the ultimate strength of concrete subjected to compression under constant confinement with proper adjustments to overcome the initial hypothesis of constant lateral pressure exerted on concrete. Various confinement models have been
4 calibrated on columns wrapped by FRP and FRCM fiber sheet [15, 19, 25-27] that usually correlate the increase of strength and ultimate strain with the confinement lateral pressure applied by the fiber sheet. Some authors have proposed confinement models where the same mathematical form is adopted for both FRP and FRCM systems but different coefficients are used in the two cases (see e.g. Triantafillou et al. [15] and Di Ludovico et al. [39]). The reliability of such models is linked to a correct definition of the effective confining pressure on the concrete member. In fact, results of several uniaxial compression tests performed on FRP and FRCM wrapped specimens have shown that the ultimate hoop strain reached in the jacket, which the maximum confining pressure depends of, is generally smaller than the ultimate strain found for flat coupon tensile tests [28-36].
In this paper an alternative approach was focused in order to link the seismic demands (strength and ductility increase) with the design parameters of the structural upgrading. Such simplified approach does not require the evaluation of the confining pressure but it wants provide a useful tool for the design of the structural updating to achieve certain strength and ductility values. An update database of compression tests performed on square and circular columns wrapped by FRP and FRCM fibers was assembled from the scientific literature; from this database the parameters of the analytical laws that correlate the seismic demands in terms of strength, ductility and energy absorption and the main design parameters (corner radius, thickness jackets and type of fiber) have been defined. On the basis of this information, two different design approaches have been defined and examples of an upgrade design of columns of existing buildings were carried out.
Finally, a comparison between results obtained with the proposed approach and those obtained by the existing analytical models have been carried out; it is shown that results of the proposed approach are in good agreement with empirical and semi-empirical models availablein literature.
2
Experimental database for columns confined by FRP and FRCM system
In this paper the data from experiments that have been performed on concrete specimens have been taken into account. The specimens have square cross section with dimensionλ or circular cross section with
5 diameter λ; for the square specimens r is the corner radius. All the authors used FRP and/or FRCM reinforcing laminates with unidirectional fiber, in the direction normal to the specimen axis. Only some experimental campaigns in which reinforced specimens have comparable geometric and mechanical characteristics (e.g. square and circular cross section dimension, fiber volumetric ratio, mechanical properties of fibers) have been selected in the following database, in order to define a set of homogenous experimental results. For each paper considered not all the experimental data have been considered to construct the database; this fact is due to different reasons: some specimens have rectangular cross section, while in this paper the attention is focused on square and circular cross sections in order to avoid the introduction of the effect of the proportion between two dimensions of the cross sections; some specimens have steel reinforcement, while in this papers (as in many papers) the attention is focused on not reinforced specimens; in this paper the attention is focused on specimens with a restricted range of the dimensions, in order to avoid that other effects (such as size effect) make difficult the interpretation of results; finally, only experimental results of FRP and FRCM reinforced specimens subjected to monotonic loads are considered in this paper.
In the following ρ = 2r/λ is the corner radius ratio of the cross section. The characteristic values of stress strain curves collected in the database are:
fco, fcc Unconfined and confined maximum compressive stress of specimens;
εcou, εccu Unconfined and confined ultimate axial strain of specimens;
Ec Elastic modulus of the unconfined specimens;
Eo, E Energy absorption capacity of unconfined and confined specimens;
μεo, με Unconfined and confined ductility of specimens.
To estimate the μεo and με values, a ductility ratios of all columns were calculated similarly to Wang and
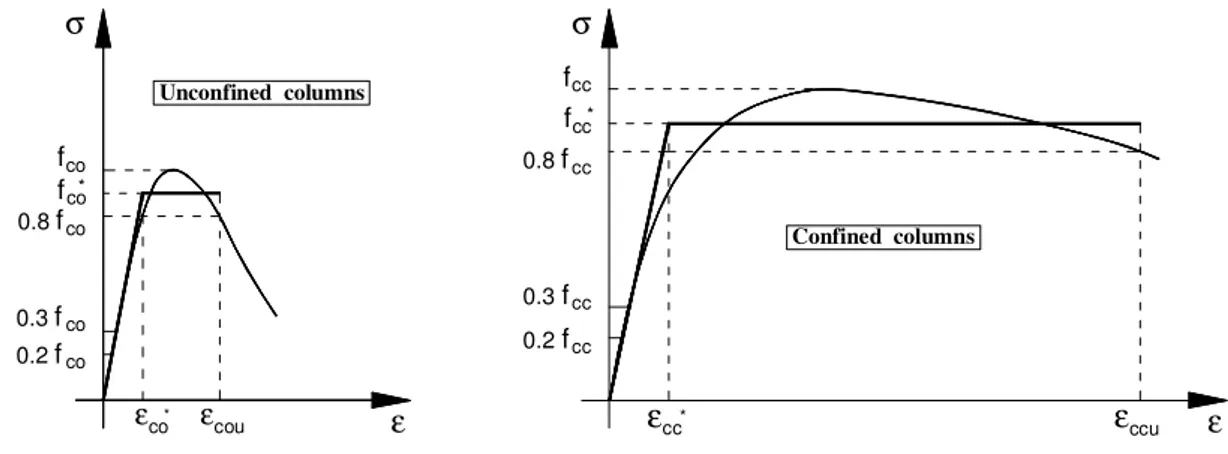
Wu [7]. A bilinear idealization of the stress-strain curves was carried out (Fig. 1) based on the following considerations:
6 2. The areas under the original and idealized curve within the range of interest are approximately equal
(Eq. (1a)).
3. The elastic stiffness of the idealized curve is calculated between 0.20 and 0.30 of the concrete strength.
4. The ultimate strain of the idealized curve is evaluated as the strain at 80 per cent of the concrete strength when the constitutive law presents a softening branch and in correspondence of maximum strength when the column failed at the peak point.
Fig. 1. Definition of the ductility ratio for unconfined and confined columns.
Considering the meanings of fco*, εco*and of fcc*, εcc* as shown in Fig. 1 (stress and strain at the elastic
limit) and expressing εco* and εcc*respectively in terms of fco* and fcc*, by means of Eq. (1a) and Eq. (1b)
it is possible to evaluate the values of fco*and fcc*.
(
)
* * * * co co cou co co o 1 f f E 2 ε + ε − ε = (1a)(
)
* * * * cc cc ccu cc cc 1 f f E 2 ε + ε − ε = (1b)Once fco*and fcc*are evaluated it is possible to calculate the yield displacement εco*, εcc*of the idealized
curves and finally the ductility ratio μεo = εcou /εco* and με = εccu /εcc* for unconfined and confined
specimens.
Details and key results of the tests collected in the database for FRP and FRCM confined columns are shown in the next sections, where the symbols have the followings meanings:
σ fco 0.8 fco εcou 0.3 f 0.2 f co co fco* fcc fcc* 0.8 fcc εcc* εccu 0.3 fcc 0.2 fcc εco* ε σ ε Unconfined columns Confined columns
7
n number of fiber layers;
tf nominal thickness of the reinforcing system;
ρf = 4 n tf / λ fiber volumetric ratio;
Ef elastic modulus of the fibers.
2.1
Columns confined by FRP system
In this section, database has been assembled from the studies of Bournas et al. [16], Karabinis et al. [37], Rousakis et al. [36], Wang and Wu [7] and Wu and Wei [34]. Experimental results have been selected according to the criteria defined above. Key information of the tests are given in Table 1 and Table 2.
Bournas, Lontou, Papanicolaou, Triantafillou (2007)
Bournas et al. [16] studied the behavior of prismatic concrete columns with and without internal reinforcement steel bars wrapped by FRP and FRCM (Textile-Reinforced Mortar – TRM in the original paper) jacketing systems. Specimens had a 200 x 200 mm cross-section representing columns at approximately 2/3 scale. Concrete prisms were wrapped with one and two carbon fiber layers in the longitudinal direction of the specimen. Such tests have shown that TRM jackets provide a substantial gain in compressive strength and deformation capacity by delaying buckling of the longitudinal bars; this gain increases with the volumetric ratio of the jacket. Compared with their FRP counterparts, TRM jackets used in this study was slightly less effective in increasing strength and deformation capacity by approximately 10%. Tests on full-scale columns subjected to cyclic uniaxial flexure showed that TRM jacketing is very effective to increasing the cyclic deformation capacity and the energy dissipation of old RC columns.
Karabinis, Rousakis (2001)
Karabinis et al. [37] investigated the behaviour of concrete columns with cylindrical cross-section subjected to axial monotonic load until their failure. In such experimentation, 22 columns wrapped by carbon FRP sheets with diameter equal to 200 mm was considered for different levels of fiber
8 reinforcement ratios. The authors highlighted that carbon sheets allow to considerably increase the strength and ductility of concrete as well as the energy absorption, even in low volumetric ratios.
Rousakis, Karabinis, Kiousis (2007)
Rousakis et al. [33] studied the behavior of FRP confined specimens subjected to cyclic axial compressive loads. An experimental campaign on 101 prismatic concrete specimens of different strength was carried out. Each specimen had cross-section dimensions of 200 x 200 mm and they were externally confined by carbon and glass FRP sheets. The results indicate that square concrete sections, properly confined by FRP reinforcement, can achieve high levels of strength and ductility. Moreover, it was found that glass FRP is less effective in terms of strength and ductility enhancement when compared with carbon FRP confinement of same axial rigidity for low volumetric ratios. Moreover, it was shown that the variation between the absorbed energy by the specimens confined with carbon and glass fibers was fairly small.
Wang and Wu (2008)
Wang and Wu [7] tested 108 carbon FRP confined short concrete columns under axial compressive loading. Experimental study was aimed to investigate the behavior of confined concrete varying the corner radius, transverse jacket stiffness and concrete strength. These tests were performed on columns with square cross-section of 150 x 150 mm and wrapped with one and two fiber layers. External reinforcement was carried out for different values of the corner radius (15, 30, 45, 60 and 75 mm). The results demonstrated that the enhancement in confined concrete strength is directly proportional to the corner radius ratio. Moreover, it was shown that the confinement provided by a jacket with sharp corners is not effective in increasing the strength of columns but effective in increasing the ductility of columns.
Wu and Wei (2010)
Wu and Wei [34] presented the results of an experimental study on the behavior of axially loaded short rectangular columns that have been strengthened with CFRP wrap. The parameters considered were the aspect ratio, defined as the depth (longer side)/width (shorter side) of the cross-section, and the number of CFRP layers. All of the specimens were 300 mm in height with a corner radius of 30 mm but different
9 cross-sectional aspect ratios (1.0, 1.25, 1.5, 1.75, and 2.0). Experimental results showed that the strength gain in the confined concrete columns decreases with the increase of the aspect ratio and it becomes ineffective when the aspect ratio reaches 2.
Table 1
Details of FRP confined columns and key results.
Source [mm] λ r [mm] ρ n tf [mm] ρf [%] fco [MPa] fcc / fco E/Eo Bournas et al. [16] 200 25 0.25 2 0.170 0.680 15.28 2.00 4.03 200 25 0.25 3 0.170 1.020 15.28 2.27 6.77 Karabinis et al. [37] 200 - 1.00 1 0.117 0.234 38.50 1.12 3.06 200 - 1.00 1 0.117 0.234 38.50 1.08 2.51 200 - 1.00 1 0.117 0.234 38.50 1.19 1.31 200 - 1.00 2 0.117 0.468 38.50 1.34 4.01 200 - 1.00 2 0.117 0.468 38.50 1.30 2.36 200 - 1.00 2 0.117 0.468 38.50 1.43 3.90 200 - 1.00 1 0.117 0.234 35.70 1.19 7.00 200 - 1.00 1 0.117 0.234 35.70 1.18 9.93 200 - 1.00 1 0.117 0.234 35.70 1.15 1.80 200 - 1.00 2 0.117 0.468 35.70 1.40 5.07 200 - 1.00 2 0.117 0.468 35.70 1.36 8.13 200 - 1.00 2 0.117 0.468 35.70 1.40 8.76 Rousakis et al. [33] 200 30 0.30 1 0.117 0.234 33.04 1.16 3.39 200 30 0.30 1 0.117 0.234 33.04 1.17 2.70 200 30 0.30 1 0.117 0.234 34.20 1.23 3.81 200 30 0.30 1 0.117 0.234 34.20 1.23 6.05 200 30 0.30 3 0.138 0.828 33.04 1.29 2.92 200 30 0.30 3 0.138 0.828 33.04 1.27 2.63 200 30 0.30 6 0.138 1.656 37.97 1.39 5.33 200 30 0.30 6 0.138 1.656 37.97 1.38 5.45 Wangand Wu [7] 150 15 0.20 1 0.165 0.440 31.90 1,05 3.41 150 30 0.40 1 0.165 0.440 32.30 1,23 5.24 150 45 0.60 1 0.165 0.440 30.70 1,43 5.52 150 60 0.80 1 0.165 0.440 54.10 1,57 4.64 150 - 1.00 1 0.165 0.440 30.90 1,80 6.76 150 15 0.20 2 0.165 0.880 31.90 1,32 6.28 150 30 0.40 2 0.165 0.880 32.30 1.75 7.42 150 45 0.60 2 0.165 0.880 30.70 2,22 9.19 150 60 0.80 2 0.165 0.880 54.10 2,48 9.53 150 - 1.00 2 0.165 0.880 30.90 2,74 11.39 Wu and Wei [34] 150 30 0.40 1 0.167 0.445 35,30 1,17 3.84 150 30 0.40 2 0.167 0.891 35,30 1,71 10.57 Table 2
10
Details of FRP confined columns for ductility ratio.
Source ρ εcou [%] εccu [%] E [MJ/m3] με μεo με/μεo Bournas et al. [16] 0.25 0.37 0.85 0.21 3.77 1.68 2.24 0.25 0.37 1.30 0.36 3.98 1.68 2.37 Karabinis et al. [37] 1.00 0.41 0.70 0.24 2.20 2.08 1.06 1.00 0.41 0.95 0.22 5.45 2.08 2.63 1.00 0.41 0.59 0.22 3.51 2.08 1.69 1.00 0.41 0.75 0.38 2.78 2.08 1.34 1.00 0.41 0.58 0.22 2.84 2.08 1.37 1.00 0.41 0.73 0.37 2.74 2.08 1.32 1.00 0.20 0.86 0.32 3.96 1.51 2.62 1.00 0.20 0.84 0.29 3.56 1.51 2.36 1.00 0.20 0.30 0.08 3.02 1.51 1.99 1.00 0.20 0.60 0.23 1.63 1.51 1.08 1.00 0.20 0.78 0.37 1.74 1.51 1.15 1.00 0.20 0.80 0.40 1.70 1.51 1.12 Rousakis et al. [33] 0.30 0.17 0.45 0.14 4.28 1.49 2.88 0.30 017 0.36 0.11 3.31 1.49 2.23 0.30 0.18 0.50 0.14 5.53 2.26 2.44 0.30 0.18 0.59 0.22 4.80 2.26 2.12 0.30 0.17 0.60 0.12 9.46 1.49 6.36 0.30 0.17 0.42 0.11 4.92 1.49 3.31 0.30 0.22 0.94 0.45 5.99 2.14 2.79 0.30 0.22 0.83 0.46 4.45 2.14 2.08 Wang and Wu [7] 0.20 0.68 1.80 0.50 10.30 3.71 2.78 0.40 0.68 1.80 0.62 5.94 3.71 1.60 0.60 0.68 1.80 0.75 3.91 3.71 1.05 0.80 0.68 1.90 0.75 2.80 3.71 0.75 1.00 0.68 2.40 1.09 2.56 3.71 0.69 0.20 0.68 2.75 1.01 4.57 3.71 1.23 0.40 0.68 2.70 1.19 2.25 3.71 0.61 0.60 0.68 3.00 1.48 1.84 3.71 0.50 0.80 0.68 3.00 1.53 1.93 3.71 0.52 1.00 0.68 3.20 1.83 1.61 3.71 0.43 Wu and Wei [34] 0.40 0.30 0.82 0.28 5.48 3.35 1.64 0.40 0.30 1.70 0.77 4.95 3.35 1.48
2.2
Columns confined by FRCM system
Several studies has been conducted on the application of carbon fiber sheets embedded in inorganic matrix for confinement of concrete columns. The first study in this field was developed by Wu and Teng [14] where small cylinders concrete columns were tested and the inorganic matrix was found to ensure the same behavior, in terms of strength and deformability increment, as the traditional epoxy resin.
11 In this section, a test database was assembled from the studies of Colajanni et al. [31], Colajanni et al. [19], Ombres [35] and Triantafillou et al. [15]. Key information of the tests are given in Table 3 and Table 4.
Colajanni, Fossetti, Macaluso (2014)
Colajanni et al. [31] studied the behavior of concrete columns wrapped with FRCM under monotonic and cyclic compressive axial loads to investigate the effect of the confinement level, the cross-section shape and the corner radius on the stiffness, strength, and ductility of FRCM confined concrete columns. The experimental test has been defined as follows: ten specimens with square cross-section with side 200 mm; ten concrete specimens with rectangular cross-section having dimensions 200 x 400 mm and ten circular cross-section having diameter equal to 200 mm. Cylindrical specimens were wrapped with two and three layers of bonded textile, while the prismatic specimens were wrapped with two and four layers. The results proved that FRCM confining jackets provide substantial gain in compressive strength, deformability and absorbed energy.
Colajanni, De Domenico, Recupero, Spinella (2014)
Colajanni et al. [19] tested small circular and square cross-section specimens under monotonic axial compression to evaluate the efficiency of a PBO fiber meshes embedded into an inorganic cementitious matrix. The experimental campaign was carried out in two phases: in the first one eight cylindrical specimens with diameter and height respectively equal to 154 and 335 mm were tested; in the second one seven cylindrical specimens with diameter and height respectively equal to 200 and 335 mm and seven specimens with square cross-section with side 200mm and height of 425 mm were tested. For each prismatic specimen a corner radius of 20 mm was adopted. Experimental results showed that PBO-FRCM system produced a noticeable increment in strength and ductility, though the low mechanical ratios of fiber considered were not always able to ensure hardening behavior up to rupture.
Ombres (2014)
Ombres [35] evaluated the effectiveness of the confinement of the cylindrical concrete specimens confined with the PBO-FRCM system varying the fibers reinforcement ratio, the fibers orientation and
12 the compressive concrete strength. Each specimen had a diameter of the circular cross-section equal to 150 mm and were wrapped with one, two, three and four layers of bonded textile. Experimental results have shown that compressive strength and ductility values of the confined specimens are influenced by number and orientation of fiber layers and the best performances were obtained when the fiber were aligned with the axis of specimens.
Triantafillou, Papanicolaou, Zissimopoulos, Thanasis, Laourdekis (2006)
Triantafillou et al [15] studied the role of the number of textile layers and compared the confinement efficiency of systems with inorganic mortar versus epoxy resin. The investigation was carried out on: eight cylindrical specimens with a diameter of 150 mm and a height of 300 mm and six short column-type specimens with a square cross-section of 250 x 250 mm and a height of 700 mm. For each specimens was adopted a corner radius of 15 mm. Experimental test proved that TRM jacketing provided a lower strength and deformability increase compared to FRP jacketing, with the exception of square columns where the same efficiency was found. Moreover, it was observed that the failure of TRM system was less abrupt compared with the FRP system, due to a slower progression of fractures of the reinforcing fibers. In Table 3 the experimental results of compressive tests performed on square and circular cross-section concrete columns reinforced with FRCM are shown. In this paper the columns wrapped with unidirectional FRCM reinforcement perpendicular to the specimen axis have been taken into account.
Table 3
Details of FRCM confined columns and key results.
Source λ [mm] r [mm] ρ n tf [mm] ρf [%] fco [MPa] fcc / fco E/E0 Colajanni et al. [31] 200 15 0.15 2 0.047 0.188 16.48 1.20 2.62 200 15 0.15 2 0.047 0.188 16.48 1.16 2.23 200 30 0.30 2 0.047 0.188 15.90 1.16 2.51 200 30 0.30 2 0.047 0.188 15.90 1.18 2.44 200 15 0.15 4 0.047 0.376 16.48 1.41 3.24 200 15 0.15 4 0.047 0.376 16.48 1.54 4.31 200 30 0.30 4 0.047 0.376 15.90 1.40 4.26 200 30 0.30 4 0.047 0.376 15.90 1.48 5.13 200 - 1.00 2 0.047 0.188 16.80 1.24 5.06 200 - 1.00 2 0.047 0.188 16.08 1.28 5.88 200 - 1.00 3 0.047 0.282 16.80 1.41 5.04 200 - 1.00 3 0.047 0.282 16.08 1.49 4.10
13 200 - 1.00 2 0.047 0.188 16.55 1.24 4.42 200 - 1.00 3 0.047 0.282 16.55 1.48 5.88 200 - 1.00 3 0.047 0.282 16.55 1.44 5.15 Colajanni et al. [19] 200 20 0.20 2 0.045 0.180 25.50 1.18 3.03 200 20 0.20 2 0.045 0.180 25.50 1.12 1.60 200 20 0.20 2 0.045 0.180 25.50 1.02 2.35 200 20 0.20 3 0.045 0.270 25.50 1.27 2.59 200 20 0.20 3 0.045 0.270 25.50 1.18 3.68 200 20 0.20 3 0.045 0.270 25.50 1.27 4.49 154 - 1.00 3 0.045 0.351 24.20 1.40 6.82 154 - 1.00 3 0.045 0.351 24.20 1.50 8.38 154 - 1.00 3 0.045 0.351 24.20 1.64 8.68 200 - 1.00 2 0.045 0.180 24.20 1.26 4.17 200 - 1.00 2 0.045 0.180 24.20 1.38 4.23 200 - 1.00 2 0.045 0.180 24.20 1.19 4.06 200 - 1.00 3 0.045 0.270 24.20 1.42 6.17 200 - 1.00 3 0.045 0.270 24.20 1.33 8.43 Ombres [35] 150 - 1.00 2 0.046 0.245 29.26 1.61 3.83 150 - 1.00 3 0.046 0.368 29.26 1.93 6.21 Triantafillou et al. [15] 150 - 1.00 3 0.047 0.376 21.81 1.49 4.89 250 15 0.12 4 0.047 0.301 14.25 1.51 3.63 Table 4
Details of FRCM confined columns for ductility ratio.
Source ρ εcou [%] εccu [%] E [MJ/m3] με μεo με/μεo Colajanni et al. [31] 0.15 0.19 0.73 0.12 3.41 1.45 2.35 0.15 - 0.62 0.08 - - - 0.30 0.19 0.68 0.10 2.95 1.45 2.03 0.30 - 0.55 0.07 - - - 0.15 0.19 0.83 0.12 4.16 1.45 2.86 0.15 - 0.79 0.15 - - - 0.30 0.19 0.87 0.17 4.91 1.45 3.38 0.30 - 0.73 0.15 - - - 1.00 0.12 1.31 0.22 5.95 3.29 1.81 1.00 0.12 1.50 0.25 6.77 3.29 2.06 1.00 0.12 1.53 0.29 6.96 3.29 2.12 1.00 0.12 1.28 0.23 5.28 3.42 1.55 1.00 - 0.87 0.19 - - - 1.00 - 0.99 0.25 - - - 1.00 - 0.88 0.22 - - - Colajanni et al. [19] 0.20 0.10 1.00 0.26 10.39 4.41 2.36 0.20 0.10 0.60 0.15 7.92 4.41 1.80 0.20 0.10 1.00 0.23 14.42 4.41 3.27 0.20 0.10 0.88 0.25 8.30 4.41 1.88 0.20 0.10 1.32 0.36 11.68 4.41 2.65 0.20 0.10 1.63 0.43 15.91 4.41 3.61 1.00 0.06 1.10 0.30 7.14 2.44 2.92 1.00 0.06 1.20 0.36 7.97 2.44 3.26 1.00 0.06 1.25 0.38 5.69 2.44 2.33 1.00 0.09 0.70 0.18 5.70 2.51 2.27
14 1.00 0.09 0.71 0.18 6.68 2.51 2.67 1.00 0.09 0.71 0.18 5.65 2.51 2.25 1.00 0.09 0.91 0.27 5.63 2.51 2.25 1.00 0.09 1.46 0.36 7.89 2.51 3.15 Ombres et al. [35] 1.00 0.09 1.50 0.51 13.90 5.61 2.48 1.00 0.09 2.00 0.83 15.29 5.61 2.73 Triantafillou et al. [15] 1.00 0.25 1.17 0.42 3.46 1.38 2.51 0.12 0.06 1.15 0.23 18.99 8.99 2.11
3
Proposed simplified procedure and analytical models
The aim is to define the increase in strength (fcc /fco), the increase in ductility (µε /µεo) and the increase in
the dissipated energy (E/Eo) for varying ρ and ρf in a straightforward way as function of a single
parameter depending on the characteristics of the original concrete core and reinforcement system. To this purpose the following step have been carried out:
- define a suitable parameter η in terms of ρf (η = f(ρf)) which depends also on the mechanical and geometrical characteristics of the system (original concrete core and FRM / FRCM jacketing). The parameter η is defined in Eq. (2);
- collect the experimental responses for varying η and ρ;
- perform the best fitting of the curves (fcc/fco (ρ,η); E/Eo (ρ,η); µε/µεo (ρ,η)) and propose an analytical law that approximate experimental results.
c c f f f f E E 4 n t E E η = ⋅ = ρ l (2)
The mathematical models for the strength, ductility and dissipated energy enhancement are obtained by a best fitting of experimental data with the least squares method. The coefficient of determination R2 is evaluated in order to estimate the accuracy of the regression procedure.
The models proposed in the following have two main advantages in comparison with existing models: they do not need the definition of the lateral confinement pressure in order to evaluate the strength, ductility and dissipated energy enhancement; they are obtained from data coming from different experimental campaigns, then they are able to reproduce experimental results from different authors.
15 Some disadvantages are also present in this approach: prediction are only accurate for systems with parameters that are included in the range of parameters of the specimens of the database selected. This fact implies that a very accurate and general model can be defined with a large number of experimental data. However, in this paper it is shown that with a not large database the definition of enhanced mechanical properties is acceptable if the parameters at hand lie in the range of those of the experimental data.
3.1
Simplified analytical model for columns confined by FRP system
For columns confined by FRP system, the best fitting of the experimental data leads to analytical expressions that give the increase/decrease in strength, ductility and dissipated energy as a function of the corner radius ratio and the fiber volumetric ratio as provided by Eq. (3), Eq. (4) and Eq. (5) respectively.
2.81 0.17 cc co f 3280.70 2.25 f − − = η ρ + η (3) 0.79 1.18 8.78 o 0.016 − η− ε ε µ = η ρ µ (4) 1.20 0.20 o E 206.85 6.22 E − − = η ρ + η (5)
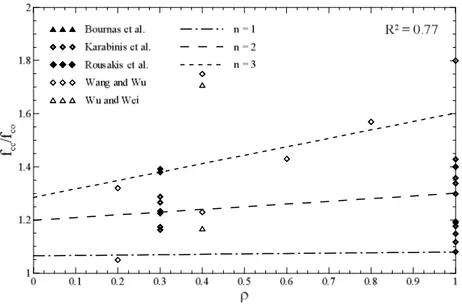
Fig. 2, Fig. 3 and Fig.4 shows respectively the value of fcc /fco, µcc /µco and E/Eo for varying corner radius
ratio and for three different number of fiber layers. Moreover, experimental data and coefficients of determination are shown in each figure.
16 Fig. 2. fcc/fco - ρ curves of columns confined by FRP system.
17 Fig.4. E/Eo - ρ curves of columns confined by FRP system.
A good agreement with the experimental data can be observed for the strength model. The accuracy of the ductility and the energy absorption capacity models appears worse because of the larger dispersion of these two quantities in comparison with the strength data.This is due to the fact that data are taken from different experimental campaigns and then very different stress-strain curve were considered for the construction of the database. Indeed, very different behavior of the post-elastic branch can be observed due to the different collapse mode of the reinforced specimen. This explains because a larger dispersion for the ductility and energy absorption models was obtained in comparison with the strength model. Moreover, the definition of the bilinear curve for the evaluation of the ductility is conventional; in this context it is necessary to adopt an unique method to define the bilinear curve and as a consequence the dispersion of ductility value is quite high.
General trends observed for columns confined by FRP system can be summarized in the following points: (i) the strength and the absorbed energy increases with the corner radius ratio;
(ii) the strength and the absorbed energy increases with the fiber volumetric ratio; (iii) the ductility decreases with the corner radius ratio;
18
3.2
Simplified analytical model for columns confined by FRCM system
For columns confined by FRCM system, the best fitting of the experimental data leads to analytical expressions that give the increase/decrease in strength, ductility and dissipated energy as a function of the corner radius ratio and the fiber volumetric ratio as provided by Eq. (6), Eq. (7) and Eq. (8) respectively.
0.86 0.28 cc co f 6.46 3.47 f − − = η ρ + η (6) 1.06 0.43 o 14.19 − 14.20 − ε ε µ = − η ρ + η µ (7) 0.38 1.01 o E 13.41 118.77 E − − = η ρ + η (8)
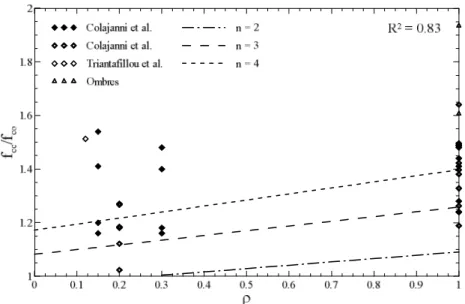
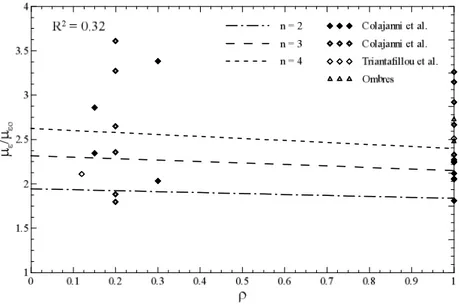
Fig. 5, Fig. 6 and Fig. 7 shows respectively the value of fcc /fco, µcc /µco and E/Eo for varying corner
radius ratio and for three different number of fiber layers.
19 Fig. 6. µε/µεο- ρcurves of columns confined by FRCM system.
Fig. 7. E/Eo - ρ curves of columns confined by FRCM system.
A good agreement with the experimental data can be observed for the strength and energy absorption capacity models. The accuracy of the ductility model appears worse because of the larger dispersion of this quantity in comparison with the strength data.As explained in section 3.1 regarding the FRP system, this is due to the fact that different experimental campaigns are taken into account in the construction of the database and then very different stress-strain curves are considered to evaluate the energy absorption and, for the evaluation of ductility, they have been bilinearized all with the same method.
General trends observed for columns confined by FRCM system can be summarized in the following points:
20 (i) the strength and the absorbed energy increases with the corner radius ratio;
(ii) the strength and the absorbed energy increases with the fiber volumetric ratio; (iii) the ductility decreases with the corner radius ratio;
(iv) the ductility decreases with the fiber volumetric ratio.
4
Applications of the proposed procedure
In the design of the reinforcementfor practical applications, two possible strategies are possible:
- Design strategy a: the increase in ductility (με /μεo) is chosen and from it the increase in strength
(fcc /fco) and the increase in dissipated energy (E/Eo) are evaluated;
- Design strategy b: the increase in strength (fcc /fco) is chosen and from it the increase in ductility
(με /μεo) and the increase in dissipated energy (E/Eo) are evaluated.
In the reinforcement design the known parameters are: the cross section dimension λ; elastic modulus of the unconfined specimens Ec; nominal thickness of the reinforcing system tf; elastic modulus of the fibers
Ef.
It is observed that the value of r obtained from the proposed procedure must lie in the following range:
min max r ≤ ≤r r (9) where min r =20 mm (10) is prescribed by [10] and
(
)
max r = 2+ 2 c (11)has been evaluated from simple geometrical considerations in Fig. 8. In particular, rmax is evaluated as the
value corresponding to the total removal of the clear cover in correspondence of the corner of the cross section.
21 Fig. 8. Sketch of the cross section of concrete columns for the evaluation of rmax.
Both design strategies are based on the following steps. Note that some steps are labelled with the letter a or b, if they are referred to the design “Strategy a” or “b” respectively.
- step 1a: με /μεo is chosen;
- step 1b: fcc /fco is chosen;
- step 2: evaluation of the fiber volumetric ratio ρf and the parameter η for different values of the
number of layers n;
- step 3a: by means of Eq. (4) for FRP reinforced system or Eq. (7) for FRCM reinforced system the value of ρ is evaluated;
- step 3b: by means Eq. (3) for FRP reinforced system or Eq. (6) for FRCM reinforced system the value of ρ is evaluated;
- step 4: a check is performed on the value of ρ and the inadmissible value (out of range between 0 and 1) is discarded;
- step 5: r = ρλ / 2 is evaluated;
- step 6: a check is performed on the value of r and the inadmissible value (out the range defined in Eq. (9)) is discarded;
- step 7a: for the admissible values of ρ and r, the value of fcc /fco is evaluated by means of Eq. (3)
for FRP reinforced system or Eq. (6) for FRCM reinforced system;
- step7b: for the admissible values of ρ and r, the value of με /μεo is evaluated by means of Eq. (4)
for FRP reinforced system or Eq. (7) for FRCM reinforced system;
√2 ⋅c c √2 ⋅r r
22 - step 8: for the admissible values of ρ and r, the value of E/Eo is evaluated by means of Eq. (5)
for FRP reinforced system or Eq. (8) for FRCM reinforced system;
In the following two examples of the design “Strategy a” and “b” are reported. For the examples the given data are:
- cross section dimension λ = 300 mm; - clear cover c = 20 mm (rmax = 68.28 mm);
- elastic modulus of the unconfined specimens Ec= 30 GPa;
- nominal thickness of the reinforcing system tf = 0.117 mm for FRP reinforcement and tf = 0.047 mm for FRCM reinforcement;
- elastic modulus of the fibers Ef = 240 GPa.
The example of application of “Design strategy a” was carried out for concrete columns with FRP reinforcement. The results of the performed analysis are reported in Table 5.
Table 5
Example of application of “Design strategy a” for FRP reinforcement and of “Design strategy b” for FRCM reinforcement.
D e s ig n s tr a te g y
a FRP step 1a Step 2 step 3a Step 4 Step 5 Step 6 Step 7a Step 8
n Set με /μεo Evaluate Evaluate ρ Check on ρ Evaluate r [mm] Check on r Evaluate fcc/fco Evaluate E/Eo ρf [%] η 1 2.40 0.16 80.13 1.79 Unusable --- --- --- --- 2 2.40 0.31 40.06 0.26 Usable 38.28 Usable 1.22 3.61 3 2.40 0.47 26.71 0.18 Usable 26.96 Usable 1.34 3.95 D e s ig n s tr a te g y
b FRCM step 1b Step 2 step 3b Step 4 Step 5 Step 6 Step 7b Step 8
n Set fcc/fco Evaluate Evaluate ρ Check on ρ Evaluate r [mm] Check on r Evaluate με / μεo Evaluate E/Eo ρf [%] η 2 1.25 0.13 99.73 2.28 Unusable --- --- --- --- 3 1.25 0.19 66.49 0.96 Usable 143.30 Unusable --- --- 4 1.25 0.25 49.87 0.35 Usable 52.11 Usable 2.55 3.38
From the observation of Table 5 it is possible to deduct that in order to obtain the chosen ductility increase it is possible to use a fiber volumetric ratio ρf = 0.31% that provides a strength increase of 22%
and an energy absorption capacity increase of 261%. In this case a number of fiber layers n = 2 must be applied with a corner radius of the cross section r = 38.28 mm. Otherwise it is possible to use a fiber volumetric ratio ρf = 0.47% that provides a strength increase of 34% and an energy absorption capacity
23 increase of 295%. In this case a number of fiber layers n = 3 must be applied with a corner radius of the cross section r = 26.96 mm.
The example of application of “Design strategy b” was carried out for concrete columns with FRCM reinforcement. The increase in strength is chosen to be 25%. The results of the performed analysis are reported also in Table 5.
From the observation of Table 5, it is possible to deduct that for the chosen increase in strength the only compatible fiber volumetric ratio ρf is 0.25%; indeed the ρf = 0.13% is not compatible because it gives a
not acceptable value of ρ, while ρf = 0.19% is not compatible because it gives a not acceptable value of r.
In this case a number of fiber layers n = 4 must be applied with a corner radius of the cross section r = 52.11 mm.
5
Comparison with some available models
In this section comparisons are made between the values of strength enhancement deduced by the proposed model in Section 3 and those deducted from existing analytical expressions.
Generally, the confinement effect in terms of strength is related to the effective lateral confinement pressure (fl,e) by the following expression:
m l,e cc 1 co co f f k f f = α + (12)
where α, k1 e m are non-dimensional parameters experimentally evaluated. The reduced effectiveness
provided by jackets other than resins-impregnated ones may be taken into account by splitting k1 as
follows:
1 1,R
k = αk (13)
where α is an effectiveness coefficient which depend of the specifying jacketing system and k1,R is the
24 The effective lateral confinement pressure can be evaluated by the following expression:
l,e f f f e
1
f E k
2
= ρ ε (14)
where Ef and εf are the elastic modulus and strain of the jackets in the lateral direction, respectively, ke is
the effectiveness coefficient that takes into account the variation of the confinement pressure in square and rectangular cross-section specimens respect to circular ones, close to the corners. Such coefficient is provided by the authors of each confinement model.
Various models were considered in order to predict the strength enhancement respectively of FRP and FRCM confined specimens.
In particular, Italian CNR-DT200 Guidelines [10] provides a confinement model for concrete columns wrapped by FRP jacket as follows:
2/3 l,e cc co co f f 1 2.6 f f = + (15)
CNR [10] defined the effectiveness coefficient as follows:
e H V
k =k k kα (16)
where kH is the horizontal effectiveness coefficient, kV is the vertical effectiveness coefficient and kα is
the effectiveness coefficient which takes into account the inclination of the reinforcement fibers. Horizontal effectiveness coefficient can be expressed as:
2 H g 2( r) k 1 3A − = − l (17)
where Ag represents the cross section area of the specimen. For continuous jackets with fibers in the
direction perpendicular to the member axis kv and kα are equal to 1.
Triantafillou et al. [15] proposed the following expressions for concrete columns reinforced with resin (18a) and mortar (18b) impregnated fibers, respectively:
25 l,e cc co co f f 1 2.79 f = + f (18a) l,e cc co co f f 1 1.90 f = + f (18a)
Furthermore, the effectiveness coefficient is defined as in Eq. (16).
Colajanni et al. [19] used the confinement model of Spoelstra and Monti [38] to evaluate the strength gain provided by FRCM jacket l,e l,e cc co co co f f f 2.254 1 7.94 2 1.254 f = + f − f − (19)
Campione et al. [26] provided the lateral confinement pressure as follows:
f r l
2 n t f f =
l (20)
where fr is equal to:
r fu i i 2 2 r 2 f f 1 k k 2 2 = − + l (21)
in which ffu is the ultimate strength of the fiber and ki a coefficient experimentally calibrated and equal to
0.2121. The authors defined the effectiveness coefficient equal to 1/3 for square cross-section specimens. The confinement model proposed by Campione et al. [26] for FRP reinforced columns is defined as:
l,e cc co co f f 1 2 f = + f (22)
Pellegrino et al. [25] proposed an analytical model for FRP confinement of concrete columns with and without internal steel reinforcement. The non-dimensional coefficient k1 is defined as follows:
1 A R
k =k k (23)
26 l,e A co f k = A f − α (24)
where A and α are two non-dimensional parameters experimentally calibrated for concrete specimens reinforced by FRP jackets. The authors provided the values of such coefficients for specimens without reinforcing bars equal to A = 2.25 and α = -0.25. kR is provided by the following expression:
(
)
1 2.5 0.3 2 r / if 2r / 0.3 1 if 2r / 0.3 − − < ≥ l l l (25)Mirmiran et al. [5] defined an analytical model for FRP jackets where the coefficient k1 is evaluated by
the following expression:
( )
0.301 l,e
k = 6.0 f − (26)
and the effectiveness coefficient as k = 2r l . e
Di Ludovico et al. [39] assumed m = 1 and the coefficient k1 for specimens reinforced with resin and
mortar impregnated fibers equal respectively to 2.94 and 3.45.
Ombres [35] proposed the following expression for concrete columns confined with PBO-FRCM system:
l,e cc co co f f 1 5.268 f = + f (27)
Furthermore, the authors assumed a mean value of the effectiveness coefficient equal to 0.492.
De Caso y Basolo et al. [18] proposed a semi-empirical model for columns reinforced with FRCM system. They assumed the coefficients m and k1 equal respectively to 1 and 3.34.
The strength increase fcc /fco has been evaluated for each confinement model considered respectively for
concrete specimens reinforced with FRP and FRCM systems. For this comparison, concrete columns with square and circular cross-section for different values of the corner radius ratio, fiber volumetric ratio and unconfined maximum compressive strength have been considered. Furthermore, two various types of fibers respectively for FRP and FRCM jacketing systems are considered. Mechanical properties of the fibers are synthesized in Table 6. For both reinforcement techniques it can be observed that fibers #1
27 present lower tensile strengths and ultimate deformation capacity respect to fibers #2. The comparisons between proposed and existing models are summarized in Table 7 and Table 8 for FRP and FRCM systems, respectively.
Table 6
Mechanical properties of reinforcing fibers for specimens reinforced with FRP and FRCM systems. FRP jacketing system Type of fiber Nominal thickness [mm] Ultimate tensile strength [MPa] Ultimate tensile strain [%] Elastic modulus [GPa] Primary fiber direction #1 0.117 3700 1.54 240 Unidirectional #2 0.165 4364 2.00 219 Unidirectional FRCM jacketing system Type of fiber Nominal thickness [mm] Ultimate tensile strength [MPa] Ultimate tensile strain [%] Elastic modulus [GPa] Primary fiber direction #1 0.047 4800 2.00 240 Unidirectional #2 0.045 5800 2.15 270 Unidirectional
For both reinforcement techniques, the strength predictions of the proposed model are more conservative respect to those obtained from the confinement model presented above. As can be observed, the models of Campione et al. [26], Pellegrino et al. [25] and Mirmiran et al. [5] gives results closer to the proposed model for FRP jacketing system, although the other confinement models considered in this comparison provide acceptable results.
For FRCM system, a good agreement of the strength prediction can be observed with the model of Triantafillou et al. [15], where two different confinement models for FRP and FRCM system are provided. However, a larger differences for FRCM system can be observed between the existing confinement models and the proposed model in this paper. In particular, high values of strength are obtained with the confinement model of Ombres [35].
The strength enhancement predictions of the proposed model are more closer to the predictions of existing models for lower strength fiber (fiber #1). This fact is more evident for FRP systems respect to FRCM systems, probably because the FRCM systems provide a lower effectiveness in terms of strength respect to FRP systems
For FRP and FRCM system, a more accurate prediction is achieved for high values of concrete compressive strength. Such consideration is obviously due to the fact that for high values of concrete compressive strength, the strength gain offers by external reinforcement decreases.
28 Moreover, for FRCM system, when ρ is equal to 1.0 the difference between the proposed model and the available models is higher than for lower values of ρ. This fact is mainly related on the dispersion of the collected data in correspondence of ρ=1.0.
No comparison is made with ductility and energy absorption capacity enhancement prediction because the existing models does not provide these information. In some cases, the ultimate strain increase is provided but the “yield” strain, necessary to define the ductility, is not provided, while in this approach the ductility is readily evaluated once the bilinear idealization of the stress-strain curve is performed.
Finally it should be pointed out that the cross section dimensions of the specimens considered in this paper are quite homogeneous. Indeed, very similar dimensions are considered in the experimental tests; most of these consider dimensions of the cross section equal to 200 mm and 150 mm (or 154 mm) and they are always less than 250 mm. On the other hand, it is well known that the size effects are relevant for the concrete and for future experimental investigations should be carried out in order to account such effects.
Generally, the accuracy of the confinement models adopted in literature is strongly correlated with the correct definition of the effective confinement pressure and the effectiveness coefficient, especially when the reduced effectiveness provided by jackets other than resins-impregnated ones must be taken into account. The proposed model overcome these drawbacks and at the same time provides a simplified model for an immediate estimate of the strength and ductility increase of the concrete columns.
29 Table 7
Experimental and predicted strength of FRP confined specimens.
D i L u dov ic o e t al . [39 ] fcc / fco #2 1.35 1.71 2.06 1.38 1.76 2.14 1.28 1.57 1.85 1.30 1.61 1.91 1.24 1.47 1.71 1.25 1.51 1.76 1.71 2.42 3.12 1.57 2.13 2.70 1.47 1.94 2.42 #1 1.21 1.42 1.63 1.23 1.46 1.68 1.17 1.34 1.51 1.18 1.36 1.55 1.14 1.28 1.42 1.15 1.30 1.46 1.42 1.85 2.27 1.34 1.68 2.02 1.28 1.57 1.85 M ir m ir an e t al . [ 5 ] fcc / fco #2 1.12 1.20 1.26 1.15 1.24 1.32 1.10 1.16 1.21 1.12 1.20 1.26 1.08 1.13 1.17 1.10 1.16 1.22 1.90 2.47 2.95 1.72 2.17 2.56 1.60 1.98 2.30 #1 1.08 1.14 1.18 1.10 1.17 1.23 1.07 1.11 1.14 1.08 1.14 1.18 1.06 1.09 1.12 1.07 1.11 1.15 1.63 2.02 2.36 1.50 1.82 2.09 1.42 1.68 1.91 P el le g ri no e t al . [25 ] fcc / fco #2 1.09 1.22 1.37 1.12 1.28 1.46 1.07 1.17 1.28 1.09 1.21 1.35 1.06 1.13 1.22 1.07 1.17 1.28 1.38 1.90 2.50 1.29 1.68 2.13 1.23 1.54 1.90 #1 1.05 1.12 1.19 1.06 1.15 1.24 041. 1.09 1.15 1.05 1.11 1.18 1.03 1.07 .1 .12 1. 04 1. 09 1. 15 1. 20 1. 48 1. 79 1. 15 1. 36 1. 60 1. 12 1. 29 1. 48 C am p io ne e t al . [26 ] fcc / fco #2 1.04 1.08 1.13 1.05 1.09 1.14 1.03 1.07 1.10 1.04 1.07 1.11 1.03 1.06 1.08 1.03 1.06 1.09 1.48 1.96 2.45 1.39 1.77 2.16 1.32 1.64 1.96 #1 1.03 1.05 1.08 1.03 1.06 1.08 1.02 1.04 1.06 1.02 1.04 1.07 1.02 1.03 1.05 1.02 1.04 1.06 1.29 1.58 1.86 1.23 1.46 1.69 1.19 1.38 1.58 T ri ant af il lo u et a l. [15 ] fcc / fco #2 1.34 1.67 2.01 1.36 1.72 2.08 1.27 1.54 1.81 1.29 1.58 1.87 1.22 1.45 1.67 1.24 1.48 1.72 1.67 2.34 3.02 1.54 2.08 2.61 1.45 1.90 2.34 #1 1.20 1.40 1.60 1.22 1.43 1.65 1.16 1.32 1.48 1.17 1.35 1.52 1.13 1.27 1.40 1.14 1.29 1.43 1.40 1.80 2.21 1.32 1.64 1.97 1.27 1.54 1.80 C N R -D T 200 [10 ] fcc / fco #2 1.63 2.01 2.32 1.67 2.06 2.38 1.55 1.87 2.14 1.57 1.91 2.19 1.48 1.77 2.01 1.51 1.81 2.06 2.01 2.60 3.09 1.87 2.38 2.80 1.77 2.22 2.60 #1 1.45 1.71 1.94 1.47 1.75 1.98 1.39 1.62 1.81 1.41 1.65 1.85 1.34 1.54 1.71 1.36 1.57 1.75 1.71 2.13 2.49 1.62 1.98 2.28 1.55 1.87 2.13 P rop o se d m od el fcc / fco #2 1.12 1.28 1.43 1.12 1.29 1.45 1.11 1.27 1.41 1.11 1.27 1.42 1.10 1.25 1.39 1.10 1.26 1.40 1.14 1.46 1.99 1.13 1.42 1.89 1.12 1.39 1.82 #1 1.07 1.21 1.33 1.07 1.22 1.34 1.06 1.20 1.31 1.06 1.20 1.32 1.05 1.19 1.30 1.05 1.19 1.31 1.08 1.30 1.60 1.07 1.28 1.55 1.06 1.26 1.51 fco [M P a] 20 20 20 20 20 20 25 25 25 25 25 25 30 30 30 30 30 30 20 20 20 25 25 25 30 30 30 ρf [%] 0. 15 6 0. 31 2 0. 46 8 0. 15 6 0. 31 2 0. 46 8 0. 15 6 0. 31 2 0. 46 8 0. 15 6 0. 31 2 0. 46 8 0. 15 6 0. 31 2 0. 46 8 0. 15 6 0. 31 2 0. 46 8 0. 15 6 0. 31 2 0. 46 8 0. 15 6 0. 31 2 0. 46 8 0. 15 6 0. 31 2 0. 46 8 ρ 0. 13 0. 13 0. 13 0. 17 0. 17 0. 17 0. 13 0. 13 0. 13 0. 17 0. 17 0. 17 0. 13 0. 13 0. 13 0. 17 0. 17 0. 17 1. 00 1. 00 1. 00 1. 00 1. 00 1. 00 1. 00 1. 00 1. 00 λ [m m ] 300 300 300 300 300 300 300 300 300 300 300 300 300 300 300 300 300 300 300 300 300 300 300 300 300 300 300
30 Table 8
Experimental and predicted strength of FRCM confined specimens.
O m b re s [35 ] fcc / fco #2 1.90 2.35 2.81 1.90 2.35 2.81 1.72 2.08 2.44 1.72 2.08 2.44 1.60 1.90 2.20 1.60 1.90 2.20 1.90 2.35 2.81 1.72 2.08 2.44 1.60 1.90 2.20 #1 1.78 2.17 2.56 1.78 2.17 2.56 1.62 1.94 2.25 1.62 1.94 2.25 1.52 1.78 2.04 1.52 1.78 2.04 1.78 2.17 2.56 1.62 1.94 2.25 1.52 1.78 2.04 D i L u dov ic o e t al . [39 ] fcc / fco #2 1.30 1.45 1.60 1.35 1.48 1.65 1.24 1.36 1.48 1.26 1.39 1.52 1.20 1.30 1.40 1.22 1.32 1.43 1.60 1.90 2.20 1.48 1.72 1.96 1.40 1.60 1.80 #1 1.26 1.39 1.52 1.28 1.42 1.56 1.21 1.31 1.41 1.22 1.33 1.45 1.17 1.26 1.35 1.19 1.28 1.37 1.52 1.78 2.04 1.42 1.62 1.83 1.35 1.52 1.69 D e C as o e t al . [18 ] fcc / fco #2 1.58 1.87 2.16 1.58 1.87 2.16 1.47 1.70 1.93 1.47 1.70 1.93 1.39 1.58 1.78 1.39 1.58 1.78 1.58 1.87 2.16 1.47 1.70 1.93 1.39 1.58 1.78 #1 1.50 1.75 2.00 1.50 1.75 2.00 1.40 1.60 1.80 1.40 1.60 1.80 1.33 1.50 1.67 1.33 1.50 1.67 1.50 1.75 2.00 1.40 1.60 1.80 1.33 1.50 1.67 C ol aj an ni e t al . [19 ] fcc / fco #2 1.50 1.70 1.88 1.53 1.74 1.93 1.42 1.59 1.74 1.44 1.62 1.78 1.35 1.50 1.64 1.38 1.53 1.68 1.88 2.18 2.42 1.74 2.00 2.23 1.64 1.88 2.08 #1 1.44 1.62 1.78 1.47 1.66 1.83 1.37 1.52 1.66 1.39 1.55 1.70 1.31 1.44 1.57 1.33 1.47 1.60 1.78 2.06 2.29 1.66 1.90 2.11 1.57 1.78 1.97 T ri ant af il lo u et a l. [15 ] fcc / fco #2 1.17 1.25 1.33 1.18 1.27 1.36 1.13 1.20 1.26 1.14 1.21 1.28 1.11 1.17 1.22 1.12 1.18 1.24 1.33 1.50 1.66 1.26 1.40 1.53 1.22 1.33 1.44 #1 1.14 1.21 1.29 1.15 1.23 1.31 1.11 1.17 1.23 1.12 1.18 1.25 1.10 1.14 1.19 1.10 1.15 1.20 1.29 1.43 1.57 1.23 1.34 1.46 1.19 1.29 1.38 P rop o se d m od el fcc / fco #2 1.00 1.13 1.23 1.01 1.14 1.24 0.99 1.11 1.21 0.99 1.12 1.22 0.98 1.10 1.20 0.98 1.11 1.20 1.12 1.29 1.44 1.10 1.27 1.41 1.08 1.25 1.39 #1 0.98 1.11 1.20 0.99 1.11 1.21 0.97 1.09 1.18 0.97 1.10 1.19 0.96 1.08 1.17 0.96 1.08 1.18 1.09 1.26 1.40 1.07 1.4 1.37 1.06 1.22 1.35 fco [M P a] 20 20 20 20 20 20 25 25 25 25 25 25 30 30 30 30 30 30 20 20 20 25 25 25 30 30 30 ρf [%] 0. 12 5 0. 18 8 0. 25 1 0. 12 5 0. 18 8 0. 25 1 0. 12 5 0. 18 8 0. 25 1 0. 12 5 0. 18 8 0. 25 1 0. 12 5 0. 18 8 0. 25 1 0. 12 5 0. 18 8 0. 25 1 0. 12 5 0. 18 8 0. 25 1 0. 12 5 0. 18 8 0. 25 1 0. 12 5 0. 18 8 0. 25 1 ρ 0. 13 0. 13 0. 13 0. 17 0. 17 0. 17 0. 13 0. 13 0. 13 0. 17 0. 17 0. 17 0. 13 0. 13 0. 13 0. 17 0. 17 0. 17 1. 00 1. 00 1. 00 1. 00 1. 00 1. 00 1. 00 1. 00 1. 00 λ [m m ] 300 300 300 300 300 300 300 300 300 300 300 300 300 300 300 300 300 300 300 300 300 300 300 300 300 300 300
31
6
Conclusions
In this paper the effects of FRP and FRCM jacketing on compressed square or circular concrete columns have been discussed. A simplified analytical model for the identification of the increase in strength, in ductility and in dissipated energy for varying corner radius ratio of the cross section and fiber volumetric ratio has been proposed. From the best fitting of experimental data some analytical functions for the practical evaluation of the confinement effectiveness have been provided.
Since the analytical functions obtained from the best fitting approximates several experimental results, they can be used for each kind of FRM and FRCM jacketing, overcoming the limit of many empirical or semi-empirical models given in the literature, that are affected by experimental calibration on specific parameters (concrete strength, fiber volume, corner radius of the of cross-section, etc.) and then applicable only to specific cases.
The reliability of the proposed procedure has been confirmed by a comparison between the values of strength increase deduced by the proposed procedures and those deduced from empirical or semi-empirical models given in the literature.
Finally, it is worth remarking that the proposed model, differently from what is usually done in the literature, relates the confinement effectiveness to a single parameter representative of the relative stiffness between the original concrete core and the reinforcement system.
Conflict of Interest
: The authors declare that they have no conflict of interest.References
[1] Campione G, Colajanni P, La Mendola L, Spinella N (2007) Ductility of R.C. members externally wrapped with frp sheets. J ComposConstr 11(3):279–90
[2] Xiao Y, Wu H (2000) Compressive behavior of concrete confined by carbon fiber composite jackets. J Mater Civil Eng 12(2):139–146
32 [3] Pessiki S, Harries KA,Kestner JT, Sause R, Ricles JM (2001) Axial behavior of reinforced
concrete columns confined with FRP jackets. ASCE J Compos Constr 5(4): 237–245
[4] Lam L, Teng JG (2003) Design-oriented stress–strain model for FRP-confined concrete. Constr Build Mater 17(6–7):471–489
[5] Mirmiran A, ShahawyM, Samaan M, El-Echary H (1998) Effect of column parameters on FRP confined concrete. ASCE J Compos Constr 2(4):175–185
[6] Lam L, Teng JG (2004) Ultimate condition of fiber reinforced polymer-confined concrete. J Compos Constr8(6):539–548
[7] Wang L-M, Wu Y-F (2008) Effect of corner radius on the performance of CFRP-confined square concrete column: test. J EngStruct 30(2):493–505
[8] Lam L, Teng JG, Cheung CH, Xiao Y (2006) FRP-confined concrete under cyclic axial compression. Cement Concrete Compos28(10):948–58
[9] Jiang T, Teng JG (2007) Analysis-oriented stress–strain models for FRP-confined concrete. EngStruct29(11):2968–2986
[10] CNR-DT200 (2004) Guide for the design and construction of externally bonded FRP systems for strengthening existing structures (Materials, RC and PC Structures, masonry structures). CNR, National Research Council, Rome, Italy
[11] ACI Committee 440 (2008) Guide for the design and construction of externally bonded FRP systems for strengthening concrete structures. ACI 440.2R-08, American Concrete Institute, Farmington Hills
[12] Fédérationinternationale du Béton (fib). Externally bonded FRP reinforcement for RC structures. Bulletin no. 14, technical tep. Lausanne, Switzerland
[13] Kurtz S, Balagru P (2001) Comparison of inorganic and organic matrices for strengthening of RC beams with carbon sheets. J StructEng ASCE 127(1):35–42