ORIGINAL PAPER
A high-voltage lithium-ion battery prepared using a Sn-decorated
reduced graphene oxide anode and a LiNi
0.5
Mn
1.5
O
4
cathode
Pier Paolo Prosini1,2&Maria Carewska1&Gabriele Tarquini3& Fabio Maroni4&Agnese Birrozzi4&Francesco Nobili4
Received: 28 July 2015 / Revised: 10 September 2015 / Accepted: 7 October 2015 # Springer-Verlag Berlin Heidelberg 2015
Abstract This paper describes the preparation and character-ization of a high-voltage lithium-ion battery based on Sn-decorated reduced graphene oxide and LiNi0.5Mn1.5O4as the anode and cathode active materials, respectively. The Sn-decorated reduced graphene oxide is prepared using a microwave-assisted hydrothermal synthesis method followed by reduction at high temperature of a mixture of (C6H5)2SnCl2 and graphene oxide. The so-obtained anode material is char-acterized by thermogravimetric analysis, X-ray diffraction, scanning electron microscopy, and electron diffraction spec-troscopy. The LiNi0.5Mn1.5O4 is a commercially available product. The two materials are used to prepare composite electrodes, and their electrochemical properties are investigat-ed by galvanostatic charge/discharge cycles at various current densities in lithium cells. The electrodes are then used to as-semble a high-voltage lithium-ion cell, and the cell is tested to evaluate its performance as a function of discharge rate and cycle number.
Keywords Tin . Reduced graphene oxide . LiNi0.5Mn1.5O4. Composite electrodes . Lithium battery
Introduction
Lithium-ion batteries (LIBs) represent a milestone for the mo-bile power sources and are currently used for a large number of electrical applications. Nevertheless, the development of electric storage systems with higher performance requires the development of new electrode materials with higher spe-cific capacity and/or higher voltage. At present, the attention is focused on high-voltage layered metal oxides for the cathode [1,2] and high-capacity lithium storage metals and metal al-loys for the anode [3]. The research activity on high-voltage cathode materials represents one of the key challenges for developing new advanced batteries with higher specific ener-gies. LiNi0.5Mn1.5O4 (LNMO) with a spinel structure is emerging as one of the most promising active materials for the construction of high-energy Li-ion batteries [4–10]. This is mainly due to its high theoretical gravimetrical specific capac-ity of 146.7 mAh g−1coupled with a high working voltage (about 4.7 V below the Fermi energy of a lithium metal anode) leading to a theoretical gravimetrical specific energy as high as 650 Wh kg−1[10]. Due to the reduced nickel content in the material, the use of LNMO is also attractive from an econom-ical point of view [11]. Lithium storage metals and alloys (intermetallics), such as Sn [12], Sb [13], Te [13], Al [14], Si [15], and SnSb [12], show high theoretical charge densities and impressive specific capacities and could replace the car-bonaceous anode materials. Metallic Sn has a high theoretical capacity (993 mAh g−1or 7262 mAh cm−3for Li4.4Sn) and a good electric conductivity. It also exhibits a moderate operat-ing voltage that is useful to increase the safety of LIBs duroperat-ing rapid charge/discharge processes. These properties encourage the study of Sn as alternative anode material for high-performance LIBs [16]. Unfortunately, Sn maintains its good electrochemical characteristics for a little number of cycles and this behavior is caused by the disaggregation of the
* Pier Paolo Prosini [email protected]
1 ENEA, Italian National Agency for New Technologies, Energy and Sustainable Economic Development, Casaccia Research Centre, Via Anguillarese 301, Santa Maria di Galeria, 00123 Rome, Italy 2
Drive the Innovation in Energy Storage (DInESto), Via Province, 04012 Cisterna di Latina, Italy
3
Dip. Scienze di Base ed Applicate per l’Ingegneria, University of Roma La Sapienza, Via Scarpa 14, 00161 Rome, Italy
4 School of Science and Technology, Chemistry Division, University of Camerino, Via S. Agostino, 62032 Camerino (MC), Italy DOI 10.1007/s11581-015-1577-x
electrode; it is possible to observe dramatic volume change (about 300 %) as a result of lithium-ion insertion/extraction. Sn nanostructures with metal organic framework [17], encap-sulation of nanoparticles in carbon matrix [18], construction of hybrid anodes consisting of nanosized Sn and carbon [19], and dilution of the active material in a conductive matrix (e.g. the mixed-conductor matrix concept [20]) are proposed like possible solutions to improve the structural stability of the material and, consequently, the integrity of the Sn electrode. At the base of these strategies is the idea that low-dimension materials can better withstand the huge volume changes and that the conductive matrix can buffer the volume changes and increase the electrical conductivity of the active material, avoiding electric contact loss. Recently, graphite-based mate-rials such as graphene oxide (GO), graphene, and chemically modified graphene oxides have received much attention for energy storage devices [21,22]. The disadvantage of GO is the electrical insulation, increasing with the high presence of C–O bonds. The chemical reduction and the thermal anneal-ing are commonly used to reduced GO, obtainanneal-ing the electri-cally conducting reduced graphene oxide (RGO). RGO repre-sents an excellent substrate to host active nanoparticles be-cause of its intrinsically high conductivity, flexibility, large surface area, and chemical stability [23]. The chemical way to reducing GO involves the use of strong reducing agents, including hydrazine [24], hydroquinone [25], or NaBH4[26]. Another proposed method requires the use of an acid solution added with metal powders (e.g., Fe and Al) [27, 28]. Alternatively, thermal annealing in H2or mixture of H2and Ar is reported to remove effectively the oxygen from the GO [29,30]. Several techniques can be found in the literature to prepare Sn–graphene hybrids with various structures such as directly Sn-decorated graphene [31–34], Sn@C nanoparticles [35,36], Sn@graphene [37–39], and sandwich-like graphene-supported hybrids [38–42]. Despite these hybrids have good electrochemical performances, at high charge/discharge rates, their cyclability is similar to other Sn carbon hybrid anodes. The poor rate performance of these Sn-based electrodes can be ascribed to four main factors: (i) the graphene nanosheets can regroup or stack irreversibly [43], (ii) the synthesis of RGO for exfoliation or reduction can introduce structural defects in-volving decreasing of stability and electronic conductivity [44], (iii) Sn nanoparticles do not always have the same size and are not equally distributed in the layers of graphene [45], and (iv) the graphene nanosheets not always have successful contact with adjacent Sn nanoparticles [46]. Moreover, the presence of nanostructures exposing active Sn can increase the irreversible capacity due to the direct contact with electro-lyte causing possible side reactions at the interface [44]. Microwave-assisted hydrothermal synthesis method is also used for the preparation of SnO2–graphene nanocomposites. Zhong et al. obtain materials with stable capacity [47], while Zhu et al. achieved SnO2–graphene composites with
homogeneous distribution of tin oxide particles (100– 200 nm) [48]. This preparation technique has many advan-tages with respect to conventional preparation methods such as fast heating and high efficiency. Microwave-assisted hy-drothermal synthesis method is also used to impart novel structures and special morphologies to the active material for both anode and cathode [49,50]. In this paper, we pre-pared a Sn–graphene composite to be used as an anode in LIB. The novelty of our approach consists in the preparation of a composite with a homogeneous size distribution of tin particles. This result is obtained using the microwave-assisted hydrothermal synthesis method. The Sn–graphene composite is obtained by heating a metal organic tin com-pound and GO in H2/Ar atmosphere. The tin particles can reduce the irreversible aggregation of the graphene nano-sheets, considered one of the causes of the capacity fade of the electrode. To reduce the problems related to unwanted side reactions between Sn and the electrolyte and to better control the size and distribution of Sn nanoparticles in the graphene layers, the amount of tin is kept very low. In order to enhance the electrode characteristics of the SnRGO elec-trode, we used a commercially available acrylic-styrene co-polymer (Pattex PL50) as a binder. Pattex PL50 is a water-based dispersion of polystyrene acrylate (PSA) copolymer. In addition to the PSA copolymer, it contains some fillers and thickeners (mainly calcium carbonate). The PSA copol-ymer has a high chemical stability due to the absence of residual double bonds and a very high glass transition tem-perature, and consequently, the polymer film is very rigid. The chemical and physical characteristics that the polymer imparts to the resulting film are very good: high hydropho-bicity, low water absorption, and great mechanical strength. In this paper, we present the synthesis and characterization of Sn-decorated RGO. The material is used to prepare an electrode tape using PSA copolymer as the binder, and the electrochemical properties of the electrode are tested at var-ious charge/discharge rates. Finally, high-voltage lithium-ion battery is fabricated, coupling the SnRGO electrode with a LNMO-based cathode, and the electrochemical properties of the cells are studied as a function of current density and cycle number.
Materials and methods
Preparation of the Sn-decorated RGO The synthesis proce-dure is detailed elsewhere [51]. Briefly, in a standard prepara-tion, 0.5 g of GO (NanoInnova Technologies SL, Madrid) is dispersed by sonication in 50 ml of ethylene glycol (EG) until the formation of a stable suspension. 1.50 g of polyacrylic acid (PAA, MW∼2000; Sigma-Aldrich) is dispersed by sonication in about 20 ml of EG. A 0.05 M solution of phenyltin chloride [(C6H5)2SnCl2] is prepared, dissolving 0.344 g of the salt in
about 20 ml of EG. The dispersion of PAA is added to the dispersion of GO dropwise, and the resulting suspension is allowed to sonicate for 2 h. The solution of phenyltin chloride is slowly added dropwise to the suspension of GO/PAA under vigorous stirring. The resulting mixture is sonicated for 2 h. The reaction mixture is placed in a microwave oven and irra-diated with a power of 900 W for 10 min under stirring. The formed black solid is separated from the residual solution by filtration, washed three times with ethanol, and dried in air at 50 °C. The residue is processed in an oven at 800 °C in Ar/H2 atmosphere (95:5) for 5 h and left to cool at room temperature. Preparation of the Sn-decorated RGO anode tape 0.3 g of Sn-decorated RGO and 0.068 g of carbon black (Super P; MMM Carbon) are weighed and then transferred to a mill for the mixing. 0.032 g of Pattex PL50 (Henkel Düsseldorf, Germany) with a solid mass fraction of 90 % is dispersed in 5 g of water. The suspension is subsequently added to the powder mixture, and the components are mixed by operating the mill for a few minutes. The suspension that is thus obtain-ed is usobtain-ed to paint a copper sheet covering a surface area of 100 cm2. After drying in air at 130–150 °C, the procedure is repeated as many times as it is necessary to use up the entire suspension. A typical negative electrode composition is 75.8 wt% SnRGO, 7.0 wt% Pattex PL50, and 17.2 wt% Super P. Electrodes are shaped to form a disc with a diameter of 12 mm and an average thickness of 40μ. The electrode weight ranges from 2.0 to 2.5 mg, which corresponds to a specific mass loading of 1.76–2.21 mg cm−2. Lighter elec-trodes (from 0.9 to 1.1 mg with a specific mass loading of 0.68–0.83 mg cm−2) are obtained by punching the electrode tape in proximity of the edges. Prior to the electrochemical characterization, the electrodes are dried by heating under vacuum at 110 °C for 12 h.
Preparation of the LNMO cathode tape A procedure simi-lar to that reported for the preparation of the anode tape is used to assemble the cathode. 0.75 g of LiNi0.5Mn1.5O4(Nanomyte SP-10; NEI Corporation Somerset, NJ, USA) and 0.10 g of carbon black (Super P; MMM Carbon, Belgium) are weighed and transferred to a mechanic mill. The powder is mixed by operating the device for a few minutes. A water dispersion of polyvinyl acetate (PVAc) with a solid mass fraction of 50 % is used (Vinavil SpA via Valtellina, 63-20159 Milan, Italy). 0.30 g of the PVAc dispersion is diluted with 8 g of water. The suspension of PVAc is added to the powder mixture and mixed by operating the mill for a few minutes. The so-obtained suspension is used to paint a thin aluminum sheet covering a surface area of 50 cm2. After drying in air at 130– 150 °C, the procedure is repeated as many times as it is nec-essary to use up the entire suspension. The electrode compo-sition is 75 wt% LiNi0.5Mn1.5O4, 15 wt% PVAc, and 10 wt% Super P. Electrodes are cut as discs, with a diameter of 12 mm
and a thickness of about 80μ. The electrode weight ranged from 15.6 to 16.0 mg, which corresponds to a specific mass loading of 13.8–14.1 mg cm−2. Prior to the electrochemical characterization, the electrodes are dried by heating under vacuum at 110 °C for 12 h.
Chemical-physical characterization The morphology of the tapes is studied by scanning electron microscopy (SEM). High-magnification microphotographs are taken using an AURIGA, CrossBeam Workstation dual-column focused ion beam–SEM and a JEOL JSM-5510LV. The specimens are directly mounted onto a conductive double face carbon tape, which is previously mounted on a slab. The surface chemistry is mapped with an X-ray energy-dispersive spectroscopy (EDS) system (IXRF EDS-2000). The structure of the mate-rial is characterized by X-ray powder diffraction (XRD) anal-ysis (Rigaku Miniflex) using Cu-Kα radiation. The thermal stabilities are investigated by the simultaneous use of a ther-mogravimetric (TG) and differential thermal analysis (DTA) instrument (Q600 SDT; TA Instruments) equipped with the Thermal Solution software (version 1.4). The reference for the calibration of temperature is nickel Curie point. Ceramic standard, furnished with instrument, permitted the mass cali-bration. An aluminum oxide with high grade of purity is used as a comparison material. The experiments are performed with open platinum crucibles (cross section=0.32 cm2) using 10– 12 mg of samples. Starting from room temperature, the sample is heated with a gradient of 10 °C min−1up to 850 °C. The onset temperature is calculated by thermal analysis software (Universal Analysis, version 2.5) as the intersection between the extrapolated baseline and the tangent through the inflec-tion point of the weight vs. temperature curve.
Electrochemical characterization For the electrochemical characterization, circular electrodes with a diameter of 12 mm are punched from the tape. Their electrochemical fea-tures are tested in a two-electrode lithium cell in which lithium acted both as the counter and reference electrode. The cells are set up by sandwiching a glass fiber, used as the separator, between the positive and the negative electrodes. The cycling performance and the cycle life of the cells are evaluated in 2032-type coin cells. A 1.0 M solution of LiPF6dissolved in EC/DEC (1:1) is used as the electrolyte. The cycling tests are automatically carried out with a battery cycler (Maccor 4000). All experimental activities are performed at 20 °C in a dry room (R.H. <0.1 % at 20 °C).
Results and discussion
Chemical–physical characterization of the Sn-decorated RGO The thermal property of the SnRGO and the percentage of tin and carbon in the composite material are determined by
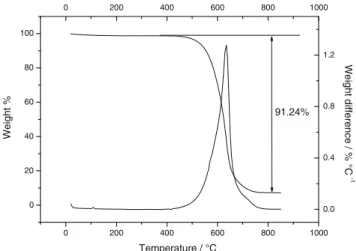
TG analysis, which is performed in air atmosphere with a heating rate of 10 °C min−1from 20 to 850 °C. TGA mea-surement confirms the reduction of graphene oxide by the thermal treatment. In fact, as shown in Fig.1, with the increas-ing of the temperature, the SnRGO shows no weight varia-tions up to 400 °C, confirming a good thermal stability due to the absence of labile oxygen functional groups. A small weight loss occurs between 420 and 550 °C, which suggest the oxidation of graphene present on the surface of the SnRGO composite. After that, an important weight change occurs between 550 and 650 °C, which can reveal the oxida-tion of graphene present on the bulk of the composite material. The DTA shows a peak centered at 625 °C. With further heating, a little weight loss is observed for temperatures lower than 750 °C.
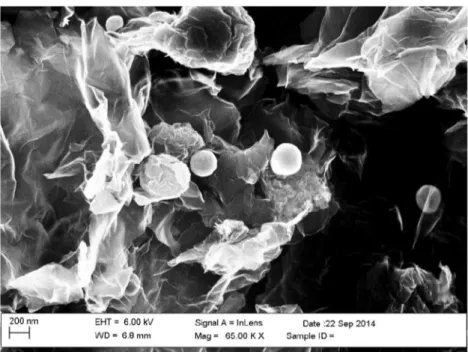
The weight percentage of the final residue is about 8.76 wt%. Considering that at elevated temperatures and in air the tin is completely converted into SnO2, this value cor-responds to the tin content in the composite (expressed as SnO2). Figure2shows the SEM image of the SnRGO com-posite material. It is possible to observe a fairly compact struc-ture in which graphene layers are stacked and wrapped around each other, resembling a foliated graphite obtained by chem-ical flaking of natural graphite [52]. The porosity of the mate-rial is very high. The presence of spherical particles deposited on the surface of the graphite sheets is also noted. EDS anal-ysis allowed to identify the chemical nature of the particles that results to the formation of tin. The Sn particles have a size ranging from 200 nm up to 400 nm and are highly dispersed on the RGO surface. The composite material appears rather uniform in size and shape; however, the particles are not ho-mogeneously distributed on the graphene sheets. From EDS analysis, it is also possible to observe that the tin oxide pro-duced by thermal decomposition of the organic precursor re-mains uniformly dispersed into the graphene matrix. On the other hand, metal tin tends to agglomerate forming the
spherical particles observed by SEM. This is probably due to the fact that the tin at the operative reduction temperature of 800 °C is in a liquid form.
XRD analysis (Fig.3) gives further knowledge on the crys-tal structure and chemical structure of the tin present in the particles. All the peaks shown in Fig. 3 can be indexed as belonging to crystalline tin and tin oxide with a Cassiterite structure, as reported in the Joint Committee on Powder Diffraction Standards (JCPDS) card nos. 4-673 and 41-1445, respectively. The peak located at 2θ=30° and indicated in Fig.3with an asterisk can be related to the presence of SnO with a Romachite structure (JCPDS card no. 6-395) that has the major reflection peak, corresponding to [010] plane, locat-ed at 2θ=29.96°. The SnO can be originatlocat-ed by a partial re-duction of SnO2during the thermal annealing in H2/Ar atmo-sphere. As regards the peak centered at about 2θ=26.6°, it typically describes the formation of a RGO structure [53,
54], which tends to partially restack during the high-temperature treatment (graphene nanosheets).
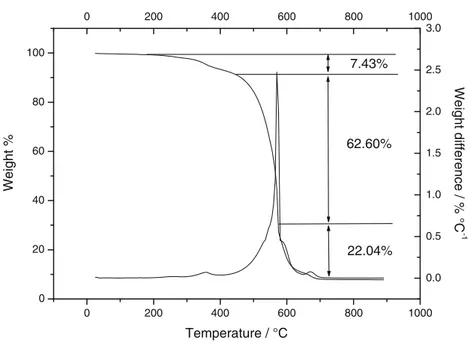
Chemical–physical characterization of the PSA–SnRGO tape The TGA and the differential thermal gravimetry (DTG) profiles for the decomposition of the PSA–SnRGO tape in air are shown in Fig.4. There is no mass loss up to 200 °C. By increasing the temperature, the thermal profile shows a behavior that can be related to the PSA depolymerization. This weight loss is related to the decomposition of oligomers with mostly head-to-head linking. A first peak, related to the PSA main-chain decomposition, can be observed in the DTG between 230 and 435 °C with a maximum centered at 386 °C. The decomposition temperature is comparable to that observed by Reza-Azimi et al. [55] for polystyrene methyl methacrylate. The total weight loss in this temperature range is about 7.43 wt%, higher than the percentage of binder into the elec-trode. This phenomenon could be imputed to the oxidation of the reactive graphene sheets present on the surface of the SnRGO, as previously observed for pure SnRGO. The main weight loss step occurs at temperatures ranging between 400 and 580 °C with a maximum centered at 570 °C. This step is assimilated to the oxidative degradation of the RGO. The total weight loss in the step is about 62.6 wt% (the theoretical weight loss in this step should be about 64 wt%). It follows that not all the RGOs are burned in this temperature range. This finding is consistent with that found in the previous TGA for which the RGO is completely burned at temperatures above 700 °C. At the end of this degradation step, for temperatures higher than 580 °C, a third degradation step is observed. This step is shown as a shoulder in the down slope of the DTA curve. It can be related to the oxidative degradation of Super P carbon and the residual part of RGO. A final degradation step occurs for temperatures higher than 625 °C, and it is correlated to the decomposition of CaCO3content as a filler into the Pattex 50 and the complete oxidation of the residual Super P
0 200 400 600 800 1000 0 20 40 60 80 100 0 200 400 600 800 1000 0.0 0.4 0.8 1.2 91.24% Weight difference / % °C -1 Weight % Temperature / °C
Fig. 1 Thermogravimetric analysis for the SnRGO sample, carried out in air at a heating rate of 10 °C min−1
carbon and RGO still present in the sample. The total weight loss extending from 580 °C up to 690 °C amounts to 22.4 wt%. The residue of 7.79 wt% is formed by tin oxide and calcium oxide. Considering the percentage of Pattex 50 into the elec-trode (about 7.0 %), the percentage of CaCO3in the Pattex 50 (about 50 %), and the percentage of weight loss due to the transformation of CaCO3into CaO (46 %), the theoretical amount of CaO should be 1.61 wt%. By subtracting the per-centage of CaO from the final residue, it is possible to obtain the percentage of SnO2which amounts to 6.18 wt%. By divid-ing this value by the percentage of SnRGO in the composite tape (75.8 %), it is possible to calculate the percentage of tin (expressed as SnO2) into the SnRGO which amounts to
8.1 wt%, a value little bit lower than the previously obtained one (8.76 wt%).
The thickness and morphology of the electrode tape are investigated by SEM. Figure 5ashows the cross section of the electrode: it appears uniform with a thickness of about 55μm. Figure5bshows the low-magnification image of the anode surface (×100). The surface depicted in the figure has an area of about 0.9 mm2. Although the surface is quite smooth, some rough edges emerge from the plane. On the other hand, it is also possible to note the presence of some holes and cracks. The parts that emerge from the surface of the electrode as well as the electrode cracks can be directly related to the deposition process (in which a brush is used for the
Fig. 2 Scanning electron micrograph of the SnRGO sample
0 20 40 60 80 100 0 200 400 600 800 1000 1200 1400 1600 1800 0 20 40 60 80 100 0 200 400 600 800 1000 1200 1400 1600 1800
Diffraction angle / 2 theta
[222] [321] [312] [301] [310] [002] [220] [211] [111] [200] [200] [110] [101] [431] [411] [420] [321] [400] [112] [301] [211] [220] [101] [200] Sn, JCPDS n° 4-673 SnO2, JCPDS n° 41-1445 Counts
*
Fig. 3 XRD patterns of the SnRGO sample. The diffraction planes for Sn and SnO2are reported in black and in gray, respectively
coating of the current collector). The holes are probably formed during the drying phase due to the release of vapor bubbles in which evaporation leaves empty spaces in the tape electrode.
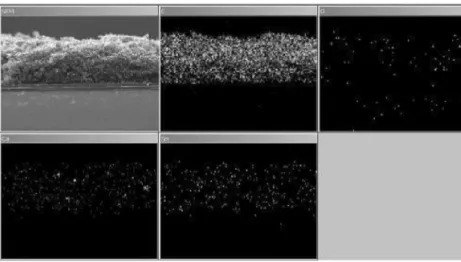
X-ray EDS is performed in order to evaluate the homoge-neity and distribution at a microscopic level of the various components within the electrode. The distribution of carbon, oxygen, calcium, and tin is investigated inside the thickness of the electrode. The correspondent distribution maps are depicted in Fig.6. The carbon appears uniformly distributed on the whole thickness of the electrode. The oxygen content appears very low. This is probably due to the fact that oxygen is present only as SnO2or CaCO3. Calcium is mapped as a marker to evaluate the uniformity of the binder distribution into the electrode, and it has very good results. Also, the signal of Sn is equally distributed into the electrode, confirming the uniformity of the electrode and the validity of the covering method to obtain an almost homogeneous electrode.
Electrochemical characterization Figure7ashows the first charge/discharge voltage profile for the PSA–SnRGO elec-trode. The active material in the electrode weighs 1.0 mg.
The electrode is cycled at a specific current of 100 mA g−1 between 2.0 and 0.01 V. During the first lithiation cycle, the electrode is able to accommodate about 600 mAh g−1. Only part of the capacity accumulated in the first discharge can be extracted from the electrode. In fact, in the following charge, the electrode is able to restore only 380 mAh g−1. The irre-versible capacity in the first cycle corresponds to about 37 %. As reported by other authors, this irreversible capacity is caused by the degradation of the electrolyte and by the forma-tion of a passivaforma-tion layer on the electrode surface. Also, the reduction of SnO2to Sn contributes to the irreversible capacity [51] being, as demonstrated by XRD analysis, the metal oxide still present in the composite after the thermal treatment under reducing atmosphere. The first-cycle irreversible capacity, and the following reversible charge behavior of the SnRGO elec-trode, can be better explained by analyzing the differential capacity curve shown in Fig.7b. The differential capacity (Qdiff), given by Qdiff=[d (mAh)/d (V)], is the derivative of the amount of charge added (charge cycle) or charge removed (discharge cycle) with respect to the cell voltage. The differ-ential profile of the first discharge shows a large amount of capacity exchanged by irreversible processes in the voltage
0 200 400 600 800 1000 0 20 40 60 80 100 0 200 400 600 800 1000 0.0 0.5 1.0 1.5 2.0 2.5 3.0 Weight difference / % °C -1 22.04% 62.60% 7.43% Weight % Temperature / °C Fig. 4 Thermogravimetric analysis for the PSA–SnRGO electrode tape, carried out in air at a heating rate of 10 °C min−1
a
b
Fig. 5 Scanning electron micrographs of the PSA–SnRGO electrode tape deposited on a cupper current collector. a High-magnification image (×500) of the electrode cross section. b Low-magnification image (×100) of the electrode surface
range 0.6 to 0.3 V, with a peak centered at 0.4 V (A). This can be mainly ascribed to the formation of a solid electrolyte
interphase (SEI) between the electrolyte and the active mate-rial, taking place preferentially at the surface of RGO
Fig. 6 Distribution maps of the PSA–SnRGO electrode cross section for carbon, oxygen, calcium, and tin as obtained by X-ray energy-dispersive spectroscopy 0.0 0.1 0.2 0.3 0.4 0.5 0.6 0.0 0.5 1.0 1.5 2.0 2.5 0 100 200 300 400 500 600 0.0 0.5 1.0 1.5 2.0 2.5
Specific capacity / mAh g-1
Cell voltage / V Capacity / mAh
a
0 10 20 30 40 0 100 200 300 400 500 600 700 800 0 10 20 30 40 0 100 200 300 400 500 600 700 800c
100 mA g-1 50 mA g-1 25 mA g-1 200 mA g-1Specific capacity / mAh g
-1 Cycle number Ch. Cap. Dis. Cap. 0.0 0.4 0.8 1.2 1.6 2.0 -2.5 -2.0 -1.5 -1.0 -0.5 0.0 0.5 1.0 0.0 0.4 0.8 1.2 1.6 2.0 -2.5 -2.0 -1.5 -1.0 -0.5 0.0 0.5 1.0
b
(D) (C) (B) (A) dQ dE -1 / mAh V -1 Voltage vs. Li/Li+ / VFig. 7 a First-cycle voltage profile as a function of the capacity for a PSA–SnRGO electrode cycled in a lithium cell at 100 mA g−1. b Differ-ential dQdE−1vs. E curves corresponding to the voltage profiles shown in a. c Specific capacity (in charge and discharge) and Coulombic efficiency
as a function of the number of cycles at various charge/discharge currents. The weight of the electrode active material is 0.98 mg. The active material load for unit area is 0.86 mg cm2
nanosheets and with the SnO2reduction. The formation of the SEI is the main reason for the very large irreversible capacity, which is commonly evidenced for composite materials where an amorphous carbon matrix is the main component of the active material [56,57], as in the case for the SnRGO com-posite under investigation. Further irreversible capacity can be ascribed to Li storage at the surface, cavities, and defects of the disordered carbon [58,59]. Below 0.3 V, a high and rela-tively broad peak shows up (B), corresponding to the sloping plateau in Fig.7aat the same potential values. This feature can be associated mainly with Li intercalation into the partly restacked RGO matrix and, partially, to the Sn lithiation. In the subsequent charge, a couple of peaks are observed: a large one (C) at 0.1 V followed by a smaller peak (D) centered at 0.6 V. It is noteworthy that Li extraction still continues to the higher potential and it is completed only at voltages higher than 1.0 V. The first peak (C) can be ascribed to reversible Li de-intercalation from the RGO, and it accounts for a large part of the reversible capacity. The second peak observed at 0.6 V and the remaining capacity extracted at voltages between 0.5 and 0.9 V can be attributed to lithium de-alloying from LixSn [60].
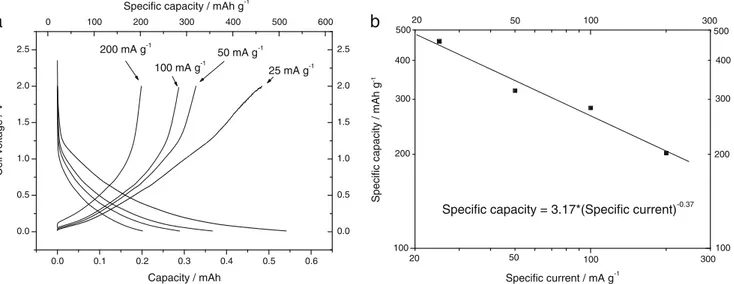
Figure7cshows the specific capacity (both in charge and discharge) and the Coulombic efficiency as a function of the number of cycles at various charge/discharge currents. By analyzing Fig.7c, it is possible to note that the irreversible capacity is not limited to the first cycle but this phenomenon also affects the subsequent cycles. In fact, also if in a reduced manner, the specific capacity in discharge (filled circle in Fig.7c) is larger than the specific capacity in charge (hollow circle in Fig.7c). After the 4th cycle, the capacities in charge and discharge assume a similar value and the charge coeffi-cient reaches a unitary value. It is important to highlight that increasing the charge/discharge rate, the irreversible capacity decreases. In fact below 50 mA g−1, the difference between the capacity in charge and discharge increases and this effect is boosted when the cycling rate is further decreased down to 25 mA g−1. Contrarily, the reversibility of the insertion/de-insertion process is perfectly restored when the cycling rate is increased up to 200 mA g−1. This behavior can be explained assuming that the kinetics of the lithium insertion process into the material is larger than that of the parasitic reaction respon-sible of the irreverrespon-sible capacity. If this hypothesis is respected, at high charge/discharge rate, the main phenome-non occurring at the electrode is the lithium intercalation in RGO while at low cycling rate, both phenomena can occur, determining a decrease of the efficiency of the process. Figure8ashows the relation between the capacity (and spe-cific capacity) at the various cycling rates with the voltage trend. At the lowest rate (25 mA g−1), a specific capacity approaching 460 mAh g−1is obtained. By doubling the spe-cific current, the capacity decreases to about 320 mAh g−1. For further doubling of the specific current, the capacity decreases
to about 280 mAh g−1. A more remarkable capacity decrease is observed when charging the electrode at 200 mA g−1: the specific capacity goes down to 202 mAh g−1.
To establish the discharge performance of the SnRGO elec-trode at different current densities, Peukert dependence is measured. The Peukert law is presented by Eq. (1) [61]:
Cr¼ TdisIkdis ð1Þ
where Crrepresents the rated discharge capacity in (mAh) and Tdis and Idis are the discharge time and discharge current expressed in hours and milliamperes, respectively. The k pa-rameter is the Peukert constant. The Peukert constant provides an indication of the power capability of the cell: the smaller the value of k, the higher the power capability. This parameter is strongly dependent on the battery technology: for lithium-ion technology, this parameter changes between 1.00 and 1.28 [62]. The effective capacity (Ce) is the product of the discharge time and discharge current. By rearranging Eq. (1), we can obtain Eq. (2) in which the effective capacity (Ce) is related to the rated discharge capacity (Cr), Peukert constant (k), and discharge current (Idis)
Ce¼ TdisIdis¼ CrIdis1−k ð2Þ
To evaluate the Peukert constant (k), the specific discharge capacity is plotted as a function of the specific current in a double logarithmic plot as shown in Fig.8b. From the slope of the curve, a Peukert constant (k) of 1.37 is calculated.
Once the PSA–SnRGO electrode is electrochemically characterized and before to use the electrode as an anode in a full LIB cell, the electrochemical behavior of the cathode tape is investigated and Fig.9ashows the discharge voltage trend for the PVAc–LNMO electrode. To quantify the conse-quence of the lithiation rate on the specific capacity, the elec-trode is cycled between 4.85 and 3.0 V at different currents corresponding to the discharge rates of C/10, C/5, C, 2C, and 3C. The charge is performed galvanostatically at C/10 rate up to 4.85 V. The specific capacity based on the weight of the active material in the electrodes varies with the discharge cur-rent. A maximum value of 123 mAh g−1 is obtained by discharging the electrode at 13 mA g−1. By increasing the specific discharge current, the specific capacity decreases but the capacity retention is fairly good: the electrode is able to discharge about 93 % of the C/10 capacity when discharged at specific current 10 times higher and about 86 % of the C/10 capacity when discharged at currents 30 times higher. The correlation between the electrode performance and the dis-charge current is better shown in Fig.9b, reporting in a double logarithmic plot the specific capacity as a function of the spe-cific discharge current. Also, in this case, a linear behavior is observed. The k parameter is evaluated to be 1.037. The low value of the k parameter is probably related to the nanometric
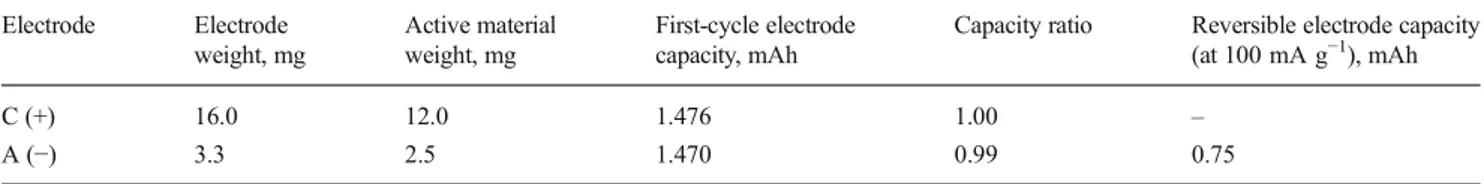
size of the LNMO that allows to cycle the electrode with good utilization at every discharge rate. Once the electrochemical properties of the positive electrode are evaluated, a full lithium-ion battery cell is built by coupling the PSA– SnRGO and the PVAc–LNMO electrodes. The characteristics of the positive and negative electrodes used to assemble the lithium-ion battery cell are reported in Table1. The battery is perfectly balanced with the ratio between the anode and cath-ode capacity being equal to 1.0. An initial electrochemical test is carried out by cycling the battery at 0.2 mA. Two end con-ditions are set in charge regarding the maximum charging capacity (1.0 mAh) and the maximum allowed voltage (4.95 V). The battery is discharged at the same current down to 2.0 V. Figure10ashows the charge/discharge voltage pro-files for the cell. In the first two charge cycles, the cell is able
to charge the maximum amount of allowed capacity (1.0 mAh) without reaching the end voltage condition. Starting from the third cycle, the charge is stopped because the cell reaches the end voltage condition. In the first dis-charge, only a part of the capacity inserted into the electrode is discharged (about 0.34 mAh). The irreversible first-cycle capacity is about 66 %. The high value of the irreversible capacity is due to the fact that during the first cycle, the cell is not completely charged. After the second cycle, the cell is almost completely charged and the discharge capacity in-creases to 0.65 mA. The second-cycle discharge capacity is about 76 % of the capacity in charge. During the second cycle, the discharge capacity increased because the irreversible ca-pacity is almost completely consumed during the previous charge cycle. At the third cycle, the cell discharges the
0.0 0.1 0.2 0.3 0.4 0.5 0.6 0.0 0.5 1.0 1.5 2.0 2.5 0 100 200 300 400 500 600 0.0 0.5 1.0 1.5 2.0 2.5
Specific capacity / mAh g-1
Cell voltage / V Capacity / mAh
a
200 mA g-1 100 mA g-1 50 mA g-1 25 mA g-1 100 100 100 100 300 300 20 500 200 300 400 50 20 50b
Specific capacity = 3.17*(Specific current)-0.37
500
400
300
200
Specific capacity / mAh g
-1
Specific current / mA g-1
Fig. 8 a Voltage profiles as a function of the capacity for the electrode described in Fig.7cycled at various discharge rates. b Double logarithmic plot reporting the specific capacity as a function of the specific current
0.0 0.2 0.4 0.6 0.8 1.0 1.2 1.4 1.6 3.2 3.4 3.6 3.8 4.0 4.2 4.4 4.6 4.8 5.0 0 20 40 60 80 100 120 3.2 3.4 3.6 3.8 4.0 4.2 4.4 4.6 4.8 5.0
Specific capacity / mAh g-1
Cell voltage / V Capacity / mAh 260 mA g-1 130 mA g-1 26 mA g-1 390 mA g-1 13 mA g-1
a
10 100 100 10 100 100 130 500b
90 130 500Specific capacity = 2.12*(Specific current)-0.037
Specific capacity / mAh g
-1
Specific current / mA g-1
Fig. 9 a Voltage profiles as a function of the capacity for a PVAc–LNMO electrode cycled in a lithium cell at various discharge currents. b Double logarithmic plot reporting the specific capacity as a function of the
specific current. The weight of the electrode active material is 11.7 mg. The active material load for unit area is 10.35 mg cm2
maximum capacity (about 0.68 mAh). The discharge process-es in the following cyclprocess-es are all similar to each other as regard the voltage profiles but differ in that the capacity tends to decrease with the progress of the number of cycles. To illus-trate the origin of the first-cycle irreversible capacity and the better reversible charge/discharge behavior exhibited at the second cycle, the calculated dQdE−1vs. V differential profiles for the 2 cycles is shown in Fig.10b. The differential profile of the first charge shows an amount of capacity exchanged by an
irreversible process in the voltage range 2.5 to 3.5 V (A). A further source of irreversible capacity can be observed be-tween 3.7 and 4.3 V (B). Process A is completely irreversible because it disappears during the second charge step, while process B is partially reversible because a part of it is also observed during the second charge step. A third charge pro-cess started just after 4.3 V, but it is stopped because the cell reached one of the end charge conditions (the maximum charge capacity is set to 1.0 mAh). In the first discharge step,
Table 1 Characteristics of the positive and negative electrodes used to assemble the lithium-ion battery cell. To calculate the first-cycle capacity, a specific capacity of 588 and 123 mAh g−1is used for the SnRGO and
the LNMO, respectively. To calculate the reversible capacity of the cell, a specific capacity of 300 mAh g−1is used for the SnRGO electrode
Electrode Electrode weight, mg Active material weight, mg First-cycle electrode capacity, mAh
Capacity ratio Reversible electrode capacity (at 100 mA g−1), mAh C (+) 16.0 12.0 1.476 1.00 – A (−) 3.3 2.5 1.470 0.99 0.75 0.0 0.2 0.4 0.6 0.8 1.0 0 1 2 3 4 5 0 100 200 300 400 0 1 2 3 4 5 Following cycles Firts cycle Cell voltage / V
Cell capacity / mAh
a
2.0 2.5 3.0 3.5 4.0 4.5 5.0 -1.5 -1.0 -0.5 0.0 0.5 1.0 1.5 2.0 2.5 3.0 2.0 2.5 3.0 3.5 4.0 4.5 5.0 -1.5 -1.0 -0.5 0.0 0.5 1.0 1.5 2.0 2.5 3.0b
(E) (D) (C) (B) (A) dQ dE -1 / mAh V -1 Voltage vs. Li/Li+ / V 0 2 4 6 8 10 12 14 16 0.3 0.4 0.5 0.6 0.7 0.8 0.9 1.0 0 2 4 6 8 10 12 14 16 0.0 0.2 0.4 0.6 0.8 1.0c
Coulombic efficiencyCell capacity / mAh
Cycle number
Ch. Cap. ([mAh]) Dis. Cap. ([mAh]) Efficiency
Fig. 10 a Voltage profiles for the first 15 cycles as a function of the capacity for a PVAc–LNMO//PSA–SnRGO Li-ion battery cell cycled at 0.2 mA. b Differential dQdE−1vs. E curves corresponding to the voltage profiles shown in a. c Capacity (in charge and discharge) and charge
coefficient as a function of the number of cycles. The weights of the electrode active materials for the cathode and the anode are 12.0 and 2.5 mg, respectively. The active material loads for unit area for the cath-ode and the ancath-ode are 10.61 and 2.21 mg cm2, respectively
the accumulated capacity is released between 4.3 and 3.3 V (C). In this voltage range, it is possible to observe three peaks located at 4.14, 3.95, and 3.90 V. These peaks are also observ-able during the second discharge step although with a small shift with respect to the previous cycle. During the second charge step, process B is strongly reduced in intensity while a large capacity is accumulated between 4.3 and 4.7 V (D) with a peak centered at 4.5 V. In the second discharge step, a correspondent reduction wave is observed between 4.6 and 4.3 V (E). The cycle life of the cell can be observed in Fig.10bwhere the capacity in charge and discharge is related to the cycle number. In the same figure, the charge coefficient (right axis) is also reported. As previously described, the dis-charge capacity increases during the first 3 cycles, taking up to 0.68 mAh, and then slowly decreases. At the same time also, the charge capacity decreases so that the Coulombic efficiency
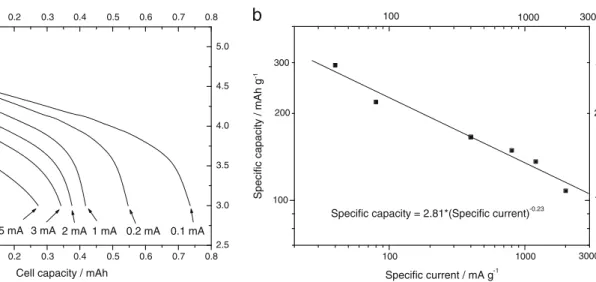
increases with the progress of the number of cycles, rising to 0.95 at the 15th cycle. At this point, the capacity is reduced down to 0.52 mAh. In order to estimate the effect of the dis-charge rate on the capacity, the cell is cycled at various current densities. The charge is performed galvanostatically at 0.1 mA up to 4.95 V. Figure11ashows the voltage behavior of the LIB cell. When discharged at the lower discharge rate (0.1 mA), the battery is able to provide the theoretical reversible capacity (0.75 mAh). By increasing the discharge current, a decrease in the specific capacity and in the average discharge voltage is observed. The specific capacity decreases to about 0.54 mAh by doubling the current; at 0.41 mAh, by increasing the dis-charge current of 10 times; and at 0.27 mAh, by increasing the discharge current of 50 times. The effect of the discharge rate on the performance of the material is summarized in Fig.11b
in which the specific capacity is reported as a function of the
-0.1 0.0 0.1 0.2 0.3 0.4 0.5 0.6 0.7 0.8 2.5 3.0 3.5 4.0 4.5 5.0 -0.1 0.0 0.1 0.2 0.3 0.4 0.5 0.6 0.7 0.8 2.5 3.0 3.5 4.0 4.5 5.0 5 mA 3 mA 2 mA 1 mA 0.2 mA 0.1 mA Cell voltage / V
Cell capacity / mAh
a
100 1000 100 3000 1000 100 100 200b
3000 300 200 300Specific capacity = 2.81*(Specific current)-0.23
Specific capacity / mAh g
-1
Specific current / mA g-1
Fig. 11 a Voltage profiles as a function of the capacity for the Li-ion battery cell described in fig.10cycled at various discharge currents (the current values are reported in the figure). b Double logarithmic plot
reporting the specific capacity as a function of the specific discharge current 0 20 40 60 80 100 120 0.0 0.1 0.2 0.3 0.4 0.5 0.6 0.7 0.8 0 20 40 60 80 100 120 0.0 0.1 0.2 0.3 0.4 0.5 0.6 0.7 0.8
b
Cell capacity / mAh
Cycle number 0.1 mA 0.2 mA 1.0 mA 2.0 mA 3.0 mA 5.0 mA 100 1000 10000 1000 100 1000 10000 1000 300 2000
a
300 2000 Specific energy / Wh kg -1 Specific power / W kg-1Fig. 12 a Double logarithmic plot of the specific energy as a function of the specific power (Ragone plot). The specific values are referred to the weight of the active material in the anode. b Discharge capacity as a
function of the number of cycle number for the Li-ion battery cell de-scribed in Fig.10cycled at various discharge rates
specific discharge current in a double logarithmic plot (both the specific values are referred to the weight of the active material in the anode electrode). A linear behavior is observed between the discharge current and the cell capacity: from the slope of the linear interpolation fit, a value of 1.23 is found for the k parameter. This value is slightly lower than the value found for the PSA–SnRGO electrode, and it confirms that the kinetic of the lithium-ion battery cell is anode limited. The effect of the discharge rate on the performance of the material is summarized in the Ragone plot depicted in Fig.12ain which the specific energy is reported as a function of the specific power in a double logarithmic plot. The specific values are referred to the weight of the active material in the anode. The Ragone plot shows that at low power, the specific energy is about 1210 Wh kg−1 and it is reduced at about 383 Wh kg−1when the cell is discharged at a specific power in excess of 7000 W kg−1. The cyclability of the lithium-ion battery cell is shown in Fig.12bwhere the specific capacity is plotted as a function of the cycle number. The capacity fading is pronounced and ranges between 0.5 and 0.55 % per cycle as a function of the discharge rate.
Conclusions
In this paper, we studied the electrochemical performance of a high-voltage lithium-ion battery cell using Sn-decorated RGO and LNMO as the anode and the cathode, respectively. Microwave-assisted hydrothermal synthesis method allowed to prepare a Sn-decorated GO composite material. As con-firmed by XRD analysis and TGA measurement, the GO is almost completely reduced by thermal annealing in H2/Ar atmosphere while the SnO2is only partially reduced. The tin content in the composite expressed as SnO2is 8.76 wt%. The material presents a compact structure in which graphene layers are stacked and wrapped around each other with spher-ical tin-based particles deposited on the surface of the graphene sheets. The tin-based particles have a size ranging from 200 nm up to 400 nm and are highly dispersed on the RGO surface. An electrode tape with a thickness of about 55 m is obtained using a commercially available acrylic–sty-rene copolymer (Pattex PL50). The so-obtained electrode tape shows a good homogeneity between the various chemical el-ements constituting the electrode. The electrode surface ap-pears rough due to the presence of edges, holes, and cracks. The electrode is found stable up to 200 °C, and it starts to decompose at 230 °C. The electrochemical characterization shows that a large irreversible capacity affects the electrode. This irreversible capacity is related to the degradation of the electrolyte, to the formation of a passivation layer on the elec-trode surface, and to the reduction of SnO2to Sn. The irre-versible capacity is not limited to the first cycle, but it also affects the subsequent cycles. Furthermore, the irreversible
capacity increases by decreasing the charge/discharge rate. This behavior is explained considering the faster kinetics of the lithium insertion into the material with respect to the ki-netics of the parasitic reaction responsible of the irreversible capacity. The positive electrode of the lithium-ion battery is prepared using a procedure similar to that reported for the preparation of the anode and using PVAc as the binder. The electrochemical performance of both the electrodes is evalu-ated at various current densities. The Peukert constant is cal-culated for both the electrodes to characterize the system re-sponse in power. It results that the positive electrode is more performing in power with respect to the negative one. The good response exhibited by the positive electrode is related to the nanometric size of the LNMO used for the preparation of the electrode. The electrochemical performance of the full lithium-ion battery cell built by coupling the PSA–SnRGO and the PVAc–LNMO electrodes is found corresponding to the expectations. In the first lithiation cycle, due to the large first-cycle irreversible capacity, only 34 % of the capacity inserted into the electrode is discharged. The irreversible ca-pacity decreases in the following cycles and the Coulombic efficiency increases rising to 0.95 at the 15th cycle. When discharged at the lower discharge current, the battery is able to provide its theoretical reversible capacity (0.75 mAh). The specific capacity decreases to about 0.41 mAh by increasing the discharge current of 10 times and at 0.27 mAh by increas-ing the discharge current of 50 times. A value of 1.23 is found for the Peukert constant. This value is slightly lower than the value found for the PSA–SnRGO anode electrode (1.37), and it confirms that the kinetics of the lithium-ion battery cell is anode limited. The Ragone plot shows that at low power, the specific energy, based on the weight of the active material in the negative electrode, is about 1210 Wh kg−1and it reduces at about 383 Wh kg−1when the cell is discharged at a specific power in excess of 7000 W kg−1. Relatively high capacity fading affects the cell performance with the progress of the cycle number. The capacity fading ranges between 0.5 and 0.55 % per cycle as a function of the discharge rate.
Acknowledgments Part of this work is carried out within the activities BRicerca Sistema Elettrico^ funded through contributions to research and development by the Italian Ministry of Economic Development.
References
1. Kim D, Kang S-H, Balasubramanian M, Johnson CS (2010) High-energy and high-power Li-rich nickel manganese oxide electrode materials. Electrochem Communic 12:1618–1621
2. Kraytsberg A, Ein Eli Y (2012) Higher, stronger, better. A review of 5 volt cathode materials for advanced lithium-ion batteries. Adv Energy Mater 2:922–939
3. Wachtler M, Besenhard JO, Winter M (2001) Tin and tin-based intermetallics as new anode materials for lithium-ion cells. J Power Sources 94:189–193
4. Zhong Q, Bonakdarpour A, Zhang M, Gao MY, Dahn JR (1997) Synthesis and electrochemistry of LiNixMn2-xO4. J Electrochem Soc 144:205–213
5. Park JS, Roh KC, Lee J-W, Song K, Kim Y-I, Kang Y-M (2013) Structurally stabilized LiNi0.5Mn1.5O4with enhanced electrochem-ical properties through nitric acid treatment. J Power Sources 230: 138–142
6. Okumura T, Shikano M, Kobayashi HJ (2013) Contribution of oxygen partial density of state on lithium intercalation/de-intercalation process in LixNi0.5Mn1.5O4spinel oxides. J Power Sources 244:544–547
7. Bhaskar NA, Dixon D, Yavuz M, Nikolowski K, Lu L, Eichel R-A, Ehrenberg H (2014) Improving the rate capability of high voltage lithium-ion battery cathode material LiNi0.5Mn1.5O4by ruthenium doping. J Power Sources 267:533–541
8. Liu D, Trottier J, Charest P, Frechette J, Guerfi A, Mauger A, Julien CM, Zaghib K (2012) Effect of nano LiFePO4 coating on LiMn1.5Ni0.5O45V cathode for lithium ion batteries. J Power Sources 204:127–132
9. Zhu Z, Yan H, Zhang D, Li W, Lu Q (2013) Preparation of 4.7 V cathode material LiNi0.5Mn1.5O4by an oxalic acid-pretreated solid-state method for lithium-ion secondary battery. J Power Sources 224:13–19
10. Liu D, Zhu W, Trottier J, Gagnon C, Barray F, Guerfi A, Mauger A, Groult H, Julien CM, Goodenough JB, Zaghib K (2014) Spinel materials for high-voltage cathodes in Li-ion batteries. RSC Adv 4:154–167
11. Kim JH, Pieczonka NPW, Yang L (2014) Challenges and ap-proaches for high-voltage spinel lithium-ion batteries. Chem Phys Chem 15:1940–1954
12. Yang J, Wachtler M, Winter M, Besenhard JO (1999) Sub-microcrystalline Sn and Sn-SnSb powders as lithium storage mate-rials for lithium-ion batteries. Electrochem Solid-State Lett 2:161– 163
13. Zhao XB, Cao GS, Lv CP, Zhang LJ, Hu SH, Zhu TJ, Zhou BC (2001) Electrochemical properties of some Sb or Te based alloys for candidate anode materials of lithium-ion batteries. J Alloys Comp 315:265–269
14. Hamon Y, Brousse T, Jousse F, Topart P, Buvat P, Schleich DM (2001) Aluminum negative electrode in lithium ion batteries. J Power Sources 97–98:185–187
15. Weydanz WJ, Wohlfahrt-Mehrens M, Huggins RA (1999) A room temperature study of the binary lithium–silicon and the ternary lith-ium–chromium–silicon system for use in rechargeable lithium bat-teries. J Power Sources 81–82:237–242
16. Wang B, Luo B, Li XL, Zhi LJ (2012) The dimensionality of Sn anodes in Li-ion batteries. Mater Today 15:544–552
17. Shiva K, Jayaramulu K, Rajendra HB, Maji TK, Bhattacharyya AJ (2014) In-situ stabilization of tin nanoparticles in porous carbon matrix derived from metal organic framework: high capacity and high rate capability anodes for lithium-ion batteries. Z Anorg Allg Chem 640:1115–1118
18. Fan XL, Shao J, Xiao XZ, Wang XH, Li SQ, Ge HW, Chen LX, Wang CS (2014) In situ synthesis of SnO2nanoparticles encapsu-lated in micro/mesoporous carbon foam as a high-performance an-ode material for lithium ion batteries. J Mater Chem A 2:18367– 18374
19. Nithya C, Gopukumar S (2013) Reduced graphite oxide/nano Sn: a superior composite anode material for rechargeable lithium-ion bat-teries. ChemSusChem 6:898–904
20. Boukamp BA, Lesh GC, Huggins RA (1981) All-solid lithium electrodes with mixed conductor matrix. J Electrochem Soc 128: 725–729
21. Takamura T, Endo K, Fu L, Wu Y, Lee K, Matsumoto T (2007) Identification of nano-sized holes by TEM in the graphene layer of
graphite and the high rate discharge capability of Li-ion battery anodes. Electrochim Acta 53:1055–1061
22. Novoselov KS, Jiang D, Schedin F, Booth TJ, Khotkevich VV, Morozov SV, Geim AK (2005) Two-dimensional atomic crystals. Proc Natl Acad Sci U S A 102:10451–10453
23. Wan D, Yang C, Lin T, Tang Y, Zhou M, Zhong Y, Huang F, Lin J (2012) Low-temperature aluminum reduction of graphene oxide, electrical properties, surface wettability, and energy storage appli-cations. ACS Nano 6:9068–9078
24. Stankovich S, Dikin DA, Piner RD, Kohlhaas KA, Kleinhammes A, Jia Y, Wu Y, Nguyen ST, Ruoff RS (2007) Synthesis of graphene-based nanopapers via chemical reduction of exfoliated graphite oxide. Carbon 45:1558–1565
25. Wang G, Yang J, Park J, Gou X, Wang B, Liu H (2008) Facile synthesis and characterization of graphene nanopapers. J Phys Chem C 112:8192–8195
26. Si Y, Samulski ET (2008) Synthesis of water soluble graphene. Nano Lett 8:1679–1682
27. Fan ZJ, Wang K, Yan J, Wei T, Zhi LJ, Feng J, Ren YM, Song LP, Wei F (2011) Facile synthesis of graphene nanopapers via Fe re-duction of exfoliated graphite oxide. ACS Nano 5:191–198 28. Fan ZJ, Wang K, Wei T, Yan J, Song LP, Shao B (2010) An
envi-ronmentally friendly and efficient route for the reduction of graphene oxide by aluminum powder. Carbon 48:1670–1692 29. Zhu YW, Stoller MD, Cai WW, Velamakanni A, Piner RD, Chen D
(2010) Exfoliation of graphite oxide in propylene carbonate and thermal reduction of the resulting graphene oxide platelets. ACS Nano 4:1227–1233
30. Compton OC, Jain B, Dikin DA, Abouimrane A, Amine K, Nguyen ST (2011) Chemically active reduced graphene oxide with tunable C/O ratios. ACS Nano 5:4380–4391
31. Wen ZH, Cui SM, Kim HJ, Mao S, Yu KH, Lu GH, Pu HH, Mao O, Chen JH (2012) Binding Sn-based nanoparticles on graphene as the anode of rechargeable lithium ion batteries. J Mater Chem 22: 3300–3306
32. Yue WB, Yang S, Ren Y, Yang XJ (2013) In situ growth of Sn, SnO on graphene nanosheets and their application as anode materials for lithium-ion batteries. Electrochim Acta 92:412–420
33. Sathish M, Mitani S, Tomai T (2012) Nanocrystalline tin compounds/graphene nanocomposite electrodes as anode for lithium-ion battery. J Solid State Chem 16:1767–1774
34. Chen SQ, Wang Y, Ahn H (2012) Microwave hydrothermal syn-thesis of high performance tin-graphene nanocomposites for lithi-um ion batteries. J Power Sources 216:22–27
35. Liang SZ, Zhu XF, Lian PC (2011) Superior cycle performance of Sn@C/graphene nanocomposite as an anode material for lithium-ion batteries. J Solid State Chem 184:1400–1404
36. Wang DN, Li XF, Yang JL, Wang JJ, Geng DS, Li RY, Cai M, Sham TK, Sun XL (2013) Hierarchical nanostructured core–shell Sn@C nanoparticles embedded in graphene nanosheets: spectroscopic view and their application in lithium ion batteries. Phys Chem Chem Phys 15:3535–3542
37. Qin J, He C, Zhao N, Wang Z, Shi C, Liu E-Z, Li J (2014) Graphene networks anchored with Sn@graphene as lithium ion battery anode. ACS Nano 8:1728–1738
38. Zou Y, Wang Y (2011) Sn@CNT nanostructures rooted in graphene with high and fast Li-storage capacities. ACS Nano 5:8108–8114
39. Luo B, Wang B, Li XL, Jia YY, Liang MH, Zhi LJ (2012) Graphene-confined Sn nanosheets with enhanced lithium storage capability. Adv Mater 24:3538–3543
40. Luo B, Wang B, Liang MH, Ning J, Li XL, Zhi LJ (2012) Reduced graphene oxide-mediated growth of uniform tin-core/carbon-sheath coaxial nanocables with enhanced lithium ion storage properties. Adv Mater 24:1405–1409
41. Ji LW, Tan ZK, Kuykendall T, An EJ, Fu YB, Battaglia V, Zhang YG (2011) Multilayer nanoassembly of Sn-nanopillar arrays sandwiched between graphene layers for high capacity lithium stor-age. Energy Environ Sci 4:3611–3616
42. Wang GX, Wang B, Wang XH, Park J, Dou SX, Ahn H, Kim K (2009) Sn/graphene nanocomposite with 3D architecture for en-hanced reversible lithium storage in lithium ion batteries. J Mater Chem 19:8378–8384
43. Li YY, Li ZS, Shen PK (2013) Simultaneous formation of ultrahigh surface area and three-dimensional hierarchical porous graphene-like networks for fast and highly stable supercapacitors. Adv Mater 25:2474–2480
44. Zhang WM, Hu JS, Guo YG, Zheng SF, Zhong LS, Song WG, Wan LJ (2008) Tin-nanoparticles encapsulated in elastic hollow carbon spheres for high-performance anode material in lithium-ion batte-ries. Adv Mater 20:1160–1165
45. Xu YH, Liu Q, Zhu YJ, Liu YH, Langrock A, Zachariah MR, Wang CS (2013) Uniform nano-Sn/C composite anodes for lithium ion batteries. Nano Lett 13:470–474
46. Su YZ, Li S, Wu DQ, Zhang F, Liang HW, Gao PF, Cheng C, Feng XL (2012) Two-dimensional carbon-coated graphene/ metal oxide hybrids for enhanced lithium storage. ACS Nano 6:8349–8356
47. Zhong C, Wang JZ, Chen ZX, Liu HK (2011) SnO2-graphene com-posite synthesized via an ultrafast and environmentally friendly microwave autoclave method and its use as a superior anode for lithium-ion batteries. J Phys Chem C 115:25115–25120
48. Zhu X, Zhu Y, Murali S, Stoller MD, Ruoff RS (2011) Reduced graphene oxide/tin oxide composite as an enhanced anode material for lithium ion batteries prepared by homogenous coprecipitation. J Power Sources 196:6473–6477
49. Harrison KL, Manthiram A (2011) Microwave-assisted solvothermal synthesis and characterization of metastable LiFe1−x(VO)xPO4cathodes. Inorg Chem 50:3613–3620 50. Yoon S, Manthiram A (2011) Microwave-hydrothermal synthesis
of W0.4Mo0.6O3and carbon-decorated WOx-MoO2nanorod anodes for lithium ion batteries. J Mater Chem 21:4082–4085
51. Birrozzi A, Raccichini R, Nobili F, Marinaro M, Tossici R, Marassi R (2014) High-stability graphene nano sheets/SnO2composite an-ode for lithium ion batteries. Electrochim Acta 137:228–234 52. Fukuda K, Kikuya K, Isono K, Yoshio M (1997) Foliated natural
graphite as the anode material for rechargeable lithium-ion cells. J Power Sources 69:165–168
53. Maroni F, Raccichini R, Birrozzi A, Carbonari G, Tossici R, Croce F, Marassi R, Nobili F (2014) Graphene/silicon nanocomposite an-ode with enhanced electrochemical stability for lithium-ion battery applications. J Power Sources 269:873–882
54. Cote LJ, Cruz-Silva R, Huang J (2009) Flash reduction and pattern-ing of graphite oxide and its polymer composite. J Am Chem Soc 131:11027–11032
55. Reza-Azimi H, Rezaei M, Majidi F (2014) The non-isothermal degradation kinetics of St-MMA copolymers. Polym Degrad Stab 99:240–248
56. Meschini I, Nobili F, Mancini M, Marassi R, Tossici R, Savoini A, Focarete ML, Croce F (2013) High-performance Sn@carbon nano-composite anode for lithium batteries. J Power Sources 226:241– 248
57. Nobili F, Meschini I, Mancini M, Tossici R, Marassi R, Croce F (2013) High-performance Sn@carbon nanocomposite anode for lithium-ion batteries: lithium storage processes characterization and low-temperature behavior. Electrochim Acta 107:85–92 58. Kaskhedikar NA, Maier J (2009) Lithium storage ion carbon
nano-structures. Adv Mater 21:2664–2680
59. Zheng T, McKinnon WR, Dahn JR (1996) Hysteresis during lithi-um insertion in hydrogen-containing carbons. J Electrochem Soc 143:2137–2145
60. Botas C, Carriazo D, Singh G, Rojo T (2015) Sn– and SnO2– graphene flexible foams suitable as binder-free anodes for lithium ion batteries. J Mater Chem A 3:13402–13410
61. Peukert W (1897) Über die Abhänigkeit der Kapazität von der Entladestromstärke bei Bleiakkumulatoren. Elektrotechnisch Z 27:287–288
62. Omar N, Van den Bossche P, Coosemans T, Van Mierlo J (2013) Peukert revisited-critical appraisal and need for modification for lithium-ion batteries. Energies 6:5625–5641