Article
Matching Visual and Acoustic Mirror Forms
Ivana Bianchi1,*, Roberto Burro2, Roberta Pezzola3and Ugo Savardi21 Department of Humanities, University of Macerata, Macerata 62100, Italy
2 Department of Human Sciences, University of Verona, Verona 37129, Italy; [email protected] (R.B.); [email protected] (U.S.)
3 Guitar Maestro, Fermo 63900, Italy; [email protected]
* Correspondence: [email protected]; Tel.: +39-0733-258-4320 Academic Editor: Marco Bertamini
Received: 24 January 2017; Accepted: 2 March 2017; Published: 10 March 2017
Abstract:This paper presents a comparative analysis of the ability to recognize three mirror forms in visual and acoustic tasks: inversion (reflection on a horizontal axis), retrograde (reflection on a vertical axis) and retrograde inversion (reflection on both horizontal and vertical axes). Dynamic patterns consisting of five tones in succession in the acoustic condition and five square dots in succession in the visual condition were presented to 180 non-musically expert participants. In a yes/no task, they were asked to ascertain whether a comparison stimulus represented the “target” transformation (i.e., inversion, retrograde or retrograde inversion). Three main results emerged. Firstly, the fact that symmetry pertaining to a vertical axis is the most easily perceived does not only apply to static visual configurations (as found in previous literature) but also applies to dynamic visual configurations and acoustic stimuli where it is in fact even more marked. Secondly, however, differences emerged between the facility with which the three mirror forms were recognized in the acoustic and visual tasks. Thirdly, when the five elements in the stimulus were not of the same duration and therefore a rhythmic structure emerged, performance improved not only in the acoustic but also (even more significantly) in the visual task.
Keywords: visual symmetry; acoustic symmetry; mirror form detection; inversion; retrograde; retrograde inversion; dynamic stimuli
1. Introduction
Over the years psychologists have devoted a lot of attention to the perception of visual symmetry ([1]; for a review, see [2,3]). Extensive experimental research has demonstrated convincingly that mirror symmetry on a vertical axis is easier to identify than mirror symmetry on a horizontal or oblique axis [4–16], even at very short exposure times [4,9,17–21]. There is also evidence that infants are already able at the age of 4 months to distinguish symmetry on a vertical axis from other forms of visual symmetry [22–27]. This has led scholars to theorize that a hardwired mechanism underlies the human perception of mirror reflections, in particular on a vertical axis.
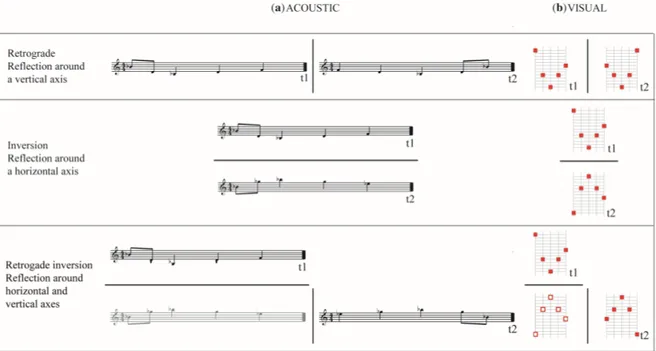
In contrast, only a few studies, carried out some time ago, have investigated the recognition of acoustic symmetry (known as “mirror forms”) in non-expert listeners [28–33]. Furthermore, to the best of our knowledge, there is no previous study on whether it is possible to create a systematic parallel between the ability to recognize the same mirror forms in two sense modalities, in this case visual and acoustic. The experiment described in the present paper addresses this issue and to this end the participants carried out both an acoustic recognition task and a visual recognition task. In the acoustic task, short melodies consisting of a sequence of five notes were presented to the participants, immediately followed by another melody which was one of the three possible mirror transformations of the initial melody (Figure1a): retrograde (i.e., the notes are played in reversed order) which correspond
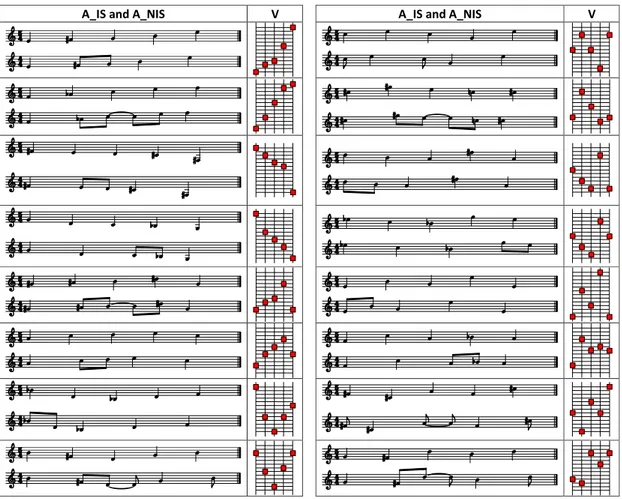
to a reflection around a vertical axis; inversion (i.e., the initial melody is played with the intervals inverted, so that for example a rising minor third becomes a falling minor third) which corresponds to a reflection around a horizontal axis or retrograde inversion (i.e., the inverted notes are played in retrograde) which corresponds to a double reflection around both horizontal and vertical axes. Corresponding stimuli were presented in the visual tasks (see AppendixA). In this case, the initial stimulus consisted of a sequence of five dots, appearing one after the other, and the subsequent comparison stimulus consisted of another sequence of five dots which represented one of the three mirror transformations of the initial pattern (Figure1b).
Symmetry 2017, 9, 39 2 of 20
intervals inverted, so that for example a rising minor third becomes a falling minor third) which corresponds to a reflection around a horizontal axis or retrograde inversion (i.e., the inverted notes are played in retrograde) which corresponds to a double reflection around both horizontal and vertical axes. Corresponding stimuli were presented in the visual tasks (see Appendix A). In this case, the initial stimulus consisted of a sequence of five dots, appearing one after the other, and the subsequent comparison stimulus consisted of another sequence of five dots which represented one of the three mirror transformations of the initial pattern (Figure 1b).
Figure 1. A representation of the three types of transformation (mirror forms) studied in: (a) acoustic
task; and (b) visual task. The standard stimulus was presented first (t1), then the comparison stimulus (t2) followed after a 1 s Inter Stimulus Interval (ISI).
Visual and acoustic perception are two different sense modalities with different underlying physiological mechanisms and therefore differences in people’s ability to detect the three symmetrical transformations in the two sense modalities are to be expected. However, cross modal correspondence is a well-known phenomenon in psychology [33–36]. It is implied in one of the traditional methods used in psychophysics, i.e., cross modal matching, in which people are asked to match the apparent intensity of various stimuli across two sensory modalities (e.g., adjusting the brightness of a light to match the loudness of a sound). Experimental tasks in which people are asked to identify an object which they have been shown by means of touch have also been used (for instance, in Sperry’s famous split brain experiment [37]) as well as a shape-sound matching task which was first described in the “takete-maluma” study [38,39]. Over the years, cross modal correspondence has been consistently found with reference to a variety of sensory modalities but the phenomenon is very well documented for visual and acoustic modalities. The perception of an invariant relationship between audio and visual stimulation emerges at very precocious ages. At 4–5 months infants are able to detect synchrony between visual and acoustic stimuli [40,41], to make associations between sounds and changes in the direction of a movement [42,43], to match faces and voices (e.g., [44,45]) and to recognize similarities between the common rhythmic structures, tempo, and duration of auditory and visual events ([46–48]; see [49], for a review). Within this cross-modal context it is also well known that humans spontaneously describe auditory pitch spatially (e.g., [50–52]). The correspondence between symmetrical acoustic and visual patterns addressed in the present study is based precisely on this spatial correspondence: the vertical distance between the dots in the visual stimuli corresponds to the distance between the notes in the acoustic stimuli which indicates the pitch (see Appendix A).
Figure 1.A representation of the three types of transformation (mirror forms) studied in: (a) acoustic task; and (b) visual task. The standard stimulus was presented first (t1), then the comparison stimulus (t2) followed after a 1 s Inter Stimulus Interval (ISI).
Visual and acoustic perception are two different sense modalities with different underlying physiological mechanisms and therefore differences in people’s ability to detect the three symmetrical transformations in the two sense modalities are to be expected. However, cross modal correspondence is a well-known phenomenon in psychology [33–36]. It is implied in one of the traditional methods used in psychophysics, i.e., cross modal matching, in which people are asked to match the apparent intensity of various stimuli across two sensory modalities (e.g., adjusting the brightness of a light to match the loudness of a sound). Experimental tasks in which people are asked to identify an object which they have been shown by means of touch have also been used (for instance, in Sperry’s famous split brain experiment [37]) as well as a shape-sound matching task which was first described in the “takete-maluma” study [38,39]. Over the years, cross modal correspondence has been consistently found with reference to a variety of sensory modalities but the phenomenon is very well documented for visual and acoustic modalities. The perception of an invariant relationship between audio and visual stimulation emerges at very precocious ages. At 4–5 months infants are able to detect synchrony between visual and acoustic stimuli [40,41], to make associations between sounds and changes in the direction of a movement [42,43], to match faces and voices (e.g., [44,45]) and to recognize similarities between the common rhythmic structures, tempo, and duration of auditory and visual events ([46–48]; see [49], for a review). Within this cross-modal context it is also well known that humans spontaneously describe auditory pitch spatially (e.g., [50–52]). The correspondence between symmetrical acoustic and visual patterns addressed in the present study is based precisely on this spatial correspondence:
the vertical distance between the dots in the visual stimuli corresponds to the distance between the notes in the acoustic stimuli which indicates the pitch (see AppendixA).
The three transformations studied in the present paper (retrograde transformation, inversion and retrograde inversion) were widely used in theories of compositional techniques originating in the 20th century which were known as dodecaphony. Dowling [30] was the first to investigate and experiment in order to discover whether listeners with no musical experience are able to recognize these three mirror forms. He used short melodies and a short-term recognition memory task in which the participants were presented with musical sequences consisting of five tones of equal duration followed by the corresponding mirror transformation (inversion, retrograde, and retrograde inversion). After being given information about the three kinds of mirror forms, listeners were asked to judge whether the two melodies presented corresponded to one of them. Blocks of trials were run separately for each of the three forms. Performance was above chance for all three forms, although the task turned out to be difficult. At presentation times similar to those used in the present study (i.e., at five tones presented in 2.5 s), the retrograde mirror form was easier to recognize than the inversion form, and both were more easily recognized than the retrograde inversion form. However, in a faster presentation condition (i.e., five tones per second, which means that the overall duration of the stimulus was 1 s), the inversion form turned out to be the easiest with the retrograde intermediate and the retrograde inversion forms proving the most difficult. There were no differences in the ease with which the three mirror forms were recognized in another study [31] with a different experimental task and longer melodies. Participants first listened to some extracts from the Wind Quintet (Op. 26) and the String Quartet (No. 4, Op. 37) by Arnold Schoenberg and became familiar with them. Probe stimuli were then presented, consisting either of the prime form or an inversion of the prime form (beginning on the same tone), the retrograde of the prime form (without transposition) and the retrograde inversion of the prime form (the non-transposed retrograde of the inversion). Participants in the experiment were asked to recognize whether the probe stimulus was a mirror form of the Wind Quintet or the String Quartet (respectively Melodies 1 and 2). Their accuracy was above a chance level performance, but no differences in their performance emerged between the three mirror forms and this was interpreted as an indication that the listeners found it equally easy to recognize the inversion, retrograde and retrograde inversion mirror forms. However, these findings can also be interpreted simply as showing that people have an ability to recognize a certain relatedness between the comparison stimulus and one of the two standard melodies, independently of whether or not they were able to recognize the specific mirror form. Individual differences were found, with accuracy correlated to the level to which the participants had previously studied music. We will go back to the differences in outcomes relating to the experimental conditions in the final discussion.
In one of the conditions studied by Dowling [30], before performing an acoustic task, the participants were presented with an analogous visual recognition task. The standard stimulus (a pattern consisting of five dots which was similar to the notational representations of the melodies in the acoustic experiment) appeared on the left-hand side of the page, while four comparison stimuli were presented on the other side of the page. One of these four configurations was the target mirror form which the participants were required to identify. Only 10 stimuli were used in this preliminary visual phase. Dowling predicted that doing the visual task first would lead to an improvement in performance in the acoustic task since it would provide more information relating to the structure of the configurations to be identified in the subsequent task. Contrary to his prediction, no significant improvements emerged in the condition including the preliminary visual task, and there was in effect only a slight tendency in that direction (i.e., 65% correct responses when there was a preliminary visual task vs. 59% in the acoustic task without the preliminary visual task). In the present study we go beyond the idea of a visual task as a preliminary training task and address a systematic direct comparison between the participants’ performance with corresponding sets of visual and acoustic stimuli (using 96 stimuli for the visual condition and 96 stimuli for the acoustic condition). Moreover, our study provided a bi-directional perspective on the possible facilitator effect of performing the
task across modalities as the two groups of participants performed the two tasks in a different order (i.e., first the visual task and then the acoustic task or vice versa).
There were four main specific aims in this research. The first was to verify whether naïve subjects (i.e., non-expert listeners) are able to recognize mirror forms in acoustic stimuli. The findings in previous literature regarding this issue are controversial. Secondly, we aimed to assess whether there was a difference in performance in the two sense modalities, a comparison made possible by the fact that the participants performed both the visual and acoustic task with corresponding stimuli. This represents the main innovation in the study. The third aim, related to the second, was to explore whether there are cross-modal facilitator effects influencing the ease with which mirror forms are recognized in one sense modality after doing the same task in another sense modality (i.e., when the visual task follows the acoustic task or vice-versa). This might provide insights regarding whether the detection of symmetry in the sequential conditions analyzed in this study are specific to each sensory domain or whether cross modal facilitation effects emerge. The fourth aim was to assess the role of Rhythm. There are contrasting results from previous studies regarding the role of the rhythm of a melody (determined by the varying duration of the notes) on the ability to recognize the three mirror forms. According to some (e.g., [32,53]), non-isochronism makes recognizing the mirror forms easier. In other studies [31,54], it has been found that it is more difficult to recognize melodic patterns with non-isochronous stimuli as compared to isochronous stimuli. It has to be noted, however, that in the latter studies, the isochronous and non-isochronous stimuli also differed in other ways related to their melodic structure and therefore there is no clear evidence that isochronism was the critical factor. All of the stimuli used in the present study were made up of five elements (five tones for the acoustic stimuli and five square dots for the visual stimuli) which appeared one after the other. In one condition (isochronism), all of the elements were of the same duration, i.e., 600 ms, while in another condition (non-isochronism), they were of two different durations, i.e., 400 ms and 800 ms. The study not only made it possible to test the effect of this characteristic (isochronism vs. non-isochronism) in the acoustic condition, but also provided first indications of whether it has a similar role in the recognition of visual symmetry in short dynamic sequences.
2. Materials and Methods 2.1. Participants
180 undergraduate students and adults with no musical expertise participated in the study. All had normal or corrected to normal vision and reported normal hearing. All participants performed both the visual (V) and acoustic task (A), and all responded to both the isochronous and non-isochronous stimuli. Order and Target mirror form were the only two variables which were studied between subjects. Ninety of participants performed the visual task before the acoustic task (order VA), while the other 90 were exposed to the two tasks in the opposite order (AV). The inversion mirror form was the target for 30 participants, the retrograde mirror form was the target for 30 other participants, and the retrograde inversion mirror form was the target for the remaining 30 participants. We opted for a single target detection task rather than asking the participants to classify each stimuli according to which of the three mirror forms it represented, due to the fact that in previous studies it had been found that this type of acoustic task is difficult for non-experts and that it is easier for people to recognize one single target.
The study was approved by the Ethics Committee of the University of Verona as the local ethics committee responsible and was conducted in accordance with the Declaration of Helsinki (revised 2008). All participants gave their written informed consent in accordance with the local ethics committee requirements.
2.2. Procedure
The experiment started with a training phase during which participants were familiarized with all of the three mirror forms (inversion, retrograde, retrograde inversion) by means of three visual representations and three acoustic examples such as those shown in Figure1, one for each of the three mirror forms. The idea behind exposing the participants to all three forms was that this would help them to understand the mechanism by contrasting or differentiating between the various different forms. The participants were allowed to hear and see examples of each of the three mirror forms as many times as they wanted until they felt they were familiar with them. The instructions followed. They were shown on a computer screen and read out by the experimenter. In the instructions, participants were told that four series of 48 stimuli would be presented (192 stimuli in total) and that each stimulus would consist of a pair of short melodies or a pair of visual patterns which were related to each other in terms of one of the three mirror forms. One of these forms was randomly assigned to each participant as his/her “target” and it was explained to them that the task consisted of recognizing whether the pair of melodies or the pair of visual patterns in each stimulus were related in terms of their target mirror form (yes/no task). An interval of 1 s separated the presentation of the standard stimulus and the comparison stimulus. Participants had 3 s to respond (in a response sheet) before the next pair was presented.
Two of the four series of stimuli involved visual stimuli (V), one series of 48 isochronous stimuli and another series of 48 non-isochronous stimuli. The other two series involved the acoustic version of the same stimuli (A), one series of 48 isochronous stimuli and another series of 48 non-isochronous stimuli. Participants in the AV condition were first exposed to the two acoustic series and then to the two visual series; participants in the VA condition were exposed first to the visual series and then to the acoustic series. All of the participants responded to the four series of stimuli, with short pauses of four minutes between one series and the next. The overall duration of the experiment was 36 min.
A stand alone software (programming language: Actionscript 3 for Adobe AIR runtime environments) was used for the presentation of the visual and acoustic stimuli. A Dell P2210 56 cm (22 In.) screen (Dell, Round Rock, TX, USA) with a resolution of 1680×1050 pixels (475×300 mm, equivalent to approximately 43.2×28.1 degrees of visual angle at the recommended viewing distance 650 mm) and a refresh rate of 60 Hz was used for the experiment. The visual stimuli were made up of 1680×1050 pixels and thus filled the entire screen. The visual stimuli consisted of five small square red dots presented in succession, with each dot lasting 600 ms in the isochronous condition, and 400 ms or 800 ms in the non-isochronous condition, and disappearing when the next dot appeared on the screen (i.e., the inter-dot interval was null). Each stimulus started from left to right and was centered with respect to the screen. The acoustic stimuli were created using MakeMusic Finale 2011 (MakeMusic Corporate, Boulder, CO, USA) at a sampling rate of 44,100 Hz–32 bit (and presented with Creative Sound Blaster Audigy FX PCIe 5.1 (Creative Technology, Singapore, Asia) using high quality loudspeakers Audioengine A2+ (Audioengine, Austin, TX, USA). Auditory stimuli were equalized for overall sound pressure using Audition CC 2015 (Adobe Systems Software, San Jose, CA, USA). The stimuli consisted of five tones (Timbre: Guitar; attack: 10 ms; decay: 31 ms). Each tone had an overall duration of 600 ms in the isochronous condition, and 400 ms or 800 ms in the non-isochronous condition. The inter-tone spacing was null.
Both visual and acoustic stimuli lasted a total of 3 s in the isochronous condition (600 ms×
5 elements) and 3.2 s in the non-isochronous condition (800 ms×3 elements + 400 ms×2 elements). 2.3. Stimuli
The number of elements in each acoustic stimulus (i.e., five notes), the overall duration of the stimuli (3–3.2 s), and the duration of the interval between the standard stimulus and the comparison stimulus (i.e., 1 s) were defined based on the previous literature on the same subject (in particular [30]) for the purposes of comparison. Due to the fact that a general finding in previous studies was that it is not easy for untrained listeners to recognize acoustic mirror forms, we followed the criterion
of choosing conditions—not only in terms of duration but also of the types of intervals and the range of tones (octaves)—which facilitated the recognition of the three mirror forms [29,30,32,53–55]. For instance, all of the acoustic stimuli were in a major or minor key, with each stimulus starting with an initial note (either E3 or E4) followed by other notes chosen from among the first, third and fifth notes of the key and an additional non-chord passage note from the same key (that is, either the second, fourth, sixth or seventh note). Moreover, in all of the stimuli used in the acoustic experiment, the five pitches which made up each stimulus varied within a range of one octave, which according to Pedersen [55] is associated with better performance in same/different tasks using melodic patterns. In the present study, it was also necessary to use a narrow range of tones in order to guarantee that the corresponding visual stimuli would be perceived as unified. In fact, according to the proximity law of grouping [56], if there was too great a distance between the five elements in each visual stimulus, then there would have been a risk that the participants would perceive two or more separate groups of elements and not one unified pattern. Lastly, we also controlled other features such as the contour and length of the final interval which, according to previous literature, could influence the ability to recognize acoustic melodies in mirror forms. The complete set of variables used in the creation of the stimuli was as follows:
(i) Sense modality: acoustic (A), visual (V). The stimuli consisted of a short sequence of five tones in the acoustic task and of five square dots appearing in sequence in the visual task. The latter “corresponded” to a visual representation of the acoustic stimuli (see AppendixA).
(ii) Mirror Form: inversion (INV), retrograde (RET), retrograde inversion (RETINV). Three comparison stimuli were obtained for each standard stimulus by means of applying one of the three mirror form transformations: inversion, retrograde or retrograde inversion.
(iii) Rhythm: isochronous (ISO), non-isochronous (N-ISO). The stimuli presented in the isochronous condition were the same as those presented in the non-isochronous condition in terms of the shape of the configuration. What varied was the duration of each of the five tones (A) or dots (V) in the configuration. The duration was fixed at 600 ms in the isochronous condition while in the non-isochronous condition, three elements had a duration of 800 ms (half-notes) and two elements had a duration of 400 ms (quarter-notes). In the non-isochronism condition a grouping effect emerged which meant that the participants perceived a kind of “rhythm” in the succession of the tones or dots. The overall duration of the stimulus (3–3.2 s) made the condition comparable to Dowling’s best performance condition (2.5 s).
(iv) Contour. The shape of the contour was determined by the number of inversion points, as in [30,31], i.e., the points where increments in pitch height (for the acoustic stimuli) or spatial height (for the visual stimuli) are followed by a decrement; or, vice versa, decrements in pitch height (for the acoustic stimuli) or spatial height (for the visual stimuli) are followed by an increment. Given that each stimulus was formed of five notes (or dots), the maximum number of points where there could be an inversion was three, giving a maximum of 14 different possible contours (see Table1). In order to contain the levels of this variable, we selected only eight out of the 14 contours (those which are not in parentheses in Table1). The eight types of contour used in the experiment thus contained 0, 1, 2 or 3 inversion points. In the statistical analyses, contour was a random effect. (v) Final interval: long or short. In [31], the length of the final interval impacted on the participants’
ability to recognize the acoustic mirror forms. Despite the fact that in their experiment the stimuli used were different to those used in the present study as they were longer and characterized by wider octave extensions and a greater tonal and temporal complexity, a decision was made to take this variable into account in the creation of the stimuli with the result that there were two versions of the final interval for each of the eight contours: long (L), i.e., between seven and twelve semitones, and short (S), i.e., less than four semitones. This variable was considered as a random effect in our statistical analyses.
Table 1.Possible types of contour in the five element configurations, defined in terms of increment (+) or decrement (−) of each note/dot as compared to the previous note/dot in terms of pitch height (for the acoustic stimuli, i.e., notes) or spatial height (for the visual stimuli, i.e., dots).
Number of Points of Inversion Contour
0 ++++ 0 −−−− 1 +++− 1 (−−−+) 1 (+−−−) 1 (−+++) 1 (++−−) 1 −−++ 2 (−++−) 2 +−−+ 2 (++−+) 2 −−+− 3 +−+− 3 −+−+
Note: The eight patterns used in the study are those which are not in parentheses.
In total, 192 pairs of stimuli were presented to each participant in the experiment (2 Sense modalities×8 Contours×2 Final intervals×2 Rhythms×3 Mirror forms).
The Target (inversion, retrograde or retrograde inversion mirror forms) and the Order of the two sense modalities (visual-acoustic; acoustic-visual) were studied between subjects. All the other variables—Sense modality (acoustic, visual), Rhythm (isochronism, non-isochronism), Contour (8 levels) and Final Interval (long, short)—varied within subjects.
2.4. Statistics and Data Analysis
Data were analyzed in terms of the Signal Detection Theory (SDT) [57,58]. Responses were classified as either Hit (H), Correct Rejection (CR), False Alarms (FA) or Missing (M). The a priori proportion of “signals” (target stimulus) and noise (non-target stimulus) was 1/3 since all the stimuli presented to participants consisted of three different mirror forms and each participant was requested to target only one of these, meaning that there was one “yes” response and two “no” responses. This was taken into account when calculating the Hit Rate, i.e., the probability of responding “yes” on signal/target trials, and False Alarm Rate, i.e., the probability of responding “yes” on noise/non-target trials. In SDT, the binary answers (i.e., yes/no) of a set of participants are modeled as being influenced by two distinct factors, a perceptual sensitivity component and a response bias. In other words, two people with similar perceptual sensitivity capabilities may have different inclinations to answer “yes” or “no”, or they might modify their inclination (i.e., response bias) in relation to the costs/benefits associated with each of the responses. To calculate sensitivity and response bias, we used two non-parametric measures, i.e., A0and B”, respectively [59]. We used these non-parametric measures instead of the traditional measure of sensitivity d0(d-prime) since, according to SDT, d0is unaffected by response bias (i.e., it is a pure measure of sensitivity) only if two assumptions are satisfied regarding the decision variable: (1) the signal and noise distributions are both normal; and (2) the signal and noise distributions have the same standard deviation. Since these two assumptions cannot actually be tested in yes/no tasks, non-parametric measures of sensitivity were advisable in this case. Several non-parametric measures of sensitivity and response bias have been proposed (e.g., [60,61]) but the most popular are A0and B”. These were devised by Pollack and Norman [62]; a complete history is provided by [63]. The formulas for computing A0and B” are:
If Hit (H) > False Alarm (FA): A0 = 1 2+ (H−FA) × (1+H−FA) 4 × H × (1−FA) (1) If (FA) > (H): A0 = 1 2− (FA−H) × (1+FA−H) 4 × FA × (1−H) (2) and: B00 = (1−H) × (1−FA) −H × FA (1−H) × (1−FA) +H × FA (3)
Our main focus was to test whether there were different degrees of sensitivity (A0) to the three mirror forms in one or both of the sense modalities. When differences in sensitivity were found, we also studied whether there were differences in response bias (i.e., B”). If there was greater sensitivity relating to one of the mirror forms as compared to the others and if this correlated with a response bias in the same direction, this would mean that the participants found it easier to detect that specific mirror form and that this was associated with a tendency to be more conservative in their responses (i.e., they tended to respond “no” more frequently than “yes”). If greater sensitivity was associated with no difference in response bias, then this could be taken as an indication that the participants found it easier to detect that specific mirror form but without this being associated with a specific response bias. And if greater sensitivity was associated with a response bias in the opposite direction, this could be interpreted as an indication that the participants found it easier to detect that specific mirror form as compared to the other mirror forms, and that this coexisted with a more liberal response bias (i.e., a bias towards “yes”). The A0and B” values for each individual participant were recalculated for every interaction between the fixed effects that we were interested in studying. A series of Generalized Mixed effect Models (GLMMs) were then performed on these A0and B” values. Based on an initial exploration of the data (see Section3.1), we decided not to collapse the data by Subject and always entered this variable in the GLMMs models as a random effect. In all the following GLMMs, Sense Modality, Mirror Forms and Rhythm were always studied as fixed effects, while Contour, Final Interval and Subjects always entered the models as random effects.
When the range of the dependent variable is between 0 and 1 (as in the case of A0), the most suitable type of GLMM is the binomial family and logit link function [64,65]. In order to use the same type of analysis for B” (whose values ranged between−1 and 1, with positive numbers representing a conservative bias, i.e., a tendency to answer “no”, while negative numbers representing a liberal bias, i.e., a tendency to answer “yes”, and with 0 representing no bias), a linear transformation was preliminarily applied to the original B” values in order to rescale them within the interval 0–1 ((B” + 1)/2).
All analyses were carried our using the statistical software program R 3.3.1, with the “lme4” [66], “car” [67], “lsmeans” [68], and “effects” [69] packages. We performed Mixed Model ANOVA Tables (Type 3 tests) via likelihood ratio tests [70–72] implemented in the “afex” package [73]. Bonferroni corrections were applied to post-hoc comparisons.
3. Results
3.1. Ease of Recognition
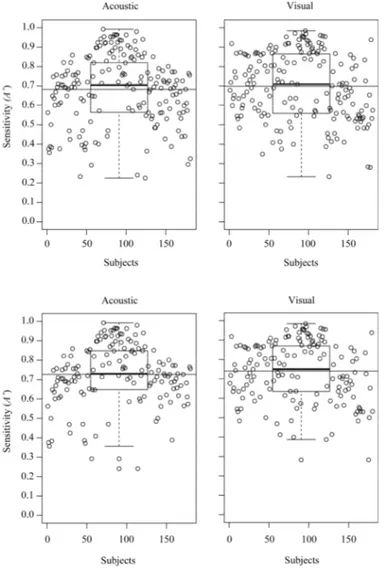
The scatter plots of A0 values in Figure2provide a first overview of the participants’ average sensitivity. The degree of sensitivity was assessed according to the ease with which the participant recognized the target mirror forms in the acoustic (diagrams on the left) and visual (diagrams on the right) tasks. The A0values typically range from 0 to 1, with 0.5 indicating that the signal cannot be distinguished from noise, and 1 which corresponds to perfect performance. Values less than 0.5 may arise from sampling error or indicate that the participant was somewhat confused when responding.
We know from previous literature on the recognition of acoustic mirror forms that the task is difficult for non-expert subjects, whereas no former data are available concerning how easy/difficult it is to recognize corresponding dynamic visual configurations. A straightforward comparison between the A0values obtained in our study and previous findings is not possible since in previous literature the analysis was usually based on the frequency of correct responses and did not compare the two correct responses (H, CR) or the two types of error (M, FA) as Signal Detection Theory presupposes. What is usually reported is that the number of correct responses was significantly different from chance (0.50) but that the task turned out to be difficult [30].
Symmetry 2017, 9, 39 9 of 20
Figure 2. Scatter plots of the participants’ average sensitivity (A′) and corresponding box plots around
the median in the Acoustic task and Visual task (the box is between the upper and lower quartile; whiskers represent the maximum and minimum values excluding outliers; the long thin horizontal line displayed within each plot represents the mean). The two top scatter plots refer to all of the sample data. The two bottom scatter plots refer to the sample data after elimination of participants with low sensitivity (i.e., A′ < 0.6) in both tasks.
In the top two diagrams in Figure 2, the original sample of participants is displayed. They show
that the average sensitivity (represented by the thin horizontal line) was MA′ = 0.682 (Standard
Deviation (SD) = 0.177) in the Acoustic task and MA′ = 0.699 (SD = 0.172) in the Visual Task. The medians (displayed in the box plots) are slightly above these values. The scatter plots also reveal that while most of the participants performed overall better than chance (A′ > 0.6 : 71% in the acoustic task and 67% in the visual task), and that some of them performed very well (A′ > 0.8 : 27% in the acoustic task and 36% in the visual task), the task was in effect not very easy. Indeed a percentage of participants that is certainly not negligible had sensitivity values around 0.5 (0.4 < A′ < 0.6 : 20% in the acoustic task and 29% in the visual task ), which indicates that they were not able to distinguish signal (i.e., the target mirror forms) from noise (i.e., the other two mirror forms). Moreover, 9% of participants in the acoustic task and 4% in the visual task had sensitivity values between 0.2 and 0.4. This suggests that they confused the target form which they were supposed to be looking for with one of the other two mirror forms. This is not as strange as it may seem given that the three mirror forms all consisted of a similar type of transformation in that they were all mirror reflections.
Participants with an overall sensitivity less than 0.6 in both tasks were eliminated from the dataset (i.e., around 16% of the initial 180 participants) before the subsequent statistical analyses were
Figure 2.Scatter plots of the participants’ average sensitivity (A0) and corresponding box plots around the median in the Acoustic task and Visual task (the box is between the upper and lower quartile; whiskers represent the maximum and minimum values excluding outliers; the long thin horizontal line displayed within each plot represents the mean). The two top scatter plots refer to all of the sample data. The two bottom scatter plots refer to the sample data after elimination of participants with low sensitivity (i.e., A0< 0.6) in both tasks.
In the top two diagrams in Figure2, the original sample of participants is displayed. They show that the average sensitivity (represented by the thin horizontal line) was MA0 = 0.682 (Standard Deviation
(SD) = 0.177) in the Acoustic task and MA0 = 0.699 (SD = 0.172) in the Visual Task. The medians
(displayed in the box plots) are slightly above these values. The scatter plots also reveal that while most of the participants performed overall better than chance (A0> 0.6: 71% in the acoustic task and 67% in the visual task), and that some of them performed very well (A0> 0.8: 27% in the acoustic task
and 36% in the visual task), the task was in effect not very easy. Indeed a percentage of participants that is certainly not negligible had sensitivity values around 0.5 (0.4 < A0< 0.6: 20% in the acoustic task and 29% in the visual task), which indicates that they were not able to distinguish signal (i.e., the target mirror forms) from noise (i.e., the other two mirror forms). Moreover, 9% of participants in the acoustic task and 4% in the visual task had sensitivity values between 0.2 and 0.4. This suggests that they confused the target form which they were supposed to be looking for with one of the other two mirror forms. This is not as strange as it may seem given that the three mirror forms all consisted of a similar type of transformation in that they were all mirror reflections.
Participants with an overall sensitivity less than 0.6 in both tasks were eliminated from the dataset (i.e., around 16% of the initial 180 participants) before the subsequent statistical analyses were done (the new dataset is provided as Supplementary Material: file “database_sym”). Since the aim of the study was to test whether different sensitivity to the “same” mirror forms emerged in the two sense modalities, participants with a sensitivity >0.6 in one of the two tasks but not in the other were considered meaningful cases and for this reason were included in the dataset. The new values relating to average sensitivity in the two tasks (represented by the thin horizontal line in the two bottom diagrams in Figure2) are MA0 = 0.726 (SD = 0.154) in the Acoustic task and MA0 = 0.740 (SD = 0.153) in
the Visual Task.
3.2. Ease of Recognition of the Three Mirror Forms in the Two Sense Modalities
In order to study the participants’ sensitivity to the three different Mirror Forms in the two Sense Modalities, we conducted a first GLMM on A0with Sense Modality and Mirror Forms as fixed effects. Both of these main effects turned out to be significant (Mirror Forms: ChiSq = 53.489, df = 2, p < 0.0001; Sense Modality: ChiSq = 91.212, df = 1, p < 0.0001), as was their interaction (ChiSq = 2202.414, df = 2, p < 0.0001). As shown in Figure3and as confirmed by post-hoc tests and the descriptive statistics for the raw data (i.e., Mean and SD—as reported in Table2), the participants were more sensitive to the retrograde mirror form, i.e., a reflection on a vertical axis, in both the visual and acoustic tasks (RET_A vs. INV_A: EST = 0.261, SE = 0.027, z-ratio = 9.352, p < 0.0001; RET_A vs. RETINV_A: EST = 0.198, SE = 0.029, z-ratio = 6.680, p < 0.0001; RET_V vs. RETINV_V: EST = 0.228, SE = 0.029, z-ratio = 7.682, p < 0.0001; RET_V vs. INV_V: EST = 0.096, SE = 0.027, z-ratio = 3.451, p = 0.008).
Symmetry 2017, 9, 39 10 of 20
done (the new dataset is provided as Supplementary Material: file “database_sym”). Since the aim of the study was to test whether different sensitivity to the “same” mirror forms emerged in the two sense modalities, participants with a sensitivity >0.6 in one of the two tasks but not in the other were considered meaningful cases and for this reason were included in the dataset. The new values relating to average sensitivity in the two tasks (represented by the thin horizontal line in the two bottom
diagrams in Figure 2) are MA′ = 0.726 (SD = 0.154) in the Acoustic task and MA′ = 0.740 (SD = 0.153) in
the Visual Task.
3.2. Ease of Recognition of the Three Mirror Forms in the Two Sense Modalities
In order to study the participants’ sensitivity to the three different Mirror Forms in the two Sense Modalities, we conducted a first GLMM on A′ with Sense Modality and Mirror Forms as fixed effects. Both of these main effects turned out to be significant (Mirror Forms: ChiSq = 53.489, df = 2, p < 0.0001; Sense Modality: ChiSq = 91.212, df = 1, p < 0.0001), as was their interaction (ChiSq = 2202.414, df = 2, p < 0.0001). As shown in Figure 3 and as confirmed by post-hoc tests and the descriptive statistics for the raw data (i.e., Mean and SD—as reported in Table 2), the participants were more sensitive to the retrograde mirror form, i.e., a reflection on a vertical axis, in both the visual and acoustic tasks (RET_A vs. INV_A: EST = 0.261, SE = 0.027, z-ratio = 9.352, p < 0.0001; RET_A vs. RETINV_A: EST = 0.198, SE = 0.029, z-ratio = 6.680, p < 0.0001; RET_V vs. RETINV_V: EST = 0.228, SE = 0.029, z-ratio = 7.682, p < 0.0001; RET_V vs. INV_V: EST = 0.096, SE = 0.027, z-ratio = 3.451, p = 0.008).
Figure 3. Effect plots of the interaction between Mirror form (Inversion (INV), Retrograde (RET),
Retrograde Inversion (RETINV)) and Sense Modality (acoustic, vision) on participants’ sensitivity (A′). Results are given on the logit scale used in the Generalized Mixed effect Models (GLMM) analysis. Error bars represent a 95% confidence interval.
Table 2. Mean sensitivity (A′) and mean response bias (B″) relating to the three mirror forms
(Inversion (INV), Retrograde (RET), Retrograde Inversion (RETINV)) in the two sense modalities, with corresponding standard deviations (SD).
MIRROR FORM_Sense Modality A′
B″
RET_acoustic M = 0.833 (SD = 0.139) M = 0.154 (SD = 0.464) INV_acoustic M = 0.645 (SD = 0.148) M = 0.167 (SD = 0.288) RETINV_acoustic M = 0.681 (SD = 0.096) M = 0.381 (SD = 0.286) RET_visual M = 0.811 (SD = 0.154) M = −0.124 (SD = 0.454) INV_visual M = 0.736 (SD = 0.122) M = 0.019 (SD = 0.311) RETINV_visual M = 0.646 (SD = 0.136) M = 0.228 (SD = 0.356)
An analyses of the response biases (see Table 2, B″) revealed that, in general, greater sensitivity in the detection of the retrograde transformation was also associated with a more conservative bias
Figure 3. Effect plots of the interaction between Mirror form (Inversion (INV), Retrograde (RET), Retrograde Inversion (RETINV)) and Sense Modality (acoustic, vision) on participants’ sensitivity (A0). Results are given on the logit scale used in the Generalized Mixed effect Models (GLMM) analysis. Error bars represent a 95% confidence interval.
Table 2. Mean sensitivity (A0) and mean response bias (B”) relating to the three mirror forms (Inversion (INV), Retrograde (RET), Retrograde Inversion (RETINV)) in the two sense modalities, with corresponding standard deviations (SD).
MIRROR FORM_Sense Modality A0 B”
RET_acoustic M = 0.833 (SD = 0.139) M = 0.154 (SD = 0.464) INV_acoustic M = 0.645 (SD = 0.148) M = 0.167 (SD = 0.288) RETINV_acoustic M = 0.681 (SD = 0.096) M = 0.381 (SD = 0.286) RET_visual M = 0.811 (SD = 0.154) M =−0.124 (SD = 0.454) INV_visual M = 0.736 (SD = 0.122) M = 0.019 (SD = 0.311) RETINV_visual M = 0.646 (SD = 0.136) M = 0.228 (SD = 0.356)
An analyses of the response biases (see Table2, B”) revealed that, in general, greater sensitivity in the detection of the retrograde transformation was also associated with a more conservative bias in the other two mirror forms (i.e., a tendency to respond “no”). This was found for all comparison, except one (B”: RET_V vs. RETINV_V: EST =−0.392, SE = 0.071, z-ratio =−5.457, p < 0.0001; RET_V vs. INV_V: EST =−0.210, SE = 0.067, z-ratio =−3.109, p = 0.028; RET_A vs. RETINV_A: EST =−0.230, SE = 0.071, z-ratio =−3.209, p = 0.02; RET_A vs. INV_A: EST =−0.064, SE = 0.067, z-ratio =−0.954, p = 1.000).
A comparison between the sensitivity relating to the visual task and that relating to the acoustic task revealed that participants were more sensitive to the inversion mirror form (i.e., a reflection on a horizontal axis) in the visual task than in the acoustic task (INV_V vs. INV_A: EST = 0.137, SE = 0.003, z-ratio = 44.424, p < 0.0001). In terms of the percentage of correct responses (Hit + Correct Rejection), participants correctly responded to 66% of the total number of inversion mirror forms presented in the visual task and to 60% of the total number of inversion mirror forms presented in the acoustic task. As the analysis of B” revealed (Table2), this difference in sensitivity was also associated with more conservative responses (i.e., with a bias towards responding “no”) in the acoustic task as compared to the visual task (INV_V vs. INV_A: EST =−0.141, SE = 0.003, z-ratio =−42.347, p < 0.0001).
Sensitivity to the other two mirror forms also differed between the two sense modalities, with greater sensitivity to both the retrograde and the retrograde inversion mirror forms in the acoustic task (RET_A vs. RET_V: EST = 0.027, SE = 0.003, z-ratio = 9.558, p < 0.0001; RETINV_A vs. RETINV_V: EST = 0.057, SE = 0.003, z-ratio = 16.392, p < 0.0001). The percentage of correct responses (Hit + Correct Rejection) for the retrograde mirror form was 76% in the acoustic task and 73% in the visual task and for the retrograde inversion mirror form, the percentage of correct responses was 61% in the acoustic task and 58% in the visual task. The analyses revealed that participants were not only better at detecting these two mirror forms (i.e., retrograde and retrograde inversion) in the acoustic as compared to the visual task, but also that their responses for both mirror forms were more conservative (i.e., with a bias towards responding “no”) in the visual task as compared to the acoustic task (B”: RET_V vs. RET_A: EST = 0.287, SE = 0.003, z-ratio = 84.057, p < 0.0001; RETINV_V vs. RETINV_A: EST = 0.125, SE = 0.003, z-ratio = 35.473; p < 0.0001).
3.3. Cross Modality Facilitation Effects
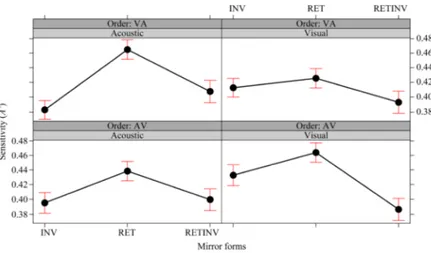
A second GLMM was conducted (with Order, Sense Modality and Mirror Forms as fixed effects) in order to test whether sensitivity increased as a consequence of the order in which the two tasks were performed, i.e., acoustic followed by visual or visual followed by acoustic. No main effect of Order emerged (ChiSq = 0.717; df = 1; p = 0.396) which indicates that sensitivity was not improved in general by presenting the visual and acoustic tasks in a specific order. However, as the significant interaction between Order, Sense Modality and Mirror form indicated (ChiSq = 1086.764; df = 2; p < 0.0001), and as post-hoc tests clarified, facilitation effects across modalities did emerge for one mirror form, i.e., the retrograde mirror form (Figure4).
Symmetry 2017, 9, 39 12 of 21
in the other two mirror forms (i.e., a tendency to respond “no”). This was found for all comparison, except one (B″: RET_V vs. RETINV_V: EST = −0.392, SE = 0.071, z-ratio = −5.457, p < 0.0001; RET_V vs. INV_V: EST = −0.210, SE = 0.067, z-ratio = −3.109, p = 0.028; RET_A vs. RETINV_A: EST = −0.230, SE = 0.071, z-ratio = −3.209, p = 0.02; RET_A vs. INV_A: EST = −0.064, SE = 0.067, z-ratio = −0.954, p = 1.000). A comparison between the sensitivity relating to the visual task and that relating to the acoustic task revealed that participants were more sensitive to the inversion mirror form (i.e., a reflection on a horizontal axis) in the visual task than in the acoustic task (INV_V vs. INV_A: EST = 0.137, SE = 0.003, z-ratio = 44.424, p < 0.0001). In terms of the percentage of correct responses (Hit + Correct Rejection), participants correctly responded to 66% of the total number of inversion mirror forms presented in the visual task and to 60% of the total number of inversion mirror forms presented in
the acoustic task. As the analysis of B″revealed (Table 2), this difference in sensitivity was also
associated with more conservative responses (i.e., with a bias towards responding “no”) in the acoustic task as compared to the visual task (INV_V vs. INV_A: EST = −0.141, SE = 0.003, z-ratio = −42.347, p < 0.0001).
Sensitivity to the other two mirror forms also differed between the two sense modalities, with greater sensitivity to both the retrograde and the retrograde inversion mirror forms in the acoustic task (RET_A vs. RET_V: EST = 0.027, SE = 0.003, z-ratio = 9.558, p < 0.0001; RETINV_A vs. RETINV_V: EST = 0.057, SE = 0.003, z-ratio = 16.392, p < 0.0001). The percentage of correct responses (Hit + Correct Rejection) for the retrograde mirror form was 76% in the acoustic task and 73% in the visual task and for the retrograde inversion mirror form, the percentage of correct responses was 61% in the acoustic task and 58% in the visual task. The analyses revealed that participants were not only better at detecting these two mirror forms (i.e., retrograde and retrograde inversion) in the acoustic as compared to the visual task, but also that their responses for both mirror forms were more conservative (i.e., with a bias towards responding “no”) in the visual task as compared to the acoustic task (B″: RET_V vs. RET_A: EST = 0.287, SE = 0.003, z-ratio = 84.057, p < 0.0001; RETINV_V vs. RETINV_A:EST = 0.125, SE = 0.003, z-ratio = 35.473; p < 0.0001).
3.3. Cross Modality Facilitation Effects
A second GLMM was conducted (with Order, Sense Modality and Mirror Forms as fixed effects) in order to test whether sensitivity increased as a consequence of the order in which the two tasks were performed, i.e., acoustic followed by visual or visual followed by acoustic. No main effect of Order emerged (ChiSq = 0.717; df = 1; p = 0.396) which indicates that sensitivity was not improved in
general by presenting the visual and acoustic tasks in a specific order. However, as the significant
interaction between Order, Sense Modality and Mirror form indicated (ChiSq = 1086.764; df = 2; p < 0.0001), and as post-hoc tests clarified, facilitation effects across modalities did emerge for one mirror form, i.e., the retrograde mirror form (Figure 4).
Figure 4. Effect plots of the interaction between Order (VA: Visual followed by Acoustic, AV: Acoustic
followed by Visual), Sense Modality (Acoustic, Visual) and Mirror form (Inversion (INV), Retrograde
Figure 4.Effect plots of the interaction between Order (VA: Visual followed by Acoustic, AV: Acoustic followed by Visual), Sense Modality (Acoustic, Visual) and Mirror form (Inversion (INV), Retrograde (RET), Retrograde Inversion (RETINV)) on sensitivity (A0). Results are given on the logit scale used in the Generalized Mixed effect Models (GLMM) analysis. Error bars represent a 95% confidence interval.
Sensitivity to the retrograde mirror form in the visual task was increased after participants had carried out the acoustic task. In other words, the participants’ sensitivity when they were asked to detect the retrograde pattern visually (i.e., a reflection around a vertical axis) increased when the visual task followed the acoustic task (AV) as compared to when the visual task was performed first (VA) (RET_V_AV: M = 0.871, SD = 0.111; RET_V_VA: M = 0.752, SD = 0.168; RET_V_AV vs. RET_V_VA: EST = 0.155, SE = 0.038, z-ratio = 4.006, p = 0.004). No difference due to the order of the visual and acoustic tasks in terms of the participants’ sensitivity was found for the other two mirror forms. As the analysis of B” revealed, the difference in sensitivity found for the retrograde transformation was also associated with a change in the response bias: participants’ responses turned out to be more liberal (i.e., with a bias towards “yes”) when the visual task was performed after the acoustic task, while there was a slightly more conservative bias (i.e., a bias towards “no”) when the visual task was performed first (RET_V_AV: M =−0.286, SD = 0.493; RET_V_VA: M = 0.039, SD = 0.341; RET_V_AV vs. RET_V_VA: EST =−0.410, SE = 0.093, z-ratio =−4.394, p < 0.0001).
3.4. The Effects of the Isochronism versus Non-Isochronism (Rhythm)
A third GLMM with Sense Modality and Rhythm as fixed effects was conducted to test whether sensitivity to the three mirror forms varied when the elements forming the pattern had different (non-isochronism (N-ISO)) or identical (isochronism (ISO)) durations. A main effect of Rhythm emerged (ChiSq = 329.85, df = 1, p < 0.0001) and there was a significant interaction with Sense Modality (ChiSq = 168.97, df = 1, p < 0.0001). As shown in Figure5and confirmed by post-hoc tests (see also the mean values reported in Table3), participants had greater sensitivity in the non-isochronous condition in both sense modalities (ISO_A vs. N-ISO_A: EST =−0.011, SE = 0.002, z-ratio =−4.213, p < 0.001; ISO_V vs. N-ISO_V: EST=−0.058, SE = 0.002, z-ratio =−22.161, p < 0.0001). However, the effect was stronger in the visual task. In the isochronous condition, participants were equally sensitive in both the visual and acoustic tasks (ISO_A vs. ISO_V: EST = 0.005, SE = 0.002, z-ratio = 2.007, p = 0.268), while in the non-isochronous condition, sensitivity was greater in the visual task (N-ISO_A vs. N-ISO_V: EST =−0.041, SE = 0.002, z-ratio =−16.745, p < 0.0001). The analysis of B” revealed that in the acoustic task participants were in general more conservative in their responses than in the visual task (ISO_A vs. ISO_V: EST = 0.178, SE = 0.003, z-ratio = 55.752, p < 0.0001; N-ISO_A vs. N-ISO_V: EST = 0.205, SE = 0.003, z-ratio = 72.260, p < 0.0001). While in the acoustic task there was no difference in the response bias between the two rhythm conditions (ISO_A vs. N-ISO_A: EST =−0.007, SE = 0.003, z-ratio =−2.463, p = 0.10), a difference was found in the visual task where participants were more
conservative in the isochronous condition (ISO_V vs. N-ISO_V: EST = 0.066, SE = 0.003, z-ratio = 19.849, p < 0.0001)—despite the fact that the mean values indicate a very small response bias.
Table 3.Mean sensitivity (A0) and mean response bias (B”), with corresponding standard deviations, relating to the three mirror forms (inversion, retrograde, retrograde inversion) in the two sense modalities and in the isochronism versus non-isochronism conditions.
MIRROR FORM_Sense Modality A0 B”
ISO_acoustic M = 0.726 (SD = 0.165) M= 0.213 (SD = 0.415) N-ISO_acoustic M = 0.722 (SD = 0.172) M = 0.219 (SD = 0.421) ISO_visual M = 0.722 (SD = 0.171) M = 0.010 (SD = 0.430) N-ISO visual M = 0.752 (SD = 0.168) M =−0.026 (SD = 0.467)
Symmetry 2017, 9, 39 13 of 20
Figure 5. Effect plot of the interaction between Rhythm and Sense Modality (Acoustic, Visual) on
sensitivity (A′). Results are given on the logit scale used in the Generalized Mixed effect Models (GLMM) analysis. Error bars represent a 95% confidence interval.
4. Discussion and Conclusions
One of the basic problems affecting the study of visual perception is to explain how the observer recognizes stimuli in his/her environment which undergo continuous and various transformations of shape and size (the constancy problem). In acoustic perception too the issue of whether people are able to perceive two melodies as being “the same” even if all the notes have been changed is an old problem dating back to von Ehrenfels [74] who used this example to establish his definition of Gestalt qualities. We know that melodies may be transposed, speeded up or slowed down (within certain limits) without compromising the listener’s ability to recognize them as “the same” tune. The transformations considered in this paper (i.e., mirror forms) consist of “reflections” of the melodic pattern as a whole which may take the form of an upside down transformation (inversion), a back to front transformation (retrograde) or an upside down and back to front transformation (retrograde inversion). The ability to recognize these mirror forms has been addressed in this paper from a new perspective as both the visual and acoustic recognition of corresponding symmetrical patterns was studied for the purposes of comparison. Moreover, in addition to providing new information regarding the acoustic perception of the three mirror forms to be added to the few (discordant) findings in previous literature, the study also aimed to produce new data on the visual detection of mirror symmetry when sequential patterns and a sequential detection task are considered.
Studies on symmetry detection in dot patterns have confirmed that the visual system is efficient at detecting symmetry, even at very brief presentation times, i.e., stimulus presentations less than 160 ms (e.g., [17,18,21]), during which it is not possible to apply intentional pair-wise comparison strategies based on eye movement or shifts in spatial attention. Processes involving pair-wise comparisons and the intentional matching of corresponding dot-pairs have been hypothesized to support symmetry detection (e.g., [75]), especially when highly demanding tasks are involved, such as the discrimination of perfectly symmetrical versus nearly symmetrical patterns [76]. The type of stimuli and the task used in the study presented in this paper are different from those used in traditional visual symmetry detection tasks (in both static and dynamic conditions) in which the pattern elements are presented simultaneously (for a review and application of various types of methods see [77]). In our experiment, the elements forming each pattern (i.e., the five square dots) appeared in succession over approximately 3 s and not simultaneously. Moreover the two “halves” forming the symmetrical configuration were also presented in succession (i.e., one after the other) divided by a one second Inter Stimulus Interval (ISI). Many researchers have shown that symmetry is easier to detect than a simple repeated pattern when the symmetry is within an object, i.e., there is
Figure 5. Effect plot of the interaction between Rhythm and Sense Modality (Acoustic, Visual) on sensitivity (A0). Results are given on the logit scale used in the Generalized Mixed effect Models (GLMM) analysis. Error bars represent a 95% confidence interval.
4. Discussion and Conclusions
One of the basic problems affecting the study of visual perception is to explain how the observer recognizes stimuli in his/her environment which undergo continuous and various transformations of shape and size (the constancy problem). In acoustic perception too the issue of whether people are able to perceive two melodies as being “the same” even if all the notes have been changed is an old problem dating back to von Ehrenfels [74] who used this example to establish his definition of Gestalt qualities. We know that melodies may be transposed, speeded up or slowed down (within certain limits) without compromising the listener’s ability to recognize them as “the same” tune. The transformations considered in this paper (i.e., mirror forms) consist of “reflections” of the melodic pattern as a whole which may take the form of an upside down transformation (inversion), a back to front transformation (retrograde) or an upside down and back to front transformation (retrograde inversion). The ability to recognize these mirror forms has been addressed in this paper from a new perspective as both the visual and acoustic recognition of corresponding symmetrical patterns was studied for the purposes of comparison. Moreover, in addition to providing new information regarding the acoustic perception of the three mirror forms to be added to the few (discordant) findings in previous literature, the study also aimed to produce new data on the visual detection of mirror symmetry when sequential patterns and a sequential detection task are considered.
Studies on symmetry detection in dot patterns have confirmed that the visual system is efficient at detecting symmetry, even at very brief presentation times, i.e., stimulus presentations less than 160 ms (e.g., [17,18,21]), during which it is not possible to apply intentional pair-wise comparison strategies based on eye movement or shifts in spatial attention. Processes involving pair-wise comparisons and the intentional matching of corresponding dot-pairs have been hypothesized to support symmetry detection (e.g., [75]), especially when highly demanding tasks are involved, such as the discrimination of perfectly symmetrical versus nearly symmetrical patterns [76]. The type of stimuli and the task used in the study presented in this paper are different from those used in traditional visual symmetry detection tasks (in both static and dynamic conditions) in which the pattern elements are presented simultaneously (for a review and application of various types of methods see [77]). In our experiment, the elements forming each pattern (i.e., the five square dots) appeared in succession over approximately 3 s and not simultaneously. Moreover the two “halves” forming the symmetrical configuration were also presented in succession (i.e., one after the other) divided by a one second Inter Stimulus Interval (ISI). Many researchers have shown that symmetry is easier to detect than a simple repeated pattern when the symmetry is within an object, i.e., there is a “within-object relation”, while repetition is easier to detect when the matching parts belong to different objects, i.e., there is a ‘between-object relation’ (e.g., [78–80]). In a sense, the conditions which were used in the present study can be considered to be more similar to a between-object matching than a within-object matching and as such it is very different from the automatic rapid symmetry detection conditions reported by most researchers. The task described in this paper likely involved pairwise comparison processes and stimulated matching strategies to compare the two series of elements, which made the task more demanding and difficult. Three main findings emerged. Firstly, our results provide further evidence (in addition to the findings in previous literature regarding static and dynamic visual configurations—see the papers cited in the introduction) that symmetry around a vertical axis is particularly easy to recognize. Our findings show that this also applies to the case of sequential visual configurations and acoustic stimuli. The preference for this type of symmetry seems to be even more evident in the case of auditory perception than it is for visual perception as indicated by the following findings from the present study: (i) acoustic sensitivity to symmetry around a vertical axis (the retrograde mirror form) was significantly greater than sensitivity to the corresponding visual stimuli (see Figure3); and (ii) recognizing the retrograde mirror form in the visual task was easier after the acoustic task but not vice versa (Figure4). This suggests that even though the reflection around a vertical axis (the retrograde mirror form) was one of the two mirror forms which the participants found easier to detect visually, performing the acoustic task first increased their sensitivity to the visual equivalent, whereas performance in the acoustic task remained the same with or without prior visual “training”.
Secondly, despite the fact that a preference for symmetry around a vertical axis (the retrograde mirror form) was common to both sense modalities, the participants did not in general display the same sensitivity in the two types of task. Differences between the two sense modalities emerged for all three mirror forms: reflections around a vertical axis (retrograde) and reflections around a vertical and horizontal axis (retrograde inversion) were more easily recognized in the acoustic task than in the visual task, while reflections around a horizontal axis (inversion) were more easily recognized in the visual task than in the acoustic task. These differences, in addition to the fact that we did not find a general training effect (i.e., a main effect) depending on the order in which the tasks were performed, suggests that the two tasks were relatively independent.
Thirdly, in the present study, performance in the acoustic task improved when the five elements in the stimuli were not of the same duration and a rhythmic structure therefore resulted. This outcome is in agreement with previous evidence on the role of rhythm in tasks involving the recognition of acoustic mirror forms [32,53] but it contrasts with other results indicating that better performances were associated with isochronous melodies (e.g., [31]—although in this case longer melodies and other melodic features also co-varied). The findings in our study demonstrate that non-isochronism facilitates not only the recognition of acoustic mirror forms, but also greatly enhances performance in
the recognition of sequential visual patterns (Figure5). This is an interesting new result concerning the visual perception of symmetry. The different duration of the five elements in the sequence creates grouping effects. We speculate that these local organizations, rather than the “global spatial structure” (which is three seconds long), might provide a useful hint. The spatial relationships perceived between these sub-units (which are simpler and shorter) offer anchor points for a pair-wise comparison strategy to be applied. In our experimental conditions, the overall duration of the event to be judged was around 7 s: the first pattern was presented over approximately three seconds followed by a one second ISI and then the other 3 s long pattern. Iconic memory has a much lower capacity than echoic memory (e.g., [81,82]). Therefore it is reasonable to suppose that the grouping effects provided by rhythm in the non-isochronous conditions offer simplification strategies for the pair-matching comparison which is particularly useful for visual memory.
Our main focus in this paper was to study the participants’ sensitivity to the three mirror forms. However, whenever a significant difference in sensitivity emerged, the response bias was also analyzed. A constant finding in all the analyses of B” carried out in the paper was that a lower degree of sensitivity was associated with a conservative response bias. This means that, in this study, when the participants found it difficult to identify the target (i.e., in the case of the mirror forms which they were less sensitive to), they tended to deny the presence of the target pattern.
One of the thought-provoking results emerging from this study regards the difficulty with which inversion mirror forms (i.e., reflections around a horizontal axis) were recognized in the acoustic task. This confirms the evidence found by Dowling [30] in similar presentation conditions (i.e., five tones in 2.5 s). When the results of the visual task were compared to those of the acoustic task, it became clear that it was more difficult to detect the inversion transformation as compared to the retrograde transformation in both sensory modalities but the participants’ sensitivity to inversion was significantly greater in the visual task than in the acoustic task. In Dowling’s [30] original study, the inverse transformation was more easily detected than the retrograde transformation in the faster condition (i.e., when the five tones were presented in 1 s). On the one hand, this finding indicates the sensitivity of the outcomes to the specific temporal condition considered but this is not dissimilar to the fact that in other dynamic conditions symmetry detection is easier with dynamic as compared to static presentations only at certain optimal frequencies (see [77]). On the other hand, it provides cues for speculation about the differences between the two conditions. In the faster condition studied by Dowling [30], the five tones forming each melody were not simultaneously presented but nearly so: all five tones were presented within 1 s. The overall acoustic event was quite long (the probe stimulus, 1 s, was followed by a 2 s ISI and then by the comparison stimulus, another 1 s), but the global spatial structure of the five tones could be grasped as a whole. Conversely, in the slower presentation condition (two tones/s) which was similar to that used in this study, the overall acoustic structure cannot be grasped unless it is sequential. In the latter condition, i.e., when the global structure is difficult to grasp as a whole, the identity of the elements forming the sequence is probably decisive as it permits the invariance between the two “halves” of the symmetrical configuration to be noticed. This identity is preserved in the retrograde transformation (if not transposed) but not in the inversion transformation. Indeed, in the retrograde transformation, the pitch of the notes in the initial stimuli and in the comparison stimuli remains unchanged: only the order in which they are played is reversed (i.e., the first tone in the comparison stimulus is the last in the initial stimulus; the second tone in the comparison stimulus is the fourth tone in the initial stimulus etc.—see Figure1a). Conversely, in the inversion mirror form, only the first note remains unchanged in the standard and comparison stimuli. The other four tones change in pitch with respect to the initial tones (see Figure1a). Evidence of the importance of identity of pitch in the retrograde transformation emerges from the studies showing that when the retrograde transformation is transposed (and therefore the pitch of the notes no longer corresponds to that of the initial melody), people’s ability to detect symmetry severely deteriorates [33]. The finding that sensitivity to inversion was lower than sensitivity to the retrograde transformation in both sensory modalities is however in line with overall evidence that upside-down