February 2005
International Doctorate School in Information and Communication Technologies
DIT - University of Trento
O
N INFORMATION ORGANIZATION AND
IN-FORMATION EXTRACTION FOR THE STUDY OF
GENE EXPRESSIONS
BY
T
ISSUE
M
ICROARRAY TECHNIQUE
Francesca Demichelis
Advisor:
Dott. Ing. Paolo Traverso
ITC-irst, Center for Scientific and Technological Research, Trento
i
Abstract
Genomic expression studies are the means of depicting molecular profiles characterizing specific disease states. Microarrays allow the tracking and the translation of genome sequences into gene functions, leading to the identification of highly informative genes and pathways with a potential impact on understanding disease development and progression. These technologies concurrently may improve diagnostic and treatment modalities and the detec-tion of novel therapeutic targets.
Expression array technology is dramatically expanding the amount of data available on many disease states. These studies typically involve many researchers with different backgrounds, each contributing to some steps of the entire process.
In particular, Tissue Microarray technology allows for high-throughput expression profiling of tumor samples by evaluating potentially interesting candidate genes and proteins on a large number of well-characterized tumors, providing information on a population basis.
High quality experimental data production is extremely important for the reliability of data analysis. Critical assessment of experi-mental design and organization and reliability assessment of ex-perimental data together with data preprocessing need to be ad-dressed. A technological approach is also advisable to properly manage data heterogeneity, data quantity and user diversity. The focus of this thesis is to develop a systematic approach to processing and better understanding data generated from Tissue Microarray technology, overcoming the limitations of other cur-rent approaches. This thesis addresses Tissue Microarray data collection and organization, enhancing data sharing, usability, and process automation. We faced pre-processing issues, identify-ing critical points and some solutions. We also focused on a spe-cific issue in data classification, proposing a novel classification model based on a Bayesian hierarchical approach, able to handle data uncertainty. Three Tissue Microarray experiments are
pre-ii
examples to illustrate some of the critical points made in this the-sis.
Keywords
Tissue Microarray, Expression micorarray, Molecular Profiling, Data Management
i
Contents
ABSTRACT...I CHAPTER 1 ... 1 1. INTRODUCTION... 1 1.1.THE CONTEXT... 4 1.2.THE PROBLEM... 5 1.3.THE SOLUTION... 7 1.4.INNOVATIVE ASPECTS... 91.5.STRUCTURE OF THE THESIS... 9
1.6.NOTES... 10
CHAPTER 2 ... 11
2. STATE OF THE ART ... 11
CHAPTER 3 ... 17
3. MOLECULAR PROFILING AT PROTEIN EXPRESSION... 17
3.1.SCENARIO... 17
3.2.DATA MANAGEMENT PROBLEM... 19
3.3.TISSUE MICROARRAY TECHNIQUE... 21
3.3.1 Common problems with TMA section preparation... 24
3.3.2 In situ investigation ... 25
CHAPTER 4 ... 29
4. THE TMA DATA MANAGEMENT SYSTEM ... 29
4.1. USER REQUIREMENTS, NEED ASSESSMENT AND SYSTEM DEVELOPMENT... 30
4.2.TMABOOST SYSTEM... 30
4.2.1 System Architecture ... 31
4.2.2 System Components ... 35
4.2.3 System usage and availability... 59
CHAPTER 5 ... 61
5. TMA DATA ANALYSIS... 61
5.1.PREPROCESSING... 62
ii
5.2.1 Human evaluation ...66
5.2.2 Automatic evaluation...66
5.3.TMA DATA PECULIARITIES...68
5.3.1 Drilling problem...69
5.3.2 Pooling problem...71
5.4.EXPRESSION VALUE DICHOTOMIZATION...73
CHAPTER 6...75
6. BAYESIAN HIERARCHICAL MODEL...75
6.1.INTRODUCTION...75
6.2.MODEL DEFINITION...76
6.2.1 MHierBa Model : Classification ...78
6.2.2 MHierBa Model : Learning...79
6.2.3 MStBa Model : Classification ...80
6.2.4 MStBa Model: Learning ...81
6.3.SYNTHETIC DATA...82
6.4.VALIDATION OF THE MHIERBA MODEL...82
I set of experiments...83
II set of experiments ...87
III set of experiments...90
6.5.CONSIDERATIONS...93
CHAPTER 7...95
7. PROTEIN EXPRESSION IN HUMAN CANCER...95
7.1.M-CAM EXPRESSION IN OVARIAN CARCINOMAS...95
7.1.1 Material and method ...96
7.1.2 Results ...102
7.2.JAGGED1 ...107
7.2.1 Material and method ...107
7.2.2 Results ...109
7.3.PROSTATE CANCER PROGRESSION PROFILE...115
7.3.1 Material and method ...116
7.3.2 Results ...120
7.4.FOLLOW-UP OF THE STUDIES...126
CHAPTER 8...129
8. CONCLUSIONS ...129
iii
10. APPENDIX A ... 137 BIBLIOGRAPHY ... 141
1
Chapter 1
1. Introduction
This doctoral thesis addresses how to handling gene and protein expression information, obtained by using a high throughput technique, called Tissue Microarray Technology. It encompasses the interdisciplinary field of bioinformatics. This chapter first in-troduces the headlines of this discipline.
Bioinformatics uses techniques and concepts from informatics, statistics, mathematics, chemistry, biochemistry, physics, and lin-guistics and has many practical applications in different areas of biology, medicine and informatics. Generally speaking, all knowledge which can be extracted from computer analysis of bio-logical data may be labeled as bioinformatics.
Therefore, as bioinformatics is really an heterogeneous and rap-idly evolving field, it might be helpful to sub-divide its current possible different activities by key areas to organize concepts [1][2], keeping in mind that the individual research activity often embraces more than one area in a comprehensive transversal way. Bioinformatics could be divided into the following key areas:
I. Sequencing (Algorithms for DNA, genomic and protein sequences, Algorithms for sequence comparison and multiple sequence alignment) II. Organization of Biological Knowledge (De-velopment of database for structure and bio-processes organization, Infrastructure for distrib-uted resources, User Interface and Information Representation, Query Languages, Networks, Taxonomy and Ontology).
III. Knowledge Discovery & Data Mining (Algo-rithms for feature selection for gene reduction,
2
Learning algorithms for gene and protein expres-sion).
IV. Biomolecular structure and Biological proc-esses (Computational Structure Biology, Compu-tational Systems Biology).
As suggested by Luscombe et al. [3] the development of bioin-formatics techniques has essentially determined an expansion of biological research in two dimensions, each one with specific aims and related view of biological problems. Working in each of these two dimensions often requires the use of tools and knowl-edge specific to the four key areas of bioinformatics as defined above. The aim of the first dimension is to fully understand the information contained by individual genes. In this sense bioin-formatics follows more the traditional reductionistic approach that was typical of biological studies. Starting with a gene sequence, the encoded protein sequence can be determined with strong cer-tainty. Next step is to calculate the structure adopted by the pro-tein. Finally, docking algorithms could design molecules that could bind the model structure, leading the way for biochemical assays to test their biological activity on the actual protein. So this dimension may be labeled as “rational drug process design”. In this context, clinical validation of a new gene potentially impor-tant in disease development and progression, as indicated in gene expression experiments, has a crucial role, allowing for the identi-fication of novel therapeutic targets.
The second dimension refers information related to the systemic functional behavior of the cell or the organism. It is possible to distinguish an experimental and a theoretical approach. The for-mer organizes biological knowledge principally by experimen-tally and computationally searching for similarities between dif-ferent molecules. This allows for the transfer of information between related entities and eventually leads to gene discovery or protein families, which share structures and/or functions. In this way, biologists are able to compile a “genome census” that pro-vides comprehensive statistical accounts of protein features, such
3
as the abundance of particular structures or functions in different genomes. Using this data it is also possible to trace the evolution-ary path of proteins, gaining first insights into the evolutionevolution-ary path of the whole organism. Expression microarray data repre-sents a rapidly growing and exciting new source of genomic in-formation. Grouping genes with similar expression profiles is a typical operation of this second dimension. In this way it is possi-ble to help physicians improve disease classification leading to advances in diagnosis, prognosis and therapeutic treatment. In theory, biological systems may be studied following a systemic approach, dividing biological information into two areas: (i) genes, proteins and individual molecules as basic components of biological systems; (ii) regulatory networks (which specify the expression patterns of genes and proteins), intracellular metabolic networks and both intra- and inter-cellular communication net-works, in which molecules participate. This biological informa-tion is hierarchical. An important emerging challenge for biology and medicine is the study of complex biological systems by cap-turing and integrating these different levels of biological informa-tion, thus scaling up from molecular biology to systems biology. An integrated and more global view of the systems requires the application of models to hierarchically understand the interplay between atoms, molecules, regulatory and metabolic processes, and cells to help simulate or analyze dynamic behavior of bio-logical systems. The ultimate goal of systems biology is to cor-rectly understand the complex biological networks that define a cell response to environmental and genetic changes, therefore to correctly predict and modify the behavior of biological systems.
4
Figure 1 - Bioinformatics as interdisciplinary framework
1.1. The Context
Gene expression is the process by which genetic information is converted into the structures and functions of a cell, by producing proteins from DNA coding sequences. The amount of protein that a cell expresses depends on the tissue, on the developmental stage of the organism and on the metabolic or physiologic state of the cell. Molecular profiles, which represent the molecular fingerprint of cells, are investigated to depict profiles characterizing specific diseases [4].Molecular profiling studies are primarily conducted in a comparative manner. Molecular profiling can be based on comparison between non-diseased (i.e., normal) and diseased (e.g., tumors) samples, between diseased samples pharmacologi-cally treated and untreated at variable time points or between samples of different diseases.
Expression array technology is dramatically expanding the amount of data available on many disease states. This technology allows tracking the translation of genome sequences into gene
5
functions (functional genomics). In the study of cancer, this new biological knowledge promises to improve diagnostic [5][6] and prognostic modalities [7][8][9] and to detect targets for new therapies [10].
Microarrays generate large molecular datasets in the setting of similar experimental conditions: DNA microarrays (DMAs) (first proposed in 1996, [11]) analyze mRNA expression, and Tissue microarrays (TMAs) (first proposed in 1998, [12]) evaluate DNA, RNA or protein targets through in situ investigations (analyses performed on tissues) by hybridization or immunhistochemistry. In molecular profiling studies of human cancer, integration of DMA and TMA experiments, in serial or cyclic processes, pro-vides a powerful approach [13][14]. These studies typically in-volve many researchers with different backgrounds, each contrib-uting to some steps of the entire process: biologists, chemists, pathologists, and clinicians. Their work is supported and com-plementarily completed by physicians, computer scientists, mathematicians, etc., who are required not just to perform data analysis, but also to contribute to the management of whole ex-perimental process from design to final data interpretation. As the throughput of this technology increases in the area of ex-pression arrays, proteomics, and tissue microarrays, one of the critical issues is making sense of all this data. Therefore, the focus of this thesis is to develop a systematic approach to processing and bettering understanding data generated from one of these high-throughput discovery tools, the Tissue Microarray.
TMAs can be used to examine multiple disease states, but this thesis will focus on its uses in the area of cancer, where most of the initial work has been.
1.2. The Problem
Tissue microarrays allow for high-throughput expression profil-ing of tumor samples by evaluatprofil-ing potentially interestprofil-ing
candi-6
date genes and proteins, identified by other techniques, on a large number of well-characterized tumors.
They can be used to investigate panels of molecules, trying to characterize solid tumor development or tumor progression. Moreover TMA studies have the potential to be translatable to a clinical application such as the development of diagnostic bio-markers (e.g., AMACR [15]) or a potential to therapeutic target (e.g., Her-2-neu [16]).
The TMA approach can be technically described as follows. It gathers into one paraffin block up to hundreds of minute tissue samples. Usually more than one sample from each patient is in-cluded (sample replicate) to ensure tumor representativeness. Slices of this ‘block array’ are then analyzed by in situ methods on glass slides, evaluating DNA, RNA or protein targets, for iden-tification of specific phenotypic (immunohistochemistry and in situ hybridization) or genotypic (fluorescence in situ hybridiza-tion) alterations. Immunohistochemistry technique is most com-monly performed, allowing the investigation of protein expres-sion by analyzing the reaction of protein specific antibodies (biomarkers).
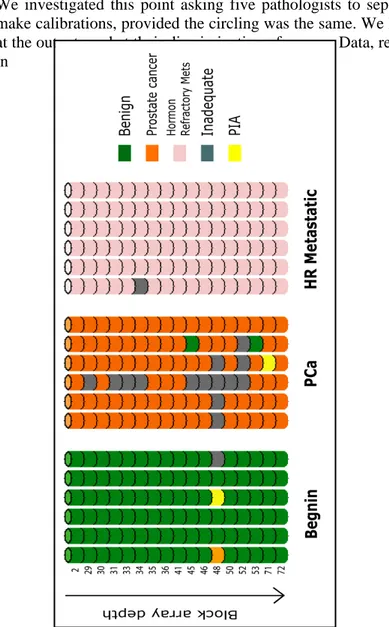
The TMA technique is thus appropriate for population screening studies. The information you can get are best viewed on a popula-tion basis and not on an individual patient basis. Thus the ques-tion being asked is not if patient A, B, or C demonstrates expres-sion of the biomarker in question, but instead, how often is this biomarker expressed in a population of individuals with a given disease state? Is this a commonly expressed gene? Is it expressed only rarely? Is it expressed only in patients who go on to have a worse outcome?
In TMA experiments, as with all high throughput techniques, high quality experimental data production is extremely important for the reliability of data analysis. This critical issue needs to be ad-dressed on two levels, i. critical assessment of experimental
de-7
sign and organization and ii. reliability assessment of experimen-tal data together with data preprocessing. In order to best deal with these two issues, a technological approach is advisable to properly manage data heterogeneity (biological, clinical and tech-nical variables), data quantity and user diversity. This last aspect becomes even more crucial if data sharing occurs among and be-tween research groups. Technological aspects may include auto-mation to speed up data acquisition and evaluation that can be of great impact in overcoming TMA studies bottlenecks.
Adequately tackling these problematic aspects is important to achieve good experimental results.
A fundamental phase of each study is then data analysis. Standard statistical approaches and supervised and unsupervised learning algorithms have been successfully applicable to TMA preproc-essed data in order to face prognostic predictive power assess-ments, classification tasks or new class discovery tasks. However efforts are continuously done to better address peculiar necessities of these new types of data, by elaborating new dedicated methods for data analysis. For instance, some authors recently proposed approaches [17][18] to properly manage classification tasks when the target are continues data. This approach fits scenarios where the biological question is how can I characterize patients with good or poor prognosis equally histologically diag-nosed/classified? Which is the profile that characterizes different clinical outcome data? Another issue that might be investigated regards the variability of measures in a classification problem. Standard approaches do not account for data uncertainty, which may be given by experimental multiple measures of protein levels on the same tumor (intra-tumor heterogeneity). Embedding this variability in classification models might add interesting informa-tion to data analysis outputs.
1.3. The Solution
To appropriately exploit the high-throughput nature of the TMA technique, a comprehensive approach to data management must
8
be applied. Knowledge Discovery and Data Mining (KDDM) [19] processes provide an ideal framework for bioinformaticians to fit: from understanding the domain, forming a consolidated dataset from data sources, cleaning the data by selection and preprocess-ing, extracting regularities in the data and formulating knowledge in the form of patterns and rules.
The solution we propose here is a systematic approach to process-ing and better understandprocess-ing data generated in TMA based stud-ies.
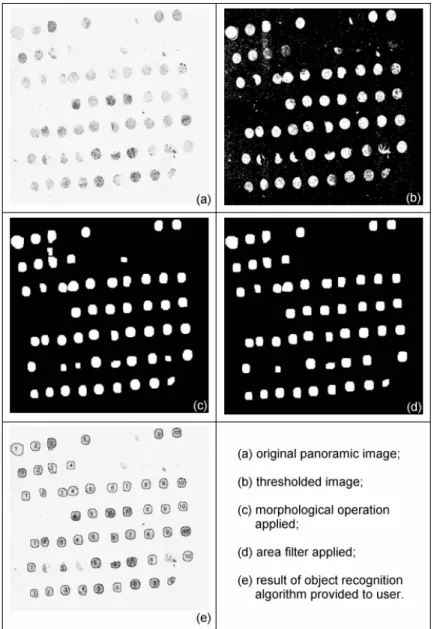
Through a strong interdisciplinary approach, we tried to address all the issues related to this topic. In particular, we aimed to sup-port both data collection from different users and data sharing across different institutions through a web based approach [20]. To support automation we employed digital pathology for acquir-ing digital images of sacquir-ingle tumor sample on a glass slide and as-signing them to the donor tumor automatically [21] through im-age processing and object recognition algorithms. Fully automatic evaluation of specific biomarker categories have been developed in order to avoid subjectivity problem and fully exploit the vari-ability range of gene expression [22].However while full automa-tion may be the Holy Grail in these experiments, currently careful supervision is still required to ensure that the samples are prop-erly classified.
This thesis addresses TMA data pre-processing issues, identifying critical points and some solutions. These models were tested on three TMA studies driven by different biological/clinical ques-tions. The results of these three studies are presented in this the-sis.
We also focused on the specific issue of accounting for data un-certainty in classification. We propose a novel classification model based on a Bayesian hierarchical approach. This model was tested on simulated data and on a real protein data set finding interesting differences, when compared to a standard Bayesian approach.
9
1.4. Innovative Aspects
We present a new comprehensive system for the management of TMA experiment data (TMABoost) from tissue data collection to experiment design and gene expression evaluation. This system is able to handle a wide spectrum of studies and user requirements. This system integrates all the information related to TMA ex-periments, regardless of experiment design, overcoming the limi-tations of the systems that have been presented up to now. Our approach both reduces the possibility of errors and acceler-ates the data analysis step on reliable data, particularly with re-gards to the pre-processing phase. The system includes an image processing procedure and a robust algorithm for object recogni-tion to automatically identify each tumor sample on the digital image of a TMA glass slide, assigning it to proper grid location, speeding up the acquisition of corresponding digital image by al-most avoiding manual intervention. TMABoost allows data shar-ing among institutions and is also able to face data exchangeabil-ity needs [23]. An important aspect of our system is that, different from other academic systems or commercially proposed systems, it is patient based and not experiment based.
Another innovative aspect we propose regards the treatment of uncertainty in the context of classification. The classification model is based on Bayesian hierarchical approach. It allows em-bedding in the classification model the tumor intra-variability (heterogeneity of protein levels across tumor tissue), using the tu-ple of protein level measurements of each case instead of unique representative value, as done by conventional approaches.
1.5. Structure of the Thesis
The second chapter of this thesis reviews the state of the art of TMA field with respect to data management and data analysis tasks. The third chapter introduces problems of performing mo-lecular profiling at protein expression levels, from data handling point of view. Insights in TMA experimental technique and in situ
10
investigation methods are provided to illustrate TMA data sources. The chapters 4, 5, and 6 describe the TMABoost man-agement system, the TMA data analysis steps with particular at-tention to the preprocessing aspect, and the classification model we propose together with the performances we obtained. Chapter 7 includes three examples of TMA based studies we conducted, focused on different biological questions. The chapter 8 summa-rizes and discusses the problem and the proposed solutions and outlines on-going and future work on this topic.
1.6. Notes
Part of the work presented here has been granted by the Italian Ministry of Health (“Programmi speciali” – Art. 12 bis, comma 6, d.lgs. 229/99).
During the three years training period I applied for a three months stage at the CHIP (Children’s Hospital Informatics Program, Bos-ton, MA, http://www.chip.org/). During that period of time I col-laborated with members of the Rubin laboratory (Mark A. Rubin, http://rubinlab.tch.harvard.edu/) at the Brigham and Women’s Hospital/ Dana Farber Harvard Cancer Center/ Harvard Medical School in Boston, being involved in TMA experiments for the study of prostate cancer progression. This work was funded by the National Cancer Institute of the NIH (U.S.A.) Prostate Cancer S.P.O.R.E. program.
11
Chapter 2
2. State of the Art
To facilitate the in situ investigation of molecular markers in tu-mor samples, the tissue microarray (TMA) technique was recently developed [12]. TMA technology allows researchers to assemble hundreds of tumor samples into a single paraffin block. Sampling has been a major concern regarding TMA technology. How well do tissue samples, often with a diameter of 0.6mm, represent the entire tumor? Many of the initial TMA studies addressed this is-sue, by estimating the number of core replicates necessary and sufficient to achieve same results that would be obtained with conventional glass slides [24]. Another approach is to estimate the number of required cores to have evidence of well known as-sociation of a protein with some histological or clinical variables [25][26]. Some authors [27] also report that the sampling issue can be ignored and one core for each patient is sufficient for al-most all TMA based study purposes. These different approaches suggest that there is no unique answer to the question of sam-pling. Perhaps the most critical deciding factor depends on tissue homogeneity and biomarker characteristic.
There have been also some attempts to formally compare the con-sistency of TMA analysis from one center to another. However, only a few of these have been published to date [28].
In the last few years an increasing number of studies has been published based on TMA technique, mostly aimed to investigate single protein expressions [29] to assess diagnostic or prognostic marker capability. TMA have recently been used to analyze pan-els of proteins trying to characterize specific disease molecular profiles [9].
12
Even more recently, TMA based investigations are included in cross platform approaches [30][31].
The focus of this chapter is not to review all of the biologic stud-ies associated with TMA, but rather to focus on those research studies aimed at managing TMA data with respect to data collec-tion, data organizacollec-tion, data analysis and data sharing.
In the setting of high throughput experiments where considerable amounts of heterogeneous data are present and many parameters are involved, the lack of appropriate tools to handle experiments and data represents an important problem for the future of the TMA field with respect to data interpretations. Moreover, inte-grated and comprehensive solutions would work for emerging studies, which could share previously studied cohorts or could in-clude previous detected information and knowledge, taking ad-vantage of well organized databases.
Another important feature of TMA based studies is the growing need to share data and information among different institutions (e.g., multi-center studies, clinical trials, etc.). In such a setting, the implementation of standard data exchange protocols becomes critical as up to now there have not been standard approaches to collecting data at different institutions and sometimes even within the same institution and as centralized solutions are not feasible. As a result of several TMA workshops in the area of TMA bioin-formatics, some authors have reported [23] on a community-based, open source tool for sharing tissue microarray data; the ex-change specification approach is based on a well-formed XML document. Others [32] proposed a specification of semantic meta-data schematics for TMA in a peer-to-peer infrastructure design. As for data handling, the use of a large spreadsheet has been the standard solution. This approach is useful for experiments on a one-time basis, but becomes very cumbersome when analyzing multiple markers on a given specimen or when having multiple observers render diagnoses and scores on a given specimen [33].
13
A grid sheet for scoring and analysis and a spreadsheet containing the list, type and position of each tissue core are, for example, provided by the Tissue Array Research Program. It is a collabora-tive effort between The National Cancer Institute and The Na-tional Human Genome Research Institute (http://ccr.nci.nih.gov/tech_initiatives/tarp/), which primary ob-jective is to develop and disseminate Multi-Tumor Tissue Mi-croarray slides and the related technology to the cancer research investigators.
Few papers have been published so far on TMA data organization and management. Liu et al. [34] presented a system for high-throughput analysis and storage of TMA immuno-staining data, using a combination of commercially available software and novel software. Similarly, Shaknovich et al. [35] proposed a way to manipulate TMA data and images, using commercially avail-able software. Manley et al. [36] highlighted the peculiarities re-lated to high density information glass slides, providing a source of inconsistency between tissue core sections and donor blocks identifiers. They proposed the used of a relational database for the better organization of TMA data. A validation study of the proto-type system was then published [28].
Recently a web-based prototype for imaging, analyzing and ar-chiving TMAs was proposed [37], mostly focusing on automatic evaluation of biomarkers. It also faces the problem of automati-cally extract single tissue locations to allow unsupervised regis-tration of arrays, proposing an approach which works well with rigid rotations of the core section array on the glass slide.
Academic groups are working on the development of systems in-tegrating commercially available software for the acquisition of digital images and the automatic evaluation of markers with cus-tom solutions of data organization and management.
For instance, the TMA Profiler system developed in Rubin labo-ratory (http://rubinlab.tch.harvard.edu/htma/profiler/index.jsp) in-tegrates the Chromavision system outputs (Chromavision Medical Systems, Inc., San Juan Capistrano, CA. Automated Cellular
Im-14
aging System (ACIS II)) in a web based platform to handle TMA experiment data (see additional data in [92]).
Similarly the Johns Hopkins TMA Laboratory, (http://tmalab.jhmi.edu/) employs an open source software (for academic use) to manage a TMA Database, TMAJ [38]. It allows the storage of a wide variety of information related to TMA sam-ples, including patient clinical data, specimens, donor blocks, core, and recipient block information. A dynamic database struc-ture allows users to add custom fields for different organ systems. The client application facilitates automated and manual entry of data related to patients, specimens, tissue blocks, and tissue sub-blocks (individual pathological diagnoses). The system allows us-ers to design their own. Digital images generated by the Bacus Labs Inc. Slide Scanner (BacusTM laboratories, Lombard, IL, http://www.bacuslabs.com/) are imported into the database and available for on line visualization and evaluation.
The AQUA system [57] uses a custom imaging microscope sys-tem for scanning TMA slides stained with fluorescent markers. It uses an object recognition approach to exactly identify the spatial coordinate of each spot, but lacks in ordering and assigning them to proper patient and/or clinical information based on construc-tion informaconstruc-tion.
Some other systems aimed to automatically acquire and evaluate TMA samples are available, such as the TMALab ™ (Aperio te-chnology, http://www.aperio.com) or the Pathfinder
TM
Morpho-scan™ (http://www.imstar.fr/).
These solutions are appropriate to handle very good quality TMA slides, usually by superimposing a grid on the panoramic over-view of the slide, but they require considerable manual interven-tion if the samples are distorted (for instance, asking the user to fit the edge of each grid cell appropriately in case of misalignments). With respect to data processing, usually conventional approaches are taken in handling TMA data. The most common approaches are statistical and machine learning ones. Some TMA studies have attempted to address a few issues related to data analysis
15
(see chapter 5) such as dealing with dichotomization protein ex-pression levels and pooling data from replicate tumor samples [39][40].
Usually replicate tumor samples are included in TMA dataset in order to account for tissue heterogeneity. The pooling of protein level measurements detected on replicate samples is commonly straightforward adopted, therefore neglecting part of the informa-tion. An approach to model data uncertainty is proposed by Bhat-tacharyya1 et al. [41]; they include the data uncertainty in classi-fication and relevant feature identiclassi-fication algorithms based on robust sparse hyperplanes, by associating each data point with an ellipsoid parameterized by a center and covariance matrix. A dif-ferent approach in handling the data uncertainty may regard the use of multilevel models (or hierarchical models) [42][43], suit-able to analyze information availsuit-able at different levels of obser-vation units (as for example, in meta-analysis of separate random-ized trials).
17
Chapter 3
3. Molecular profiling at protein
expres-sion
3.1. Scenario
Gene expression is the process by which genomic information is converted into the structures and functions of a cell, by producing proteins from DNA coding sequences (see Figure 2). Genomic expression is more and more under investigation, trying to depict molecular profiles characterizing specific disease states. New technologies, microarrays, allow tracking the translation of ge-nome sequences into gene functions (functional genomics), lead-ing to the identification of highly informative genes and pathways with potential impact on understanding disease development and progression [44], concurring to improve diagnostic and treatment modalities and to detect targets for new therapies [45]. Despite different kinds of investigation, all microarrays generate large datasets by simultaneous detections under the same experimental conditions. In particular DNA microarrays (DMAs) analyze mRNA expression, and Tissue microarrays (TMAs) evaluate DNA, RNA or protein targets through in situ investigations (analyses performed on tissues).
18
Figure 2 - Gene expression (Picture taken from National Human Genome Research Institute (2001)). [Gene expression is the process by which a gene's information is converted into the structures and functions of a cell. Gene expression is a multi-step process that be-gins with transcription and translation and is followed by folding, post-translational modification and targeting. The amount of pro-tein that a cell expresses depends on the tissue, the developmental stage of the organism and the metabolic or physiologic state of the cell.]
Microarray technology is extremely powerful because of the high-throughput nature of the approach, giving great advantages with regards to experimental execution time and experimental homogeneity, both being particular relevant for comparative stud-ies.
In molecular profiling studies of human cancer, integration of DMA and TMA experiments provides a powerful approach;
19
genes selected by DMA studies can then be simultaneously inves-tigated by pathologists on large set of well characterized solid tumors by immuno-histochemical or nucleic acid hybridization techniques.
3.2. Data management problem
How can we make sense of all the data produced by these high throughput technologies? How can we be sure that our data are of good quality and therefore that data analysis results are reli-able?
Common critical points of these new experimental techniques are data control and data quality, which should be account from the assessment of experimental data production and collection to data interpretation.
In TMA studies, data collection and organization are extremely relevant: heterogeneous data types are included in studies (gene expression levels, histopathological data, clinical data), several data sources are involved and the evaluation procedure of gene expression levels on TMA samples is definitely prone to error [45], as for instance association errors in designing the block ar-ray or evaluating a slide may easily occur.
Efficient retrieval of data is also desirable, both as TMA studies are usually based on several single experiments on the same co-hort of patients and for new experiment design. Data and informa-tion sharing is also mandatory as often multi-center studies are performed.
Components to be considered in this context are thus i. critical as-sessment of experimental design and organization, ii. reliability assessment of experimental data and iii. technological support to organize and collect data, also implementing automation.
As far as data organization is assessed the problem shifts to data analysis and interpretation. Even if a lot of work has been done on gene expression data analysis and traditional approaches might be successfully applied very often, the TMA data analysis phase is not trivial. Great attention in preprocessing phase should be
20
adopted; appropriate analysis approach must be carried out de-pending on specific biological or clinical question. (i.e. hypothe-sis driven studies).
Even if technical support is provided and automation is employed to speed up the experimental process, a very important step is data preprocessing. Contrarily to what happens on cDNA mi-croarrays where single elements are processed, tissue samples are part of solid tissue, thus being spatially heterogeneous. Every TMA glass sample, even if consecutively obtained, contains slightly different tissues (see section 5.3.1).
Another kind of heterogeneity is addressed by intra-tumor hetero-geneity: protein expression may vary across the tumor. Multiple measures of protein expression on the same tumor must be han-dled during data analysis. The latter is a problem that is usually skipped in TMA data analysis, as conventional statistical and ma-chine learning approaches do not account for data uncertainty. To efficiently and practically face the above mentioned problems a strong interdisciplinary effort must be done. Accurate attention must be given to all the aspects concerning this experimental technique and its possible integration with experimental data ob-tained with other platforms.
Knowledge Discovery and Data Mining (KDDM) [46][47][48] processes provide an ideal framework for bioinformaticians to fit: from understanding the domain, forming a consolidated dataset from data sources, cleaning the data by selection and preprocess-ing, extracting regularities in the data and formulating knowledge in the form of patterns and rules.
Lack of integration and uncontrolled data collection activities not only affect study results, but also damage future activities sharing same patient or same data or protocols, which could have taken advantages of all previous work.
21
The next session describes TMA techniques with particular em-phasis on common problems that can affect experimental condi-tions.
3.3. Tissue Microarray Technique
The first attempt to increase the throughput in terms of number of samples for simultaneous in situ analysis was proposed by Batti-fora [49] in 1986 with the ‘tissue sausage’ technique. The intent of this “tissue sausage” was to increase throughput in the evalua-tion of antibody staining properties for a variety of tissue types. The Tissue Microarray [12] technique improved on the haphazard arrangement of the tissue samples and by placing the samples in an ordered array allows for high-throughput in situ experiments using immunohistochemistry, FISH, or in situ hybridization. The TMA approach has a dramatic advantage over the conventional approach in performing in situ experiments on standard glass slides. The standard approach requires performing many experi-ments on separate slides with the major drawback of inter-experimental differences due to variability of staining from one slide to the next and an inefficient use of tissue samples. The TMA approach allows for the simultaneous staining of hundreds of tissue samples from as many patients. Thus this TMA approach is a high throughput process, which ensures experimental stan-dardization across all patient samples (i.e., all tissue samples are pre-treated and treated under identical conditions). Perhaps one of the most critical advantages is that TMA technologies conserve the limited tissue resource, which is vital given the increasing number of candidate genes that need to be explored.
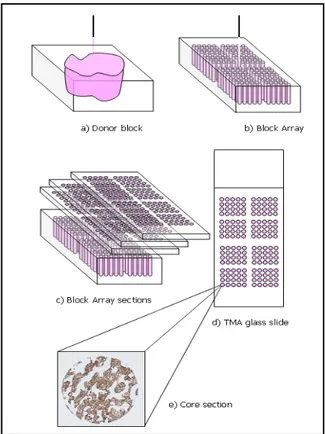
The TMA technique is demonstrated in schematic form in Figure 3. Tissues are arranged in a pre-ordered matrix. Cylindrical tissue biopsies are transferred with a biopsy needle from carefully se-lected morphologically representative areas of original paraffin blocks (donor blocks). A hematoxylin and eosin (HE) stained sec-tion of the donor block is usually aligned to better locate the rep-resentative areas. Core tissue biopsies are then arrayed into a new
22
“recipient” paraffin block by using a manual or an automated tis-sue arrayer (e.g. Manual Arrayer, Manual Arrayer, Beecher In-struments Inc, Sun Prairie, WI, USA), using a precise spacing pattern along x and y axis, which generates a regular matrix of cores. TMA topology design is not unique and may vary depend-ing on the study design, number of tissue cores, and the types of potential experiments.
A TMA block (block array) can theoretically contain over 1000 cores but for practical reasons, most experts in the field do not place more than 600 hundred tissue biopsies on a single block. The number of samples may also vary depending on the needle diameter used to transfer the samples (from 0.6 to 2 mm in diame-ter) [12][45]. TMA sections are serially obtained at 4-5 microme-ters thickness [50] with a microtome, a precision instrument de-signed to cut uniformly thin sections of materials for microscopic examination purposes. About 150 sections can typically be ob-tained from one block array. However, the number of sections will ultimately depend on the depth of the tissues originally placed into the recipient block. [51]. Construction of identical TMA blocks (settled up with the same donor materials and in the same order) is also common, to further scale up the method.
23
Figure 3 - Tissue Microarray Technique scheme.
Sampling is always a concern in the field of pathology. Rarely do pathologists review an entire organ but instead take representative samples. TMA technology is no exception to this common prac-tice. How well these tissue samples, often as small as 0.6 mm in diameter, represent of entire tumors has been the focus of several recent studies [52][53][54]. Some authors [55] also report that be-cause TMAs are mostly intended for population level screening tool than for diagnoses on individual cases, this aspect is not criti-cal. The results of those studies are dependant on tumor types and study purposes. A biomarker with homogenous expression
24
throughout the entire tumor will not require as many samples as a biomarker that is only focally expressed by the target tissue. In order to capture some of the intra-tumor heterogeneity, multiple cores are often taken from each donor block and arranged in the same block array.
3.3.1 Common problems with TMA section preparation During the preparation of TMA slides, due to technical problems the content and/or the perfect alignment of the array may be al-tered. For example, as the donor tissues may not all have the same depth, as one cuts deeper into the TMA, some individual TMA cores will disappear due to the absence of that particular tissue core (i.e., exhausted tissue). Core sections may be fragmented during the cutting process with even the most sensitive micro-tome. The transfer of the TMA section from the microtome onto the glass slide may also lead to tissue loss. Through imprecise processing, the array may be distorted and one or more rows and/or columns may be bent, folded or moved from their original position (see Figure 14).
To reduce the array distortion and bending problems, the TMA sections may be placed on the slides using a tape transferring sys-tem (Instrumedics, Hackensack, NJ). With this syssys-tem the sec-tions are captured flat and uncompressed on a tape-window as they are cut and then transferred to an adhesive coated slide. This procedure, adopted by many laboratories, requires altering slightly the staining protocol. The tape system reduces distortions and bending problems, but, with varying degrees of frequency, misalignments are almost always present even on the highest quality TMA samples.
Due to tissue heterogeneity, the original targeted tissue placed into the TMA may appear different as one goes deeper into the TMA block. This is expected given the 3 dimensional nature of the samples being used. This limitation requires that the samples be evaluated repeatedly at all layers.
25
3.3.2 In situ investigation
All in situ experiments that can be performed on standard tissue sections can also be performed using TMAs. The TMA approach has the added advantage, however, of being able to increase throughput and limit experimental variability often encountered with standard slides. TMAs can be used to detect DNA, RNA or protein expression, by using in situ hybridization or immunohis-tochemistry[56].These methods do not alter the tissue morphol-ogy and therefore information on distribution of the expression within the tissue can be obtained at the level of individual cells, even in cases where the expression occurs only in a few cells. One major advantage of examining expression in situ is the abil-ity to determine the exact location of expression down to sub-cellular level. For example, expression of a biomarker such as beta-catinin in colorectal cancer has a dramatically different meaning whether it is expressed in the cell membrane (inactive form) or in the nucleus (active form) [57]. Expression detection and localization concur to potentially interesting information. The expression evaluations of these in situ tests have been tradi-tionally performed by pathologists using microscopy (either bright or dark field). For example, immunohistochemical experi-ments are often evaluated by pathologist for staining intensity us-ing a four nominal point scale (negative, weak positive, moderate positive, strong positive), and the percentage of the stained area. However, the human eye, even if trained, cannot detect subtle dif-ferences in staining intensity on a continuous scale, in particular at very low and very high levels of the scale. Moreover it is well known that nominal categories are subjective and inter- intra-observer agreement is usually poor. In contrast, automatic detec-tion of immunostaining provides continuous quantitative meas-ures, also ensuring reproducibility due to objectiveness of the measurements (see chapter 5.2). More recent work in the field of TMA biomarker development has focused on the use of semi- or fully-automated image processing. The continuous quantitative measurements obtained by automatic evaluation can better detect
26
the information of the investigated target, allowing the detection of subsets of tumors not seen using human/pathologist based as-sessments as demonstrated in [57], where fluorescent probes were used.
3.3.2.1. Immunohistochemistry
Immunohistochemistry is the process of detecting protein expres-sion in situ using antibodies targeted at the protein of interest. The antibodies used can be polyclonal or monoclonal in origin, the monoclonal ones being more specific in nature. Immunohisto-chemistry is widely used in the evaluation and diagnosis of can-cers and other disease states. Therefore, most practicing patholo-gists are familiar with this technique. Regardless their source (monoclonal, polyclonal or recombinant) not all antibodies work equally well. Specificity, sensitivity and antigen preservation must be considered [56]. False positives can be due to cross-reactivity with related or unrelated epitopes. False negatives can arise when the antibody fails to recognize the epitope within the tissue, the epitope was altered by fixation, the epitope is present at too low level or it is inaccessible for the antibody due to other reasons (protein-protein interactions, cross-linking or modifica-tion).
Pre-processing technique may also play an important role in the performance of these in situ techniques. Tissues are routinely placed into a fixative such as a 10% formalin solution. After a variable time in this fixative, the samples are embedded in paraf-fin blocks. This procedure is used to preserve tissue morphology and stabilizing the tissue from degradation, but a drawback is that it can modify target antigens. For routine purposes, probably 99% of all processed tissues reside in this state. An alternative, most often associated with research protocols or molecular analysis, is the procedure where samples are snap frozen requiring no fixative such as formalin. Research investigators are developing arrayers
27
capable of handling frozen tissue samples instead of paraffin-embedded ones [39][58].
29
Chapter 4
4. The TMA data management system
Before construction of our TMA management system, we took into consideration some of the critical issues related to the stan-dard needs and requirements of TMA experiments:- TMA studies may often involve considerable numbers of patients, heterogeneous data are involved, and different kind of users interacts at different times. Users are often from different institutions;
- TMA technology is prone to several common types of errors: association errors in designing the block array or evaluating a slide may easily occur;
- Patients included in a TMA study (included in one block array) might be later on included in some other TMA studies or tissue based studies. (One to many type of rela-tionships need to be considered).
These observations led us to develop a system with the following features:
i. patient centered and not experiment centered,
ii. work flow oriented accounting for all phases of TMA experiments (patient data collection, design experiment, data production),
iii. optimal level of automation,
iv. web based to allow for easy access and strong inter-institutional capabilities.
Based on these guidelines we constructed a system, where me-dium-long term advantages are data sharing, data quality en-hancement and data reusability. We paid attention to balance flexibility requirements and constraints in user interface imple-mentations, in accounting for the storage of all the details that
30
make an experiment reproducible (for ex. staining preparation protocols, digital image acquisition setting as lamp intensity, fil-ters) and speeding up data acquisition and evaluations implement-ing automation.
4.1. User Requirements, Need Assessment and System
Development
Need assessment and user requirements have been defined, col-lected and analyzed from the very beginning of the work/project. We conducted face-to-face interviews with the different potential system users, focusing on workflow definitions and working con-straints.
We took advantage of an already available common working lan-guage between the potential system users and our group, due to previous collaborations. The main potential users of the system are pathologists, biologists, laboratory technicians and clinicians. Modifications of system features were adopted not only during the course of the system design phase but also during the imple-mentation phase and test phase, consistently with generic life cy-cle models [59].
We implemented a first prototype running in local environment. During a four month period of usage, we collected comments and observations on data flow and interface acceptance. Modifications were then implemented in the web version of the system.
4.2. TMABoost System
The TMABoost system [60] consists of i. a web based application to collect all data involved in TMA studies: patient and tumor data, donor block information, block array information, array slide staining, core section evaluations, etc., ii. a relational data-base to store the data and iii. a digital TMA environment data-based on the usage of a robotic microscope and image processing algo-rithms to exploit digital pathology [61][62]. This environment automatically acquires glass slide overview images and single
31
core section images. Images are stored in the database and can be visualized by pathologists through the web interface. Moreover, automatic quantification of biomarker expression can be com-puted on these digital images, avoiding subjectivity in human evaluation and allowing novel associations thanks to the continu-ous nature of produced data.
The choice of developing a web-based system was driven by dif-ferent motivations. First, a web-based system facilitates the col-lection of data from several institutions, providing access from virtually everywhere with an Internet connection. As studies be-tween multi-centers is becoming more and more common, this system needed to be capable of gathering material, information and clinical data for specific research purposes from multiple sites. This web-based system also allows pathologists from these different institutions to evaluate the same TMA images.
In the following sections the system will be presented in terms of system architecture and system components separately. This al-lows describing more intuitively system functionalities, data in-put, data retrieval and automated data collection. In particular we describe i. the system core, composed by a relational database, a middle/processing layer, and a web browser interface, and ii. the Digital TMA Environment.
4.2.1 System Architecture
Due to the functional requirements the general architecture of the system has been designed following standard web-based 3-tiers architecture [59].
System modules are logically grouped into three layers (see Figure 4) for which a brief description is here reported.
The presentation layer is the representation of the system state to the user. It is made of two modules: the web browser and the Digital TMA Environment. Web pages are mostly Dynamic Hy-per Text Markup Language (HTML) pages. We used Javascript language to provide several controls on user data entry. For pages
32
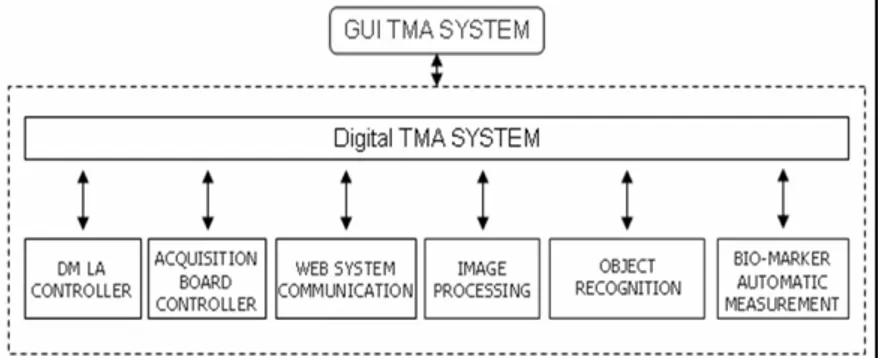
that require a lot of data entry, we used eXtended Markup Lan-guage (XML), together with Microsoft XML DOM, both to or-ganize and represent the information. This solution, coupled with Javascript code, allows performing some computation on the cli-ent side, reducing server workload and clicli-ent/server communica-tion. We used Microsoft Internet Explorer 6.0 as web browser. The Digital TMA Environment interacts with the database through the Web System Communication Module (see Figure 11). This module establishes a connection with the web server to re-trieve relevant information from the database: the block array map and the block array construction parameters, information re-quired for the object recognition procedure. Moreover, the Web System Communication Module returns to the server both the ac-quired digital images and the results of the automatic biomarker evaluation. Digital images are sent as an independent background process. This allows the user to perform other tasks, while trans-ferring the images. The overall activities of this module are per-formed seamlessly to the user.
The middle layer is made up by the web server; we used Micro-soft Internet Information Server 5.0. We employed Active Server Page (ASP) and Vbscript/Javascript on the server side to allow and control the communication between the user and the data-base. In addition the source code of the middle layer is written on a central server and thus system upgrades and improvements are easily performed and immediately available to all users.
A Secure Socket Layer (SSL) has been established to ensure data encryption between the client (user workstation) and the server, preserving security and confidentiality of communications. More-over, authentication of the user is based on login and password that, thanks to SSL, are properly transferred to the central web server in a secure way.
The Digital TMA Environment can send images to the middle layer through standard HTTPS protocol. The middle layer then
33
stores them into the proper table of the database as Binary Large Objects (BLOB).
In the data layer we employed a relational database (Microsoft SQL Server) to store the data. SQL server is a XML enabled Database management System (DBMS) [63]. The database is im-plemented behind a firewall.
34
35
4.2.2 System Components
4.2.2.1. System Core: the database
A relational database [64][65] addresses data organization re-quirements in an efficient manner, enabling data consistency, cor-rectness, and completeness. Unique identifiers - automatically computed by the database engine - are used to link records be-tween different tables, giving considerable advantages in terms of performance. This solution allows avoiding inconsistencies in the data and, together with the middle layer, reduces possible errors in linking biological/genetic, pathological, and clinical informa-tion. The database management system we employed is Micro-scoft SQL Server 2000.
The relation diagram of the main tables is shown in Figure 5. Tables can be grouped as i. patient and tumor content tables (tb_paziente, tb_tumore_paz, tb_tu_metastasi, tb_tu_recidiva, tb_donor_block), ii. TMA experiment preparation tables (tb_block_array, tb_block_array_map, tb_array_slide, tb_core_section, tb_acquisizione_slide, tb_images) and iii. TMA experiment data tables (tb_valut_man_core_section, tb_valut_auto_core_section, tb_images_analysis).
In addition, there are nine auxiliary tables, mostly of them inde-pendent from TMA technique, containing system user informa-tion, tissue provenience informainforma-tion, histology classificainforma-tion, biomarker descriptions, laboratory protocol codes for block array and slides preparation, etc..
A one-to-many relation between the tumor table and the donor block table does not allow inserting donor block information, us-able for a TMA block design, without previously inserted tumour data.
Similarly, it is worth noting the relation between the donor block table and the block array map table: it ensures consistency be-tween tumour/patient data and the cores of the block array. This relation is crucial, as an error in the block array map propagates
36
along all experiments based on that block. The block array map is unique for each block array and every successive data related to one TMA glass slide relies on the map.
The system allows each core section be evaluated multiple times, both by humans (tb_valut_man_core_section) and by automatic procedures (tb_valut_auto_core_section). The one-to-many rela-tion between the array slide table and the acquisirela-tion slide table accounts for multiple acquisitions of the same TMA slide, for in-stance under different wavelength filter conditions, different lamp intensities, different field filters, etc..
Individual patient identifiers are not included in the database, which contains only de-identified data [48]. The system automati-cally assigns a unique code to each patient.
37
38
Database Roles/User profiles
The DBMS manages user authentications by Login and Password. The DBMS also manages user roles. Seven profiles have been de-fined, granting role-based access to system data; each profile dif-ferently allows operations on table records as select, insert, up-date, and delete.
Each user is associated to one or more profile.
The defined profiles are the following: technician, clinician, evaluator, pathologist, automatic evaluator, administrator, demon-stration user.
All the profiles have been granted read access to the database ta-bles and, with exception of the administrator, none can delete re-cords.
The technician role has write access on the tables concerning the donor block preparation, the preparation of the block arrays, the maps, and the staining of the glass slides. The clinician role has write access to the tables concerning the patient and the tumour. The evaluator role can insert data only in the core section evalua-tion table. The pathologist role has the broadest entry access to the database: it embraces all the permissions of previous users. The automatic evaluator profile is the one used by the Digital TMA Environment to access the database: it can insert data in the core section table and in the automatic evaluation table.
The demo user profile has been added to allow potential new us-ers to navigate into the system for a finite time period. The mid-dle/processing layer grants their access to a test version of the da-tabase.
Constraints to handle data ownership are not yet implemented. They will turn out to be useful to allow individual research group to share or separate their data, based on study and sample permis-sions. These permissions can in turn be used to securely limit ac-cess to specific specimens, blocks, array-blocks, and sessions.
39
Database Triggers
SQL Server supports using triggers as a kind of stored procedure. Triggers are commonly executed when a specified data modifica-tion (for instance an attempt to delete a row) is attempted on the table on which the trigger is defined. We implemented some trig-gers to seamlessly perform control or updating operations on data. For instance, any change in patient’s clinical data, such as status (alive with relapse, alive without relapse, dead for disease, dead for other causes), last follow up date, etc., automatically updates related information for survival analysis studies. Triggers can, on demand, be implemented on additional fields to address different endpoints. For instance, PSA failure in prostate cancer might have multiple definitions.
The usage of triggers is relevant, since clinical information can be repeatedly updated by different users.
4.2.2.2. System Core: the middle/processing layer
Besides allowing the communication between the user and the da-tabase, the middle/processing layer performs several processing steps to control data workflow. It provides the user with the proper interfaces for collecting and retrieving data, as better de-scribed in the following sections. Moreover, it controls user input performing a first filtering level on inserted data.
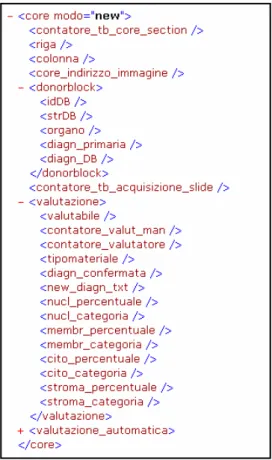
It also handles the communication with the database, by saving and requesting data. A fundamental aspect performed by the mid-dle/processing layer is mapping the relational structure of the da-tabase into a hierarchical one by using eXtended Markup Lan-guage (XML). This solution allows exchanging data back and forth between the client and the server in a more efficient manner, reducing communication workload, and performing part of the computation on the client side. For instance, when the user is evaluating a slide, all core section information is downloaded once from the database as a XML structure. When the user selects a certain core section, only the corresponding data are shown
40
through JavaScript code executed at client side (see Figure 6). The user then inserts or modifies core section evaluations through the HTML interface. Seamlessly to the users, these changes up-date the XML structure on the client side, by JavaScript code. Only when data are completely inserted or upon specific user re-quest the XML structure is sent back to the web server. The mid-dle/processing layer then processes the XML structure and ex-tracts the data in a suitable format to update the database.
Same approach can be implemented to extract data accordingly to every XML predefined structure, as the one proposed by [23] to exchange TMA data.
A key point of the middle/processing layer is the communication with the Digital TMA Environment (see Section 4.2.2.4). In par-ticular, the exchanged information regards array slides and block array maps, automatic biomarker evaluation data, and digital im-ages.
41
Figure 6 – XML extract: single spot description data and staining evaluation data.
4.2.2.3. System Core: the web browser interface
Particular attention has been given to the user interface design, addressing different needs of different users that operate in dis-tinct work phases; workflow needs, differentiated for input and retrieval phases have been considered.
The web system interface is divided in to two frames: a naviga-tion frame and a main frame. The naviganaviga-tion frame (see left frame
42
in Figure 7) allows the user to select different levels of informa-tion, as patient identification number, tumor and donor block data, block array or array slide data. For each group of informa-tion, inserting and retrieving pages are available in the main frame. Searching and retrieving data can be done through inter-faces that present the user with predefined criteria for specific queries (dynamic queries). Results are then reported as lists of tu-ples, sorted as requested. Result lists can be used to further navi-gate in to the system.
Different types of constraints are made on web interface level to increase data reliability. Constraints on most of the data insertion fields are employed. Controls on data type entries (date, string, numbers) are present, control boxes for list choices are imple-mented as far as possible (pick up tables). In some cases the list items depend on other selection. For example, during tumor data insertion as the organ is selected, the appropriate lists for T, N and M (Tumor-Node-Metastasis classification) are loaded. Accordingly to database constraints, some data fields are compul-sory (controls made when the user tries to save, before sending the data to the database) and some others allow for data entry only accordingly to database contents. The latter case occurs for the block array map insertion: to insert data of each new punch, a list with all the available donor block codes is presented to the user.
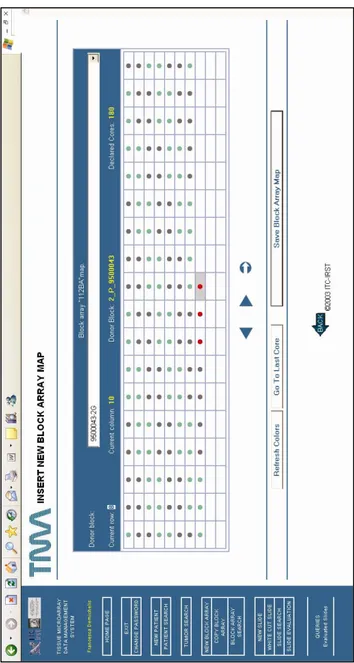
One specific example of data insertion capability would be how the system helps guide the technician/user through the design phase of virtually constructing a TMA. This procedure is care-fully defined i. to allow the user to select donor blocks to be asso-ciated to each cell from a list (no typing allowed), ii. to force the user to the pre-declared structure of the block array. To further help the technicians in the insertion phase of the block array map, some tools were implemented, such as an additional button to automatically insert data of multiple biopsies from the same do-nor block without reselecting it from the list and a graphical
solu-43
tion based on differentially colored map cells to visually identify such replicates (see Figure 7). This structure is highly preferred because block array map insertion is definitely prone to error. Eventually information about cuts/slices of each block array can be stored in the system at any time. At each new cut of a block array the system automatically assigns a label to it, composed by the code of the block array and an incremental number.
44
45
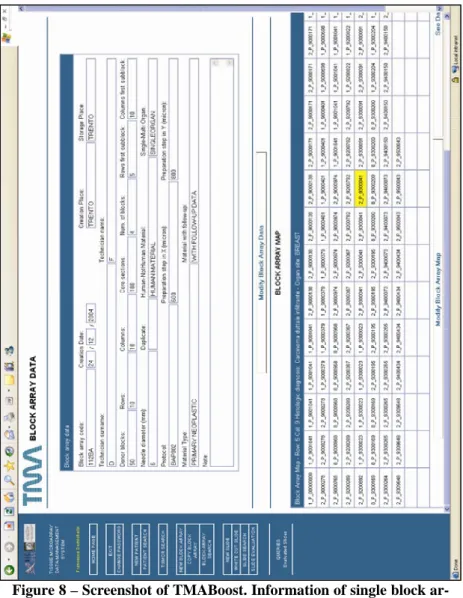
Figure 8 – Screenshot of TMABoost. Information of single block ar-ray made of 10 rows and 18 columns; preparation data and map of a block array is represented: as the mouse is moved over the map cells, data of the selected core appears on the top of the map.
46
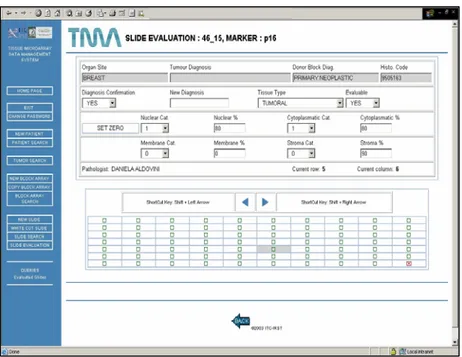
Another example of the web interface is given in Figure 9. It shows the system interface for the input and the retrieval of bio-marker evaluation of a single glass slide. Mouse clicks or shortcut keys can be used to move across the slide map, which is auto-matically prepared on the basis of corresponding block array stores data. In the top frame two types of information related to the selected core section are shown, i. data of the donor block where the core section comes from (tissue type, diagnosis), and ii. core section evaluation data (possible evaluation of the spot, di-agnosis confirmation, biomarker evaluation data). The user may decide to visualize single core section images during slide evalua-tion or visualizaevalua-tion, moving from one core secevalua-tion to another. Shortcut keys have been implemented to ensure fast data inser-tion.
Multiple evaluations of the same TMA slide are feasible and each is designated as a separate session. Each user (associated to the evaluator or pathologist profile) can edit only its own evaluations.
47
Figure 9 - Biomarker evaluation: TMABoost interface; the upper window shows the image of the selected core section.
4.2.2.4. Digital TMA Environment/ TMA Acquisition Environ-ment
To ensure comprehensive information storage and large scale analysis, digital images of glass slides and of single core section must be acquired and stored.
The storage of digital images of each core section has two main advantages:
- it makes tissues available to pathologists involved in specific studies through the web, enabling on screen core section evaluation or review;
48
- it allows the automatic evaluation of gene and pro-tein expression through image processing routines, avoiding subjectivity (see Figure 12).
Provided digital images are almost mandatory at least to offer complete information storing of TMA experiments, an efficient solution must be found to speed up this phase.
In addition, future changes in editorial policy may require submit-ting all images associated with TMA studies at time of review and publication, as is common practice with expression array studies. A key point of the present system is given by the integration of an automated digital TMA acquisition system, ‘connected’ to the TMA database through the web server.
The TMA acquisition system employs a robotic microscope, which is a microscope drivable by software in each movement: stage movement on x and y axes, magnification change, z-axis movement, auto focus, etc. Robotic microscopes are largely used for telepathology applications, for the creation of digital slides (entire histological or cytological specimens) for several purposes [62] and recently for the acquisition of TMA slides.
An interface for a robotic microscope was already designed by our group to handle so called digital cases, sets of digital images representing whole glass slides.
Heavy modifications on the previous work were done to face TMA sample peculiarities. See Figure 10.
Comparing to conventional digital slide, the pedant acquisition of entire slide section is useless, as information (tissue) is not con-tinuously spread on the glass, rather spottily localized. At the same time, checking on the fly if an image contains or does not contain tissue is not an efficient solution; in fact, depending on camera target and on magnification it might happen that, pedanti-cally acquiring the slide, a portion of tissue is always present. Therefore a different approach should be applied.
Another aspect to be considered is the need to correctly associate each core section and, therefore the corresponding digital image,