UNIVERSITA
'
DEGLI STUDI DI TRENTO-
DIPARTIMENTO DI ECONOMIA___________________________________________________________________
COMMODITY PRICES AND DEBT
SUSTAINABILITY
Christopher L. Gilbert
and
Alexandra Tabova
_________________________________________________________ Discussion Paper No. 4, 2004
The Discussion Paper series provides a means for circulating preliminary research results by staff of or visitors to the Department. Its purpose is to stimulate discussion prior to the publication of papers.
Requests for copies of Discussion Papers and address changes should be sent to: Dott. Edoardo Gaffeo
Dipartimento di Economia Università degli Studi Via Inama 5
Commodity Prices and Debt Sustainability
Christopher L. Gilbert
Alexandra Tabova
Initial draft: 20 January 2004Abstract
We consider schemes which gear service on concessional debt to export earnings and oil import expenditures. The schemes operate by accelerating and retarding debt repayments, and are structured as overlays in which existing debt contracts are augmented by a set of floating for fixed swaps, where the swap prices are defined in terms of the world prices of the export commodities. We analyze the effectiveness of schemes through counterfactual simulation of the debt service of ten moderately or highly indebted commodity-dependent African economies. The results are mixed. The schemes do ease the debt service burden and can also offset the variability of export earnings but only to a limited extent. The explanation for this mixed performance is that changes in export earnings are not highly correlated with changes in world commodity prices – both because of differences between world prices and the prices obtained by individual exporters, and because of quantity variation.
This paper is based on an earlier paper, “Realignment of debt service obligations and ability to pay in concessional lending: feasibility and modalities” which was commissioned by the World Bank. Versions of that paper were presented at a workshop on Debt Sustainability in Low Income Countries organized by the Commonwealth Secretariat in Accra, Ghana, June 2003, two subsequent World Bank workshops and an Expert Group Meeting on debt sustainability organized by the United Nations Economic Commission for Africa in Dakar, Senegal, November 2003. We are grateful to Joshua Aizenman, Ron Anderson, Angelique DePlaa, Mark Dorfman, Vikram Nehru and Panos Varangis for comments on earlier drafts; and to Karina Garcia-Casalderrey, Shane Streifel and Joe Thornton for assistance. The opinions expressed here are the authors’ and do not necessarily reflect the official views of the World Bank. All errors remain our own responsibility.
Gilbert: Dipartimento di Economia, Università degli Studi di Trento, Italy. Tabova: FEWEB, Vrije Universiteit Amsterdam, The Netherlands.
Email: [email protected] and [email protected]
Keywords: HIPC, sustainable debt, commodities, swaps JEL Classification: O19
“There is, on this subject of commodities, a sort of conspiracy of silence. There are no simple solutions. Many of the remedies introduced in the past – especially the major commodity agreements – have failed and we do not want to repeat these experiences. Yet there is no justification for the current indifference.” (President J. Chirac).1
1. Introduction
Primary commodities have recently moved back towards the centre of the debate on development, and in particular, the attainment of the Millennium Development Goals (MDGs).2 This renewed focus arises out of the realization that the majority of the poor live outside cities and that the reduction of poverty foreseen by the MDGs must therefore, in large measure, depend on rural development. The declining prices and high price volatility associated with “traditional” tropical export crops have tended to exacerbate problems of rural poverty over the past two decades. President Chirac, in the speech quoted at the head of this paper, records that seventeen sub-Saharan African countries depend on non-oil primary products for over 75% of their exports.
The commodity dependence problem interacts with problems deriving from indebtedness. According to the IMF (2003a, p.9), the most typical cause of indebtedness “is that the financing provided … did not generate the economic growth envisaged, or, in other words, … borrowing decisions were predicated on growth projections that never materialized”. In more technical parlance, an adverse selection problem implies that the group of severely indebted countries will contain a disproportionate number of poor countries which have failed to
http://www.france.diplomatie.fr/actu/bulletin.gb.asp?liste=20030224.gb.html
1 Speech on agricultural development to the Twenty-second Summit of the Heads of State of Africa and France, Paris, 21 February 2003
achieve planned or projected growth rates. Failure to diversify away from traditional primary exports is one cause of such growth shortfalls.
This has particular relevance to the Heavily Indebted Poor Countries (HIPC) Debt Initiative agreed by the IMF and World Bank in 1996 and extended in 1999. The Enhanced HIPC Initiative attempts to reduce a country’s indebtedness to ensure that the remainder of its debt is sustainable in relation to likely future growth – see Kraay and Nehru (2003). That judgment is based on a number of indicators, of which the principal are the flow ratio of debt service to either export revenues or GDP and the ratio of the debt stock, evaluated as the NPV of future flows, to GDP.
A number of HIPCs which have reached the HIPC “completion point”3 have found that, despite the agreed debt reductions, their debt levels remain unsustainable, either because of falls in the prices of their commodity exports or because of higher oil import prices. A 2002 IMF-World Bank review reportedly concluded that one of the two main causes of deterioration of debt indicators for HIPC countries in 2001 was “lower export earnings owing mainly to declining commodity prices”.4 Lower average exports accounted for over 50% of the deterioration of the HIPC debt service indicators and export prices declined by an average of 4.8% for HIPC countries which experienced a deterioration in debt indicators against only 1.1% for those which did not (IMF and IDA, 2002, pp.24-7).
3 The HIPC initiative envisages countries progressing from a “decision point” to a “completion point”. At the decision point, creditors commit on sufficient debt relief to leave the remaining debt sustainable, relative to the information available at that time. Movement from the decision point to the completion point, when the agreed debt reduction takes place, is conditional on the country establishing a track record by implementing poverty reduction and other policies to which they committed at the decision point.
Two commodities – coffee and cotton – stand out as responsible for a large part of the deterioration of HIPC debt sustainability. Coffee is the most important tropical export crop both in terms of value and in terms of the number of exporting countries. Coffee prices declined sharply from 1999 and in 2001-02 the (nominal U.S. dollar) International Coffee Organization (ICO) Indicator Price averaged only 40% of its average over 1996-98.5 In cotton, the (nominal U.S. dollar) Cotton A Index, normally taken as the representative price for the world market, averaged 63% of its 1996-98 value over 2001-02.6 Of the fifteen HIPCs listed in IMF and IDA (2002) as having experienced deterioration in debt service indicators, four (Guinea, Honduras, Nicaragua and Uganda) are heavily dependent on coffee exports and four (Benin, Burkina Faso, Chad, and Uganda) are heavily dependent on cotton exports. The deterioration of the debt sustainability indicators in Uganda, which is dependent on both coffee and cotton exports, was poignant since the Ugandan policy environment was generally regarded as particularly strong.
These developments have focused renewed attention on how international commodity policy might assist the poorest commodity-dependent countries, and in particular on whether either the HIPC Initiative or IDA lending procedures might be modified to ensure that future commodity price shocks do not imperil debt sustainability. While a number of initiatives are under consideration, we confine attention in this paper to detailed examination of a single 5 Source: ICO (http://www.ico.org/frameset/traset.htm ). The precise comparison is sensitive to the choice of years. However, the coffee price was even higher in 1994-95. The ICO Indicator price is based on an average of exchange prices which relate most directly to cif prices in consuming countries. Because the cif-fob margin is relatively insensitive to the level of the export price, the fob prices obtained by exporters declined by an even larger percentage. The coffee crisis is discussed in Oxfam (2002).
proposal. The specific proposal we consider is that repayments of concessional debt should be conditioned on the prices of the commodities that the country exports. The objective is to more closely match the debt service obligations facing indebted governments with their ability to meet these obligations, as measured by their export revenues. The hope is that, in periods in which low world prices result in a decline in export revenues, countries will face reduced debt service obligations. However, the schemes are structured to be broadly neutral from the creditor standpoint so that reduced payments in certain years are offset by increased payments at other times. The schemes may therefore be caricatured as Paretian adjustments to debt service schedules to circumvent a credit market constraint faced by HIPC governments.
The structure of the paper is as follows. In section 2, we outline the objectives and scope of the schemes we subsequently investigate, and discuss the relative advantages and disadvantages of basing interventions on export revenues on the one hand or the world prices which underlie these revenues on the other. In section 3, we show that price-based interventions may be structured as an overlay of floating for fixed commodity swaps or swaptions which allow indebted countries to offset export revenue movements through variations in their concessional debt service. The section also discusses hedging and offsetting issues. In section 4, we describe the simulation sample and methodology and propose a money-metric measure for evaluating the resulting welfare improvements in a consistent manner across countries. Using a sample of ten moderately or severely indebted African HIPCs, we find modest benefits from the proposed interventions. In section 5, we argue that basis risk and quantity variation are largely responsible for the limited extent of these benefits
and suggest that these factors qualify the applicability of all price-based commodity market interventions. Section 6 concludes.
2. Objectives, Instruments and Scope
The structure of any intervention scheme is determined by its objectives, the instrument(s) used to attain these objectives, and its scope.
2.1 Objectives
Concessional debt service typically shows relatively little cyclical variation over time. Export earnings are highly variable and, because commodity prices are at least to some extent mean reverting this variation is in part cyclical – see Cashin and McDermott (2002), Gilbert (2003) and Dehn et al. (2004). Because schemes to smooth export earnings have, in general, proved unattractive, unsuccessful or not financially viable,7 this involves unsmoothing concessional debt service. The debt sustainability literature has typically focused on the debt service to export ratio. This measure has the merit of direct comparability across countries – see, for example, World Bank and IMF (2001), and Edwards (2001, 2003). In what follows we consider a variant of this measure – the free foreign exchange resources that a country has available after meeting debt obligations (“free forex”). This gives a more immediate measure of the impact of debt service payments and has the additional benefit of treating commodity export and import revenues symmetrically. We define the objective as that of reducing the
7 There are two routes to smoothing export revenues – price stabilization and compensatory finance. International commodity agreements, which set out to stabilize prices, are reviewed in Gilbert (1987, 1996). These have all either lapsed, broken down or been abandoned, although Robbins (2003) has recently argued that these arrangements should be resurrected, initially for coffee but then more generally. Compensatory finance schemes are discussed below.
variability (specifically, the ex ante variance) of free forex.8 In practice, we will scale this relative to a (moving average) trend of commodity export earnings – see section 3.6.
2.2 Instruments
The fundamental issue here is whether to gauge countries’ ability to pay in relation to their export revenues or to the world prices of the commodities they export, noting that prices are clearly a major driving force of revenues. There are issues of hedge quality, timeliness, offsetting and implementability.
• Hedge quality: Linking repayments to export revenues will directly align debt service payments with debtor countries’ ability to pay. A price link will fail to insure borrowers against quantity shocks, and will give to “basis risk” if the country’s export price moves differently from the world price – see sections 5.2 and 5.3.
• Timeliness: Export revenues are only known with a one or two-year lag while prices are observed immediately. Schemes, such as the EU’s Stabex scheme, which have operated in terms of export revenues, have been slow to disburse and this lack of timeliness has resulted in disbursements becoming pro- and not counter-cyclical (Collier et al., 1999; Brun et al., 2001). See also Hewitt (1983, 1987, 1993) and Aiello (1999). Basing the scheme on prices would increase timeliness.
• Offsetting: We show below that a scheme based on world prices can be structured as an overlay of floating for fixed commodity swaps. This structure would allow creditor
8 We have posed these objectives in terms of variabilities, but it is arguable that what is important is avoidance of bad outcomes, whether in the form of high debt service to export ratios or low residual foreign exchange
institutions to offset their risk on financial markets if they so choose. Offsetting would be much less straightforward in a scheme operating in terms of export revenues.
• Implementability: Basing the scheme on export revenues could result in governments being rewarded for falls in the quantum of exports for which they may be directly or indirectly responsible (for example, in the case of a civil war). It may also give rise to incentives to manipulate reported trade statistics. Concerns about moral hazard revenue-based compensation schemes have typically forced lenders to impose conditionality clauses on borrowers, and these conditionalities have considerably reduced the attractiveness of the schemes to commodity exporting countries.9 A scheme based on world prices will not give rise to significant moral hazard problems so long as the country has only a small share of the world market (a reasonable assumption for HIPCs).
The choice between these two instrumentalities will depend on the balance between the perceived benefits of timeliness and offsetting from a price-based scheme, and the potential extent of moral hazard problems arising in a revenue-based scheme on the one hand, and the loss of hedge quality through quantity and basis risk on the other. Our focus is on schemes which condition debt service on world prices.
2.3 Scope
Historically, indebted countries have typically borrowed from a range of official and non-official lenders. Some non-official loans are completely concessional, others are non-concessional and the majority are part concessional and part non-concessional. This latter group can be
split into concessional and non-concessional components. So long as we focus on highly indebted countries, it is reasonable to suppose that, in the future, debt service will come to predominantly reflect concessional lending as non-official lending has ceased to be available to these countries – see Sachs (2002). For this reason, and because our concern is to devise a scheme which may be implemented in a simple and straightforward way, we consider only concessional lending.
3. Financial Structure
For specificity, consider a fresh loan of $A which matures in period T. Scheduled repayments are S1, S2, … ST. Consider the specific example of an IDA (International Development
Association) loan, where, typically T = 40 and
0 0 0.02 10 20 0.04 20 40 t t S A t A t < < = ≤ 10 < ≤ < (1)
We consider schemes which substitute a revised payment schedule R1, R2, … RT which have
the same value to the creditor but which are easier for the debtor to pay. The constant value constraint implies 1 1 H H t t t t t t R S = = φ = φ
∑
∑
(2)where φ≤1 is the discount factor and H≥40 is a sufficiently long horizon.10 The schemes we
consider therefore operate by advancing and postponing debt service payments.
9 It is widely judged that the IMF’s Compensatory Finance Facility (CFF) has been too subject to conditionalities to prove attractive to borrowers. See Finger and DeRosa (1980), Goreux (1980), Lim (1987, 1991) and IMF (2003b); and, for a comparison with Stabex, Brun et al. (2001).
3.1 Commodity Swaps
The basic structure we consider is that of a commodity swap – see Hull (1997, p.131). Floating-for-fixed interest rate swaps, sometimes known as “plain vanilla swaps”, are the most widely traded interest rate derivative instruments. Commodity swaps extend this principle from interest rates to commodity prices. The commodity swap proposal is an extension of the practice, which already exists for some multilateral lending, of structuring a loan in terms of a basket of currencies. The currency basket approach allows the borrower to match the currency composition of its debt service obligations to the currency exposure of its export revenues. This is formally equivalent to augmentation of the original loan with a set of currency swaps (typically euros or yen for dollars).
We consider commodity-exporting countries as possessing an asset (their primary commodity export revenues) which is exposed to one or more floating commodity prices. Their liability structure is currently fixed, in the sense that debt service is independent of the commodity prices. This suggests that they may benefit by swapping out this fixed rate exposure for a floating rate exposure which matches their floating commodity price exposure. In what follows, we confine attention to the most important exports and to oil imports. This is on the basis that many less important commodity exports lack clearly defined international prices, and also that a focus on a small number of major export and import commodities works towards a simple and easily understood structure. Inclusion of less important export and import commodities would have a relatively small effect on outcomes.
floating rate loan overlay relative to the structure defined by the repayment schedule (1)
would require payments of
0 t t P t R S P =
with the consequence that repayments would be
higher than on the corresponding fixed loan when P is high and lower when low. More
generally, suppose a fraction λ≥0 of the original loan is swapped into the floating loan. Repayments are
(
)
0(
)
0 0 1 1 1 t t t t t P P P t t R S S P P − = λ + − λ = + λ = + λ p S (3) where 0 0 t t P P p P −= . Equation (3) makes explicit the equivalence of the swap overlay and the price-dependent loan.
3.2 Commodity Swaptions
A swaption is an option on a swap. Commodity swaption structures are a variant of the commodity swap structure considered above. They are based on the principle that any scheme should aim to cope only with exceptional and not normal price movements, either because large shocks to prices have disproportionate effects (Collier and Gunning, 1996; Dehn, 2004) or simply to limit activity. A floating-for-fixed swaption may either be a call (the right to swap into floating from fixed) or a put (the right to swap into fixed from floating). We shall consider symmetric collar-type structures in which the borrowing country is long a set of out-of-the-money calls and short an equal number of out-out-of-the-money puts. Because both sets of
options are out-of-the-money, debt service payments will be unaffected for moderate variations in the commodity price.11
The swaption repayment scheme corresponding to the swap scheme in equation (3) may be expressed as
(
)
(
)
(
)
(
)
(
)
(
)
0 0 0 0 0 0 0 0 1 1 1 1 1 1 1 1 t t t t t t t t t P P S if P P P R S if P P P P S if P P P − + θ + λ + θ < = − θ − θ − − λ < − θ P ≤ ≤ + θ (4)The middle row of equation (4) shows that in the band in which the commodity price is within ±θ% of P0, debt service payments are unchanged from those under the standard currency loan.
If the price falls short of , debt service is reduced in relation to the proportion λ of this shortfall. Correspondingly, at prices above
(
1− θ)
P0(
1+ θ)
P0, debt service is increased in relationto the proportion λ of the excess. This may be expressed more succinctly as
11 Commodity swaption-based schemes are reminiscent of band stabilization schemes operated in the buffer stock commodity stabilization schemes operated in tin (until 1985) and natural rubber (until 1999) – see Gilbert (1987, 1996).
(
)
(
)
1 max ,0 min ,0 t t t t R = + λ p − θ + λ p + θ S (5)Equations (4) and (5) makes explicit that the original loan for $A has been modified by adding a short position of calls on $λA in the floating rate loan with strike price
(
and a long position of puts on $λA in the floating rate loan with strike price)
0 1+ θ P(
1− θ)
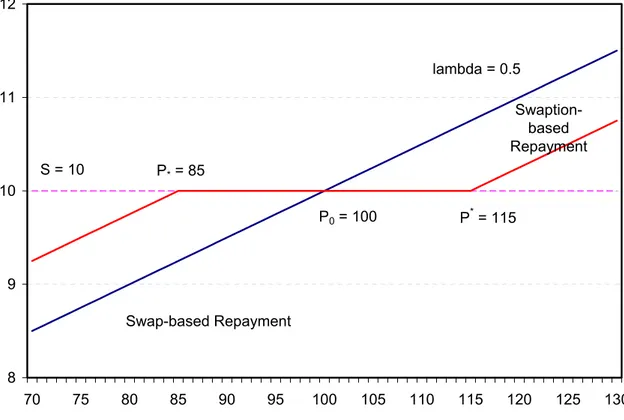
P0. These repaymentsare illustrated for a simple example (P0=100, P*=(1-θ)P0 =85, P*=(1+θ)P0 =115, λ=½) in
Figure 1, which also illustrates a simple swap-based scheme.
8 9 10 11 12 70 75 80 85 90 95 100 105 110 115 120 125 130 lambda = 0.5 S = 10 P* = 85 P*= 115 P0 = 100 Swap-based Repayment Swaption-based Repayment
Figure 1: Swap-based and Swaption-based Price Conditionality
3.3 Oil Imports
The structures outlined above may be extended to include imported commodities, in particular petroleum or grains. Countries importing these commodities may experience difficulties in meeting scheduled loan repayments in periods when imported commodity prices are high.
This extension is achievable by allowing borrowing countries to make commodity-based loans to the lenders, or to take collar positions in such loans. These loans again have swap-based or swaption-swap-based structure.
Write the oil import price as Qt with initial (loan inception date) price of Q0. Write
0 0 t t Q Q q Q −
= . Then the swap-based scheme which generalizes equation (3), is defined by
(
)
(
)
0 0 0 0 0 0 1 1 1 t t t t t t t t t P Q R S P Q P P Q Q S p q P Q = λ − µ + − λ + µ − − = + λ − µ = + λ − µ St (6)Effectively, the original fixed repayment loan as increased by the fraction µ%, which is then lent back to the lender in the form of an oil-based or grain-based loan. The borrowing country receives fixed payments on $µA value of this component of the loan, but makes oil- or grains-linked payments to the lender. The extension to the swaption-based scheme is straightforward
(
)
(
)
(
)
(
)
1 max ,0 min ,0 max ,0 min ,0
t t t t t t
R = + λ p − θ + λ p + θ − µ q − θ − µ q + θ S (7) where we have defined the bands symmetrically for import and export prices. The borrowing country is long the call and short the put on the export price but short the call and long the put on the import price.
3.4 The Commodity Price Trend
Commodity prices have exhibited a downward trend relative to the prices of manufactures, and more recently also in nominal terms, for at least a century and probably longer (Grilli
and Yang, 1988). However, the pace of this fall varies from commodity to commodity, and, even more markedly, from one decade to another (Gilbert, 2003). This negative trend is generally regarded as resulting from the effects of productivity-enhancing technical change in production and intermediation processes, which, in the case of manufactures, is partly reflected in higher product quality and specifications (Lipsey, 1994). It seems likely that most primary prices will continue to fall relative to manufactures prices, but there is no reliable means of knowing by how much and which commodities, if any, will be exceptions to this pattern. This variable trend poses problems for any attempt to link debt service payment to commodity prices.
The swap and swaption schemes considered above would give borrowing countries the benefit of repayments based on floating commodity prices for the entire lifetime, perhaps up to 40 years, of a concessional loan. It is clearly not possible to forecast likely levels of any commodity price over this type of horizon. This implies that extreme caution should be exercised in making commitments in relation to the absolute level of any price over a horizon of this length. If commodity prices continue to decline, floating for fixed swaps would give a very considerable benefit, but one achieved at the expense of the lending countries. But they would also impose upon them the risk that scarcity might eventually reverse the downward trend of the past century. These risks will probably not be countenanced, certainly by lenders, but possibly also not by borrowers. For these reasons, we modify the instrument structures so that, in technical terms, they have time-varying strike prices. The cost is that the arrangements we discuss can contribute relatively little to issues of debt sustainability over the longer term.
The initial price P0 in schemes considered above acts as the contract strike price. These are
fixed strike instruments. Generalization to a floating strike is straightforward, simply by replacing P0 and Q0 in equations (3-7) by time-subscripted prices and . This notation
reflects the commodity agreement and compensatory finance practice in which and Q are moving averages of past prices. We now have a 2x2 matrix of possibilities:
av t P av t Q av t P av t Contract type Swap Swaption
Fixed strike Floating for fixed
swaps
Floating for fixed swaptions
Strike type
Variable strike
Floating for moving average swaps
Floating for moving average swaptions
The upper row defines the schemes considered in equations (3-7) and Figure 1. In what follows, we confine attention to schemes defined by the lower row of the table.
3.5 Offsetting
A floating for fixed swap transfers the long exposure to the variable (floating) commodity price from the borrower to the creditor. It is open to the creditor to offset this exposure positions by taking short positions in commodity forwards, futures or options, as appropriate. However, where there are exchange futures in tropical commodities, these extend out up to two years ahead, although they are typically only liquid up to around 9-15 months out. To hedge a longer dated exposure, it is necessary to roll short-dated positions forward – see Hull (1997, pp.37-8). The cost is roll risk which derives from variability of the futures price structure. Roll risk accumulates with the number of times a hedge is rolled and can become large if short-dated futures are used to hedge a long-dated exposure. So although it is feasible
to use short-dated futures to hedge a long-dated exposure, this can be risky.12 An alternative strategy is to take a long-dated forward contract through a bank or broker, but since the latter organization will wish to offset its position, it will face the roll risk and will charge accordingly.
This problem is potentially very serious for fixed strike swaps since the creditor party would assume exposure to the floating commodity price for up to forty years. It would not be practicable to look to offset that exposure either on exchange commodity futures markets or through banks or the commodity trade. The move to floating strike swaps substantially reduces that problem through automatic offsetting. That is because the exposure assumed by the creditor becomes the difference of the price at each future date to the moving average trend at that date with the result that long exposure to the price at any date is offset by a corresponding short exposure through the moving average.13
3.6 Unconstrained Schemes
The repayments envisaged under the commodity swap and swaption schemes substitute a stream of repayments defined as 1
(
1, 1av, 1) (
, 2 2, 2av, 2)
,...,(
, av,)
T T T T
R P P S R P P S R P P S where we
have omitted the commodity import price(s) Q for simplicity of exposition. We may also
13 Consider the hedging decision at the start of year t, recalling that the price trend is defined by a four year moving average of the prices from years t-1 to t-4. The creditor has full long side exposure to the floating commodity price for year t, but for year t+1 his exposure if offset by a 25% short side exposure to the period t price through the effect of the moving average. Similarly, his long t+2 exposure is offset by a 25% short exposure to each of the period t and period t+1 prices. In the simple case that exposure is constant at $a up to year T, the net exposure would be $a to the period T price, $0.75a to the T-1 price, $0.5a to the T-2 price and 12 Roll risk was a major cause of the Metallgesellschaft hedging loss in 1993 – see Edwards and Canter (1995), Mello and Parsons (1995) and Pirrong (1997).
consider a modified structure in which the repayments are freed from their dependence on the initial scheduled payments S1, S2, … ST; i.e. the repayments become
(
) (
)
(
1 1, 1 , 2 2, 2 ,..., ,
av av av
T T T
)
R P P R P P R P P . We refer to this as an unconstrained scheme on the
basis that modified repayments are not directly related to the scheduled repayments on the original loan except through the requirement that debt obligations are eventually met i.e. subject only to equation (2). The scheduled loan repayments are reduced to the role of an accounting device to ensure full eventual repayment. The difference between this proposal and the swap-swaption proposal is important because service on concessional debt remains relatively small in proportion to export earnings. If debt service is to be used as the instrument for stabilizing export earnings, this will involve a significant leverage of the fluctuations in commodity export prices or earnings to generate a noticeable impact on foreign exchange availability in the indebted countries.
Repayments in the unconstrained scheme could in principle take on very large positive or negative values. We believe that concessional lenders will probably wish to put a zero floor on debt serviced in any particular year – i.e. the original loan repayments could be automatically rolled forward but the structure should not entail automaticity in new lending. We incorporate a zero floor in the simulation results we report in section 4.4. For reasons of symmetry, we also cap each repayment
(
, av)
t t t
R P P at twice the scheduled repayment St.14
14 The floor and cap complicate offsetting, but so long as the scheme is defined in terms of a moving average floating strike the net exposure will be small.
4. Simulations 4.1 Sample
We have performed historical simulations over the period 1984-2000 for schemes of the form outlined above using a set of ten severely and moderately indebted African countries: Benin, Burkina Faso, Burundi, Cameroon, Ghana, Kenya , Madagascar, Malawi, Rwanda and Tanzania. This group of countries was selected from the set of all countries classified by the World Bank as severely or moderately indebted and which in addition satisfied the following three criteria
• Service on concessional debt is a sufficiently large proportion of total debt service to allow the scheme to have a significant impact on overall debt service.
• The country has at least one export commodity making up 10% of total exports or one import commodity accounting for 10% of total imports.
• The country publishes statistics on total imports and exports, with at most a few gaps, which allow calculation of the required hedge ratios.
Application of these three criteria reduced an original candidate list of many more countries to the ten listed above.15
In section 3, we set out a range of alternative designs. We need to choose a more limited number of schemes for simulation. In what follows, we will report on two schemes:
15 Source for debt data: World Bank. Sources for export revenue and import expenditure data: aggregate exports and imports, IMF (International Financial Statistics); agricultural commodities: FAO. Gold export values and
A. A commodity swap scheme, as defined by equation (6), with price deviations measured relative to a four year moving average of past prices lagged one year (i.e. the moving average of prices four, three, two and one years previously).16
B. A swaption scheme, as defined by equation (7) and relating to the same moving average with a ±θ% band (strike prices θ% above and below the moving average price trend). We set θ = 15%.
We consider these schemes as implemented as constrained by concessional debt service and as unconstrained.
4.2 The Hedge Ratio
For simplicity, we focus on a country with a single major export, with export share α and price P, and for which oil imports have price Q and notional “share” γ in total exports.17 We
also focus on a straightforward commodity swap structure, as defined by equation (6), with nominal value $A.18 The scheme defined in equation (6) relies on the choice of hedge
parameters λ and µ for the export and import commodities respectively.
The most simple starting point for the analysis is the share-based hedge which sets the export commodity swap parameter λ equal to the export share α and the oil import swap parameter µ
16 Source for price data: World Bank.
17 In most HIPCs, total imports considerably exceed total exports with the difference covered by grants, remittances and capital inflows. Expressing oil imports as a share of exports rather than imports implies equivalence between an extra dollar spent on oil and a dollar lost from a lower value of commodity exports. It is straightforward to extend the hedge ratio discussion to cases in which there is more than a single export or import commodity.
equal to the “share” γ of oil imports in total exports. Hedging using the export and oil import shares effectively adopts a unit (dollar for dollar) hedge ratio. Basic hedging theory teaches that hedge ratios will normally differ from unity – see, for example, Hull (1997, pp.35-7). The variance minimizing hedge ratios will depend on the correlation between changes in the revenue stream to be hedged and changes in the price used to hedge this stream, and on the relative volatilities of the revenue stream and the hedge price. Furthermore, hedging using export shares considers the export and import side hedges independently. This is only valid if changes in the export and import commodity prices are mutually uncorrelated, if the changes in the export price are uncorrelated with changes in import expenditures and if changes in the import price are uncorrelated with changes in export revenues. These are strong requirements. Where these conditions do not hold, a portfolio approach is required which takes into account the covariance structure of the prices, export revenues and import expenditures.
Although it is possible to derive analytic formulas for the variance-minimizing hedge under these more general conditions, it is simpler to derive the hedge ratios empirically by multiple regression of the quantity whose variance one wishes to minimize on the relevant prices. Write the country’s commodity export revenues as X, its oil import expenditures as O and (as previously) its scheduled concessional debt service as S. Then X – O – S is residual forex availability. The optimal hedge ratios are found by regression of this quantity on the commodity export price P and the oil price Q.
18 We do not attempt to estimate variance minimizing hedge weights for the swaption scheme (7). The associated
Typically, for the countries we consider, export revenues and oil import expenditures have both trended up in nominal and real terms. This suggests scaling by the trend in export revenues so that effectively we are considering the debt service to export ratio, in line with the debt sustainability literature. The precise regression takes as dependent variable
t t t t t t t t t X X O O S S X X X − − − − % − % %
% % % where a tilde indicates a centred five year moving average. This
is regressed on the similarly defined export price deviation 4 4 t t t t P P p P − − − = %
% and the oil price
deviation 4 4 t t t t Q Q q Q − − − = %
% , where, however, the price moving averages are four year moving
averages defined over the period t-4 to t-1.19
Regression-based weights should generate a superior hedge to the share-based weights in the presence of correlations between commodity prices and oil prices and if these prices influence other expenditure and receipt items. The practical problem is whether it is possible to rely on these weights being constant over time. There will always be a worry that particular hedge ratios estimated over short samples of often poor quality data can generate hedges that may be less good than those obtained by use of simple export and import shares. The apparent superiority of the regression-based weights may therefore be illusory. We therefore report results based on both share and regression-weights. The former may be thought of as providing a lower bound and the latter an upper bound on attainable performance.
19 Backdating of the moving averages is required to ensure that the modified debt service is known at the start of each year. This precludes use of a moving average incorporating either current of future prices. Regressions were performed over the period 1985-2000 (1999 for Cameroon because of lack of data).
4.3 Welfare Analysis
The simulation design set out in the two preceding sections generates 23 = 8 separate simulations: the choices being a swap (A) or swaptions (B) scheme, constrained or unconstrained by the initial debt service obligations, and using share or regression weights. We need a criterion by which to judge the relative success of different schemes. We propose to ask what reduction in debt service would leave countries indifferent between the reduced but otherwise unmodified debt service payments and debt payments under the proposed schemes but without any overall reduction. This provides a common debt reduction metric in which alternative schemes can be evaluated both within and across countries.
We show in an appendix that, to a first order approximation, the percentage reduction δ in debt service which would leave the debtor country indifferent between the current and the proposed arrangements is given by
2 Π∆ δ =
ψ where ∆ is the reduction in the variance of free foreign exchange, as defined in section 2.1 but measured relative to the export trend, i.e.
t t t t t t t t t X X O O S S Var X X X − − − − − % % % % % % , S X
ψ = , the ratio of average debt service to average
commodity exports, and Π is the coefficient of partial risk aversion, defined in the same way as relative risk aversion but relative to commodity export revenues instead of income.
The proposed measure δ is a simple transformation of the variance reduction ∆ and the ranking of schemes for any given country is therefore the same whether one uses the variance reduction metric ∆ or the equivalent debt reduction metric δ. The advantage of the latter
measure is only that it gives an order of magnitude measure of what the variance reduction is worth, at least under simple and broadly standard assumptions. The disadvantage of this measure is that it necessarily depends on an assumed risk aversion coefficient. If countries are highly risk averse, they will be willing to pay a lot for even a small degree of risk reduction, while if they have low risk aversion they would prefer even a small reduction in overall debt service to a large reduction in uncertainty. In what follows, we use a conservative value of unity for the partial risk aversion coefficient. Use of a higher value for risk aversion, perhaps 2.5, would increase the valuation of the risk reduction benefit proportionately.
4.4 Simulation Results
Detailed simulation results are tabulated by country in appendix Tables A1 and A2. Table A1 reports the results of simulations of the swap-swaption scheme in which interventions are tied to scheduled debt service while Table A2 reports simulations of the unconstrained scheme in which interventions are related only to a moving average of (lagged) export revenues constrained only by the cap and floor - see section 3.6. For each country and both hedging schemes, results are provided for each of the swap-based scheme (scheme A) and the swaption scheme (scheme B) using a ±15% threshold.
The simulation results reported in Tables A1 and A2 differ markedly across countries but are fairly consistent across alternative schemes in any given country. These differences across countries motivate consideration of average benefits. Our preference is to focus on median benefits, interpretable as the benefit to the average country, rather than on the (typically higher) sample average which is heavily influenced by the Burundian and Rwandan
performance. Median benefits for the swap scheme (scheme A) are listed in Table 1.
Table 1
Median Summary Statistics for Simulation Exercises Swap and Swaption Schemes
Hedge ratio Share-based Regression-based
Objective Variance reduction Value Variance reduction Value Constrained relative to S 1.6% 0.4% $0.3m 1.5% 0.7% $0.4m A Swap Scheme Unconstrained 2.3% 1.0% $0.5m 2.3% 3.2% $1.0m Constrained relative to S 0.8% 0.2% $0.2m 0.3% 0.2% $0.1m B Swaption Scheme Unconstrained 2.1% 0.8% $0.7m 1.4% 1.1% $0.7m The table summarizes the median results for the Scheme A simulations reported in the final rows of Tables A1 and A2. Rows 1 and 3 of the table relate to Table A1 and rows 2 and 4 to Table A2. Values are given as percentages of scheduled debt service and as dollar values using a common assumed unit value for the partial risk aversion coefficient.
We focus initially on the constrained swap-swaption schemes (rows 1 and 3 of Table 1). The schemes generally do give some reduction in the target variances, but generally equivalent to a debt reduction of 3% or less. A higher assumed risk aversion coefficient could raise these valuations to the 2½%-10% range. As anticipated, use of regression-based weights rather than export and import share weights generates a more marked variance reduction than does use of share-based weights. The results show the swaps scheme (A) to be uniformly superior to the swaptions scheme (B) in terms of both variance reduction and the value of the associated welfare change. We acknowledge that these estimates depend on the choice of a particular bandwidth parameter θ, which we have taken as ±15%. Other choices may give different results. Finally, the unconstrained schemes (rows 2 and 4) give greater variance reduction and higher benefits than the schemes in which repayments are constrained relative to the
original repayment schedule. We shall see below that this is at some cost to the creditors.
Overall, however, the most important conclusion that follows from the results summarized in Table 1 is the small extent of the reductions in variability and hence the low size of the overall benefits derivable from the scheme.
Table 2
Summary Benefits by Country (% of Debt Service) Constrained Schemes Unconstrained Schemes Scheme A Scheme B Scheme A Scheme B
Benin - 0.2% - 0.1% - 2.6% - 1.7% Burkina Faso 2.6% 1.8% 3.6% 6.6% Burundi 3.6% 2.8% 4.7% 5.8% Cameroon 0.6% 0.1% 3.3% 1.0% Ghana 0.1% - 0.0% 0.8% - 0.1% Kenya 0.2% 0.2% 0.4% 0.9% Madagascar 1.0% 0.6% 3.0% 2.4% Malawi 0.7% 0.1% 5.2% 1.2% Rwanda 3.2% 0.8% 5.7% 3.8% Tanzania 0.4% 0.1% 1.4% 0.7%
The table summarizes the benefits, expressed as a percentage of scheduled debt service, of the simulation results reported in Tables A1 and A2, columns 7-9.
Table 2 summarizes the benefits of the best performing scheme for the ten countries in our sample using regression-based hedge parameters. Of the ten countries considered, Burkina Faso, Burundi and Rwanda are seen as obtaining greatest benefit from the proposed scheme.20 Malawi also obtains sizable benefits but only in the unconstrained scheme. Estimated benefits are negative or very low in Benin, Ghana and Kenya. In each country, the magnitude of the benefit (disbenefit in the case of Benin) is greater for the unconstrained schemes than for the constrained schemes.
20 Benefits are calculated over the ten year period 1991-2000. The simulation results for Rwanda exclude the civil war years 1994 and 1995. The results are much less favourable without this exclusion.
4.5 Simulated Impact on Creditor Institutions
The principal cost of the schemes we have considered is the unsmoothing of flows from borrowing countries to the concessionary lenders. Here, we focus on the impact on IDA, the most important of these lenders. The impact is charted in Figure 2 which looks at Scheme A (swap based) schemes using regression weights. The figure compares the total debt repayments to IDA from the ten countries in our simulation sample in both the constrained and unconstrained cases with actual historical repayments over the simulation period 1991-2001. 0 50 100 150 200 250 1991 1992 1993 1994 1995 1996 1997 1998 1999 2000 2001 $m Historical Constrained Scheme Unconstrained Scheme
Figure 2: Historical and simulated repayments of IDA concessionary debt, 1991-2001
There is a stark contrast between the impact of the constrained and unconstrained schemes. The constrained scheme permits only relatively small net departures of debt
repayments from their historical time path – the maximum divergence is $19m (in 2001). By contrast, the unconstrained scheme generates much larger divergences - $154m in 2000 and $189m in 2001. The consequence is that, in 2001-02, under this arrangement IDA would have received only one third of historical debt service payments. One reason for the large size of these figures is that there is relatively little offsetting – there is a large common factor in commodity price cycles. Net flows average 69% of gross flows in the constrained scheme and 65% in the unconstrained scheme.21
These results necessarily indicate a major question mark against the scheme using trend export revenues as the instrument. Table 1 suggests that the potential benefits from the unconstrained scheme are perhaps two to three times those from the constrained scheme. However, the disruption of IDA finances is many times larger than this. The choice therefore appears to be between a scheme which imposes a relatively small disruption on IDA finances but which generates a low expected level of benefits to participating countries, and an alternative which imposes much greater disruption on IDA for benefits which, although larger, remain low.
5. Discussion
Overall, the simulation results reported in sections 4.4 and 4.5 may be seen as positive, in the sense that feasible adjustments of concessional debt service in relation to commodity export
21 The main element of offsetting in our sample comes from Cameroon whose oil export revenues are negatively correlated with commodity export earnings and oil import expenditures in the other countries in our sample. We note that the poor quality of published oil import statistics makes it difficult to estimate appropriate hedge ratios for oil imports and may also result in underestimation of the beneficial effects of the schemes we investigate. Information is even less complete for the value of oil exports. Cameroon is the only country we consider which
and import prices can improve the situation of highly indebted commodity-exporting countries, but negative, in that the estimated size of this benefit is relatively small. They suggest that the extent of Paretian benefits is severely limited – i.e. there is relatively little scope for further improving the position of HIPC debtors without imposing costs on creditors. We have investigated three possible reasons for the mixed results. These are
• variability in concessional debt service over time;
• movements in the price basis (the difference between local and world prices); and • quantity variation.
5.1 Variability of Concessional Debt Service
Concessional debt service has tended to increase over time for the countries in our sample, in some cases relatively fast. This is particularly true of Ghana, Kenya, Malawi and Tanzania – see Figure 3 – and to a lesser extent of Madagascar. At the same time, debt relief under the HIPC programs has resulted in declines in debt service in participating countries. In Figure 3, this effect is most apparent for Malawi and Tanzania. The result is to introduce sharp variability into otherwise smooth debt service paths. This prompts the question of whether the schemes we are investigating might generate larger benefits if these sources of variability were removed.
Our judgment is that it is the second and third of these factors, and in particular the third, which are largely responsible for the relatively low value that we estimate indebted countries would put on the proposed scheme.
0 10 20 30 40 50 60 1984 1986 1988 1990 1992 1994 1996 1998 2000 $m Ghana Kenya Tanzania Malawi
Figure 3: Total Concessional Debt Service ($m), 1984-2001, Selected Countries
We examined this question by setting concessional debt service to its average value over the period 1984-2001 throughout the entire period. We looked in particular at the results reported in Table 2. The results of this exercise were mixed. For the constrained swap schemes (column 1 of Tables 2 and 3) four of the ten countries show an improvement, but for the other six this substitution led to deterioration in performance. For the constrained scheme (column 3 of Tables 2 and 3) the results are similar with four improvements and five deteriorations (Ghana shows no change). The conclusions we reached in section 4.4 are unaltered by this experiment.
Table 3
Summary Benefits by Country Assuming Constant Scheduled Debt Service (% of Debt Service)
Constrained Schemes Unconstrained Schemes Scheme A Scheme B Scheme A Scheme B
Benin - 1.1% - 1.0% - 2.3% - 2.7% Burkina Faso 8.6% 7.7% 8.6% 10.8% Burundi 5.4% 4.7% 6.2% 7.8% Cameroon 0.3% - 0.3% 2.3% 0.7% Ghana - 0.4% - 0.6% 0.8% - 0.5% Kenya 0.3% 0.2% 0.2% 0.8% Madagascar -5.4% -5.9% -1.8% -3.9% Malawi 1.2% 0.7% 5.5% 1.7% Rwanda 1.6% - 0.6% 4.1% 2.7% Tanzania - 0.3% - 0.6% 1.1% 0.1%
The table summarizes the benefits, expressed as a percentage of scheduled debt service, of the simulation results reported in Tables A1 and A2, columns 7-9 but with the 1984-2001 average scheduled debt service substituted for the historical levels.
5.2 Basis Risk
Basis risk is the risk that the price which one is using to hedge certain transactions does not move perfectly with the price that one is attempting to hedge – see Hull (1997, pp.32-4). Our concern in this context is that the prices countries obtain for their commodity exports may not be highly correlated with the international prices which we are using in order to construct the required commodity swaps. Table 4 reports these correlations.22 The table shows the long term hedging basis to be generally good for coffee and cocoa and poor for cotton and tobacco. The correlations for tea are mixed.
Coffee and cocoa are actively traded on international futures markets in London and New York. These prices are widely disseminated and serve the exporters who purchase in
developing country markets. However, exporters may also hedge with the explicit intention of reducing the correlation of export revenues and world prices. Hedging has been particularly important in cocoa. Cotton is traded in New York, but the New York price relates primarily to the protected US market. The Cotton Outlook (Liverpool A) price which we use as cotton benchmark is based on a survey of supposedly representative trades and is, in that sense, less transparent than a futures market price. It is also less widely disseminated. For tobacco, we are forced to use US import unit values as the world price. This is only modestly correlated with Malawian export unit values. Tea is more complicated. There is an active cash market in Mombassa, Kenya, and this price is well correlated with Kenyan unit values. The correlation with Tanzanian unit values is less good, and that with Rwandan unit values is actually negative. We conclude that basis risk is high for some country-commodity combinations but acceptable for others.
Table 4
Correlation of Commodity Export Unit Values with World Prices
Country Commodity Correlation Commodity Correlation
Benin Cotton 0.55
Burkina Faso Cotton 0.61
Burundi Coffee 0.87
Cameroon Coffee 0.93 Cocoa 0.91
Ghana Cocoa 0.92
Kenya Coffee 0.85 Tea 0.92
Madagascar Coffee 0.97
Malawi Tobacco 0.55
Rwanda Coffee 0.73 Tea -0.26
Tanzania Coffee 0.84 Cotton 0.60
Tea 0.69
The table gives the correlation of deviations of commodity export unit values from centred five year moving averages and the correspondingly defined deviations of the world prices from their backward-looking four year moving averages. Sample: 1985-2001.
22 The table excludes gold and oil since for these two commodities we construct export and import values by multiplying quantities by world prices.
5.3 Quantity Variation
Price-based schemes insure countries against movements in prices but not against quantity variations. Table 5 compares the extent of price and quantity variations for the major commodity exports of the ten countries in our sample.23 The table also gives comparable figures for petroleum imports for the three countries for which these data are available.
Table 5
Relative Importance of Price and Quantity Variability
Country Commodity Price Quantity Commodity Price Quantity
Benin Cotton 14.6% 22.1%
Burkina Faso Cotton 14.6% 24.9%
Burundi Coffee 20.2% 25.1%
Cameroon Coffee 21.7% 18.3% Cocoa 11.6% 15.1%
Petroleum 17.9% 24.1%
Ghana Cocoa 11.6% 17.1% Gold 7.2% 7.4%
Kenya Coffee 20.2% 19.0% Petroleum 17.9% 20.9%
Tea 15.2% 10.0%
Madagascar Coffee 21.7% 21.2% Petroleum 17.9% 21.6%
Malawi Tobacco 7.7% 11.7%
Rwanda Coffee 20.2% 32.3% Tea 15.2% 26.8%
Tanzania Coffee 20.2% 16.5% Cotton 14.6% 22.7%
Tea 15.2% 6.2% Petroleum 17.9% 19.7%
The table gives the standard deviations of the deviations of world prices and the volume of exports or imports, in each case measured relative to a centred five year moving average. Figures for petroleum imports appear in italics. Missing or unreliable data prevent calculation of the variability of the implied quantum of oil imports for all sampled countries except Kenya, Madagascar and Tanzania. Sample: 1985-2001.
Considering only the export statistics, price variability averages 15.9% whereas quantity variability averages 18.9%, and in 11 of the 17 tabulated country-commodity pairs, quantity variability exceeds price variability. Furthermore, this is also true in the three cases where we have reliable oil import data. Overall, quantity and price variability appear to be of comparable magnitude, with the prevalent tendency being for quantity variability to exceed
price variability. This finding echoes Lim (1991) who found that “volume instability is more pronounced than price instability at the country level”. According to Lim, the major cause of quantity uncertainty was country-specific supply factors such as weather conditions, strikes (for mineral commodities) and socio-political factors. Civil war has become a further significant source of quantity variability over the past decade.
Of course, price and quantity movements will not be independent, and some of the quantity variation may be the consequence of price variations. We may analyze the extent to which this limitation is important by means of a simple decomposition. Using a different notation from the remainder of this paper, write the export revenue from a commodity as R, its price as
P and the quantity exported as Q. We use lower case letters to denote the demeaned logarithms of the corresponding upper case variables. It follows that
(
) (
)
ln ln ln ln ln ln
r = R− R= P− P + Q− Q = + q (8) p
Denote 2
( )
for any variable x and the covariancex Var x
σ = σ =xy Cov x y
( )
,q p u
for any pair of variables x and y. Finally, write the quantity-price regression as = β + . Since p and u are uncorrelated by construction, it follows that
23 Sources for volume data: agricultural commodities: FAO; gold: World Bureau of Metal Statistics; petroleum: International Energy Association.
(
)
2 2 2 2 2 2 2 1 1 pq r p u p p σ σ = + β σ + σ = + σ + σ σ 2 u (9)The ratio 2 2 2 2 2 2 1 1 pq p p u r r σ + σ σ σ = −
σ σ measures the extent of revenue variation that cannot be
explained by contemporaneous price deviations and must therefore be attributed either to movements in the price basis or to uncorrelated quantity movements. Table 6 gives this ratio for the commodity exports we have considered in the simulation exercises. In general, prices explain less than 50% (and in some cases substantially less than 50%) of revenue movements.
In summary, both basis and quantity risk appear to be significant problems for price-based schemes of the form we consider in this paper. Movements in world prices typically account for less than half the variation in commodity export revenues for indebted countries. The implication is that non-discretionary hedges based on world prices will not offer very adequate insurance against revenue fluctuations at the aggregate level.24 This conclusion is not new but previous research, particularly that by Goreux (1980) and Lim (1991), which reached the same conclusion, has not received adequate attention.
24 In Gilbert and Tabova (2003), we looked in detail at three of the ten countries for which we have conducted simulations: Burundi (the country for which the scheme performs best), Ghana (an intermediate example) and Benin (the country for which the scheme performs least well). Each of the three countries we have considered tells a different story. The common element is that movements in international commodity prices are not, in general, the major factor responsible for movements in reported export revenues and import expenditures, even in countries which are highly dependent on these commodities. In Burundi, where coffee prices do account for a significant proportion of the variation of coffee revenues, there were two major falls in revenue over the nineteen nineties which were not due to price movements. In Ghana, movements in commodity export revenues relate more to structural factors as to price movements. In Benin, data quality issues are sufficiently acute as to lead to the worry that the results may be dominated by measurement errors, preventing any clear substantive conclusion
Table 6
Estimated Importance of Quantity and Basis Variation
Country Commodity Correlation Commodity Correlation
Benin Cotton 80%
Burkina Faso Cotton 67%
Burundi Coffee 40%
Cameroon Coffee 44% Cocoa 39%
Petroleum 97%
Ghana Cocoa 78% Gold 55%
Kenya Coffee 64% Tea 55%
Madagascar Coffee 34%
Malawi Tobacco 59%
Rwanda Coffee 84% Tea 76%
Tanzania Coffee 51% Cotton 88%
Tea 21%
The table gives the proportion of the variance of deviations of log commodity revenues from centred five year moving averages which cannot be explained by
deviations in international prices from centred five year moving averages – see equation (9). We interpret this measure as stating the importance of quantity and basis variations. Sample: 1985-2001.
None of this implies that price effects are unimportant. Rather, the arguments underline that these are not the only important factor. But these factors do explain why schemes, such as those we consider, which rely only on prices, may be less effective than one might have hoped.
6. Conclusions
We have asked the question of whether it is possible to increase the flexibility of heavily indebted primary producing countries in meeting their concessional debt service obligations. The answer to this question is that this can in principle be done by augmenting existing concessional debt agreements by a set of floating-for-fixed commodity swaps or swaptions. These should take the form of “variable strike” instruments in which the “floating” price is an estimate of the underlying trend price, probably implemented through a moving
average of past prices. Modifications of this sort certainly appear feasible.
However, feasibility does not imply effectiveness. Countries may already have methods for coping with commodity price variability, even at the macroeconomic level, and these may be undermined by hedging arrangements. Of even greater importance, different countries are subject to a large number of shocks (for example, demand shocks, exchange rate changes and political disturbances), and the effects of these shocks may dominate those of commodity price shocks. The issue of whether a particular country would have benefited from a scheme of this sort, for example over the past decade, is therefore primarily empirical. We have investigated this for ten commodity dependent severely or moderately indebted African countries.
The scale of the benefits varies from country to country. Using a fairly conservative money metric, the proposed instrument turns out to be worth the same as a cut in debt service payments of between zero and 5%. The median value across our sample is between ½% and 2¼% depending on scheme design. Use of a less conservative risk aversion parameter could raise these estimates by a factor of two or, conceivably, three. However, those schemes which are seen as generating the highest (1%-5%) benefits divorce payments to creditors almost entirely from existing contractual debt service commitments except in so far as these serve as an accounting device to ensure eventual repayment. The additional benefits to the HIPCs in these unconstrained schemes turn out to be at the expense of a disproportionately large disruption of debt service payments to the concessionary lenders, and in particular to IDA. One is therefore confronted by a choice between schemes which impose relatively low
costs on the lenders but generate correspondingly low benefits to the borrowers, and alternatives which generate higher, albeit still modest, benefits, but at the expense of very considerable and potentially costly disruption of flows to lenders.
We have looked in some detail at the reasons for the relatively weak performance of these price-based schemes. The main reason appears to be that movements in international prices are only one of several factors that generate movements in countries’ reported commodity earnings. In general, world prices account for less than half of total revenue movements. Quantity variations and variations in local prices relative to those in world markets also play an important role. In particular, quantity variation is typically at least of the same order of importance as price variation in accounting for variations in countries’ commodity export revenues. Schemes, such as those we consider, which are based on world prices, cannot offer protection against these other factors.
The summary answer to the question we have posed is therefore that it is possible to modify the terms of concessional debt service so that it more closely matches countries’ abilities to make these payments, but this will only be of value to a subset of indebted countries. Schemes based on these principles cannot be a universal panacea and, if they are introduced, this should be on a discretionary, country-by-country, basis. But even where such a scheme would be useful, its value would be relatively modest – we estimate as equivalent to a reduction of less than 10% in concessional debt service payments.
commodity-exporting developing countries by operating purely in terms of world prices. At least at the level of the nation state, the extent of quantity variability is simply too large for such policies to substantially reduce or offset the variability of export revenues (or import expenditures). To be successful, a scheme must operate directly in terms of revenues. Compensatory finance schemes meet this requirement, but they are problematic in terms of timeliness and implementability. Nevertheless, it may be right that this approach should be re-evaluated. There is some evidence that large adverse terms of trade shocks have a disproportionate negative impact on growth,25 and if this conclusion can be sustained, it could justify a new “shock” window. One possibility might be to open such a window in the pending IDA 14 replenishment.
An alternative possibility, closer to the principles espoused in the approach we have analyzed here, would be to allow HIPCs to redenominate part or all of their concessional debt on an indexed basis in terms of their own local currencies – see Hausmann and Rigobon (2003). Because any decline in export earnings would tend to lead to real depreciation of the local currencies (see Cashin et al., 2004), this could provide a degree of automatic protection.
However, as with compensatory finance schemes, this gives rise to serious potential moral hazard and adverse selection problems.
There is a growing consensus that commodity-dependent developing countries have received relatively small dividends from the growth in the world economy over the past fifteen years, even though it is not clear whether their poor performance resulted from commodity