QUADERNI DEL DIPARTIMENTO DI ECONOMIA POLITICA E STATISTICA
Martina Cioni Giovanni Federico Michelangelo Vasta
Three tribes: the uneasy relations between economics and economic history
Three tribes: the uneasy relations between economics
and economic history
Martina Cioni
(Department of Economics and Statistics, University of Siena) Giovanni Federico
(Division of Social Sciences, NYUAD and CEPR) Michelangelo Vasta
(Department of Economics and Statistics, University of Siena)
ABSTRACT: We argue that economic history still remains a distinct field in economics. We rely on a new database of almost 3,300 economic history articles published from 2001 to 2018 in top economic history journals and in ten leading economics journals. The share of economic history articles in economics journals has increased very little, cross-citations are limited and only few authors publish in both economics and economic history journals. As expected, publishing in top five economic journals yields many more citations than in top field journals, but this is not necessarily true for other prestigious economic journals.
ACKNOWLEDGEMENT: We are grateful to Mattia Bertazzini, Samuel Bowles, Gabriele Cappelli, Federico Crudu, Alberto Dalmazzo, Eugenio Petrovich, Tiziano Razzolini and Marco Savioli for helpful comments and
suggestions. A special thanks is due to Ran Abramitzky and Stefano DellaVigna for sharing his data with us. We would like also to thank Alberto Montesi and Sara Pecchioli for research assistance. This paper has benefited from the comments of all participants at the Riccardo Faini CEIS seminars held in Rome (Tor Vergata, 2019), at the Galatina Summer Meeting (Galatina, 2019) and at the European Historical Economics Society Conference (Paris, 2019). The usual disclaimer applies.
JEL classification: A12, N01
Keywords: bibliometric analysis, citations, economic history, economics journals
2
Three tribes: the uneasy relations between economics and
economic history
1. Introduction
In a recent article in one of the top scientific journals (Science), Nunn (2020) has called for a far-reaching change in the nature of economic history. The discipline was born, in the last decade of the 19th century, as a frontier field between economics and history, dealing with economic issues with the research tools of the historian. The so called Cliometrics Revolution of the 1960s marked a first
breakthrough, featuring a widespread adoption of the analytical tools and the rhetoric of economics (Andreano 1970, Lyons, Cain and Williamson 2007, Greasley and Oxley 2010). In the following half a century, economic history, at least in the Anglo-Saxon countries, has been a subfield in economics, with alternating fortunes, but still focusing on “traditional” historical topics. Nunn (2020: 1441) claims it is no longer the case: ‘in recent decades, there has been a rapidly growing body of research within economics that takes a historical perspective when attempting to understand contemporary issues related to global poverty and comparative development’. In the felicitous expression by
Michalopoulos and Papaioannou (2017), history casts its long shadows over the present. This new line of research developed from the seminal and highly successful article on the colonial roots of
underdevelopment by Acemoglu, Johnson and Robinson (2001), which measured the impact of past colonial institutions on GDP per capita in 1995.1 Since then, this approach, relabelled “persistence studies”, has attracted a lot of attention among economists, as shown by the proliferation of survey articles (Nunn 2009, Spolaore and Wacziarg 2013, Ashraf and Galor 2018, Michalopoulos and Papaioannou 2020, Voth 2021). The rise of this new approach has not gone unchallenged: Austin (2008) has strongly criticized the “compression of history” and Kelly (2019) has suggested that results are spuriously improved by (not controlled for) spatial autocorrelation. Voth (2021) points out that only a minority of studies (‘apples-with-apples’) focuses on the persistence of a specific feature (e.g. a cultural belief). Most works (‘apples-with-oranges’) relate past events and current outcomes which
1 Cf. Section 6 for the impact of this article. According to Linnemer and Visser (2017: Table 3), it is the 8th most cited article from the top five economics journals in the period 1991-2015 and the only one in the top ten that was published in the 21st century.
3
are inherently different, often relying only on statistical inference, rather than on some theory about the causal mechanism.
Both practitioners and critics of persistence studies has so far focused on the movement per se. In contrast, our research frames it in the broader evolution of economic history since 2001, the year of the seminal paper by Acemoglu, Johnson and Robinson. In a companion paper (Cioni, Federico and Vasta 2021), we outline the main features of the movement and compare its evolution with the success of the Cliometric Revolution of the 1960s. In this paper we measure its overall impact on the field, with a new database of more than 3,000 articles on economic history issues published, from 2001 to 2019, in 17 journals, the top four economic history journals, and 13 leading economics journals.
The rest of the paper is organized as follows. We describe our database in Section 2, and we outline the main trends in the publication of economic history articles in economics journals in Section 3. Some economic historians have hailed these developments as an “integration of economic history into economics” (Abramitzky 2015, Diebolt and Haupert 2018, Margo 2018). Our view is somewhat more pessimistic: only few economics journals publish regularly articles on historical issues and the share may seem on the rise only if compared to the 1980s and early 1990s. Arguably,
economic history has not yet returned to the status that it had enjoyed before the mathematization of economics (Debreu 1991). In Section 4, we argue that economic history is deeply divided. Not only “persistence studies” are qualitatively different from “traditional” articles in economic history, but there are substantial differences between economics and economic history journals in the type of articles, affiliations of authors and pattern of citations. Indeed, authors seems to belong to different “tribes”. In the two next Sections, we measure their success, as proxied the number of citations they have received. Section 5 shows that articles in the top five economics journals are more successful than articles in top economic history journals. The gap with other economic journals is smaller, and disappears if one considers only the most successful articles in economic history journals. On average, “persistence studies” get more citations than “traditional” economic history articles in economics journals, but, as we show in Section 6, this result mainly depends on their (still) small number and on the exceptional impact of three articles. Section 7 concludes with some reflections on the future of economic history and on its relation with economics.
4
2. Data
Our “core” database includes all articles published in the top four economic history journals (henceforth the T-ec.hist), in the top five economics journals (henceforth T5) and in three other major generalist economic journals (henceforth T3gen) from 2001 to 2018. As universally agreed (Heckman and Moktan 2020) the T5 are the American Economic Review (AER), Econometrica (ECMA), the Journal of Political Economy (JPE), the Quarterly Journal of Economics (QJE), and the Review of Economic Studies (RESTUD) 2. The T-ec.hist have been defined in Cioni, Federico and Vasta (2018): for this paper, we drop Cliometrica because it started publications in 2007 and we keep the Economic History Review (EHR), the Journal of Economic History (JEH), Explorations in Economic History (EEH), and the
European Review of Economic History (EREH). We have selected the T3gen – Economic Journal (EJ), the Journal of Economic Literature (JEL), and the Review of Economics and Statistics (RESTAT) – according to three criteria: i) they must be, as the AER defines itself, ‘general-interest economics journal’ – i.e. they accept articles on all issues in economics rather than on a specific set of topics;3 ii) they started publications before 2001; iii) they are highly ranked – i.e. they are classified on average above the 15th position in a set of ten recent rankings of economics journals, based on Bornmann, Butz and Wohlrabe (2018) (see Appendix: Table A1).4 These criteria exclude some highly reputed general-interest journals such as the American Economic Journal (established in 2009) and the Journal of European Economic Association (established in 2003) and all field journals, however high they are in rankings (for instance Journal of Finance and Journal of Econometrics).5 For the robustness checks only, we have included five additional highly-reputed economics journals: the Journal of Economic Theory (JET), the Journal of Monetary Economics (JME), the Journal of Public Economics (JPUB), the Journal of Development Economics (JDE), and the Journal of Economic Growth (JEG). The first three
2 For an analysis of recent trends in the top five economics journals, see Wei (2019).
3 For instance, the EJ, as claimed in its website, provides ‘a platform for high-quality, imaginative economic research, earning a worldwide reputation for excellence as a general interest journal, publishing papers in all fields of economics for a broad international readership’.
4 We have selected the seven most recent rankings quoted by Bornmann, Butz and Wohlrabe (2018) and we add the rankings by Heckman and Moktan (2020) and the ‘Aggregate ranking all years’ from REPEC (accessed September 2020). The average ranking is 8.4th for the JEL (with positions ranging from 1st to 29th), 9.6th for RESTAT (from 7th to 12th) and 14.8th for EJ (from 7th to 22nd).
5 We exclude the Journal of Economic Perspective but not the JEL because they target a different readership, as stated in
the AER website. The former ‘attempts to fill a gap between the general interest press and most other academic economics journals’, while the latter ‘is designed to help economists keep abreast of and synthesize the vast flow of literature’. Moreover, the Journal of Economic Perspective, unlike the JEL, is upon invitation only.
5
are the highest ranked field journals in the classification by Kalaitzidakis, Mamuneas and Stengos (2011: Table 1), while the JDE and JEG (defined in the following as “history-friendly”) show the most interest in economic history issues among the leading economics journals.6
We have selected the articles on economic history issues in economics journals by looking at their abstracts and/or content and, when available, at the JEL codes (N category—Economic History) of the American Economic Association (AEA).7 Our initial selection has been comprehensive as possible, including all articles that explore any type of relation between events, institutions and behaviours (and their changes) in the past and their economic outcomes in either the past or the present. However following a standard practice in the literature (Abramitzky 2015, Hamermesh 2018, Heckman and Moktan 2020), we dropped from the sample the non-research articles (short notes, comments, replays, rejoinders, rebuttals, and essays in bibliography) in the T-ec.hist and the whole of AER’s annual issue of Papers and Proceedings.8 These articles are usually very short and have few references and thus would bias the citation analysis.
We have further classified articles as H (“traditional” economic history) or PS (persistence studies) according to the dependent variable of their main regression. We classified as PS all articles that deal with present outcomes and explain them as the consequences of specific past events, from prehistory to at least a century before the outcome. An archetypal PS is the article by Acemoglu, Johnson and Robinson (2001), we will give additional examples in Section 6. In contrast, a
representative H article is the work by Squicciarini and Voigtländer (2015), which estimates the
contribution to economic growth, proxied by city growth, of upper tail human capital (as measured by subscriptions to the Encyclopédie in the late 19th century) via the diffusion of modern technologies in 19th century France. This classification leaves out a substantial number of articles which use some historical data to test theoretical models (a typical example being the validation exercises of the DSGE model) or long historical series (at least 25 years) to discover regularities in long-term economic changes (e.g., the so-called growth regression) and to estimate economic parameters (e.g., the
6 These two journals publish many economic history articles (see Figure 3) and were at the top of the rankings for economics journals in terms of number of citations made and received by economic history journals in 2017, according to
Journal Citation Reports (JCR) after AER, JEL, QJE and JPE.
7 We do not rely exclusively on JEL codes (N – Economic history) because they are missing in some journals and the classification is not always consistent. Indeed, the code for economic history might miss some articles and include papers that are not primarily in economic history (Abramitkzy 2015: 1242).
8 The special status of the Papers and Proceedings is further shown by the decision of the AEA to split them as a standalone journal since 2018.
6
elasticity of money demand). We label these two categories respectively “Model testing” and “Empirical testing”.
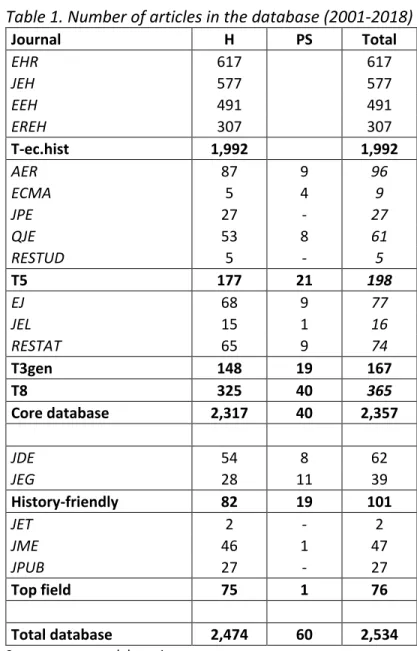
Summing up, the whole database includes a total of 3,125 articles, but in the main analysis we focus on 2,357 of them, the 1,992 articles in the T-ec.hist and on the 365 “core” economic history articles (i.e., H and PS) in the T8 economics journals (the T5 plus the T3gen). We use the other 768 articles ̶ 177 in the other five journals (Table 1) and 591 “Model testing” and “Empirical testing” published in all economics journals considered (Table A2 in the Appendix) for robustness checks.
Table 1 about here
As a second step, we have classified all articles in the database according to their topic,
historical period, geographical area and econometric techniques by looking at the title, abstract and, whenever necessary, text.
i) Elsewhere (Cioni, Federico and Vasta 2018), we have suggested a classification into 17 topics (see Appendix: Table A3), which, for estimation purposes, we further aggregate into 5 main
categories: “methodology” (inclusive of articles on the history of economic thought), “institutions”, “macro approach” (dealing with growth, economic policies, and trade), “micro approach” (finance, firms and innovation) and “personal conditions and behaviour” (inequality, human capital, population and demography).
ii) We follow the standard division between “classical and medieval history” (before 1492) and “early modern history” (1492-1815), but, given the large number of articles, we split the articles on “modern history” (1815-present) into the “long 19th century” (1815-1914) and the “20th century” (1915-present).9 We label as “long-run” articles covering at least two hundred years and straddling at least two periods, and as “no period” articles on methodology and on the history of economic
thought.
iii) We distinguish articles by geographical area of interest between single-country (United Kingdom, United States, and so on) and cross-country, with a residual “no area” category for articles on methodology and the history of economic thought.
9 We allocate articles dealing with two or more periods but covering less than 200 years, to the period which covers the higher number of years.
7
iv) We classify the econometric techniques as “basic” (coefficient of correlation, OLS regressions and so on) or “advanced” (differences-in-differences, instrumental variables, panel regressions, propensity score matching, vector-autoregression or VAR, and vector error correction model or VECM).
For each article, we retrieved information on the author(s), including name, gender and institutional affiliation at the time of publication as stated in the article, as well as on the number of citations received as reported in the Scopus database between 13 and 18 May 2019. We preferred Scopus to JCR because it offers wider coverage of journals and a simpler method for retrieving data.10 The T-ec.hist had received 28,469 citations, while the “core” economic history articles in the T8 had amassed 33,762 citations (24,596 for the T5 and 9,166 for the T3gen). Finally, we retrieved all the references contained in the bibliography of each article of the “core” database (the T-ec.hist and the T8), for a total of 138,150 references—that is, 60.3 references per article.
3. Economic history articles in economics journals: a first look at the data
As a starting point, Figure 1 plots the share of economic history articles in the three most established economics journals, the AER (established in 1911), the JPE (1892) and the QJE (1886). The averages for 1925-1944 and 1945-1974 are taken from McCloskey (1976), while the data for 1975 to 2000 have been collected by Abramitzky (2015).11
Figure 1 about here
Overall, the data downplay the extent of the recent integration of economic history into
economics. To be sure, the share of economic history articles is significantly higher after 2001 than in the last quarter of the 20th century (5.2% versus 3.4%), and the increase is even larger for all of the T5 (from 2.1% in 1975-2000 to 3.6% in 2001-2018).12 On the other hand, the last quarter of the 20th century was a difficult age for economic history in economics journals. The share of economic articles
10 Anauati, Galiani and Galvez (2016) in a paper on the life cycle of articles in the top five economics journals use Google
Scholar rather than Scopus as source, but the number of citations are strongly correlated.
11 McCloskey (1976) does not consider ECMA and RESTUD, which started publication in 1933. We limit our long-term comparison to these three journals, without anyway losing any relevant information, as they have published many more articles in economic history than the two other T5 have. We thank Ran Abramitzky for sharing his full database with us. 12 This trend is confirmed by the analysis of Card and DellaVigna (2013: Table A5) based on the JEL codes in the Econlit database.
8
in these three journals was much higher before 1945 (6.7%), and it was still marginally higher in 1945-1974 (3.8%) than in 1975-2000.13 The Abramitzky database features only 96 economic history articles in the T5 from 1975 to 1989 (1.9% of the total), and 25 of them (i.e., one quarter) were published only in two years, 1984 and 1986. In some years of the 1970s and 1980s, the T5 published five or fewer economic history articles per year out of an average of 350 total articles. The situation improved in the 1990s, with a total of 66 economic history articles in the T5, corresponding to 2.5% of all articles. Most of the rise in the share is concentrated in a fairly short period of time from the early 1990s to its peak in the mid-2000s.
This view is confirmed by looking at all journals in our database since 2001 (Figure 2).
Figure 2 about here
Two points stand out. First, there are long-term differences between the groups of articles – the average share being 5.8% for the “history-friendly”, 5.0% for the T3gen, 3.6% for the T5 and only 1.4% for the field journals. Second, in contrast to the alleged integration of economic history into
economics, the share of economic history articles in the T8 has fluctuated quite widely at approximately 4%, without any clear upward trend. It has risen impressively only in the “history-friendly” journals, from 0.8% in 2001-2004 to 12.0% in 2015-2018.
Figure 3 adds two important pieces of information.
Figure 3 about here
First, there are substantial differences among the T8. The QJE stands out: its share of economic history articles is the highest of all journals, but the JEG, which is clearly an exception in the field.14 The second highest-ranked journal among the T8 is RESTAT, as one would surmise that history should offer much evidence for empirical exercises. On the other side of the distribution, two journals (ECMA and RESTUD), published less than one economic history article for every one hundred articles.
13 In line with our estimates, the data by Angrist et al (2020: Table 2) show that economic history articles account for 2.9% of all articles published from 1970 to 2015 in a database of about 140,000 articles published in 50 leading economics journals.
14 The JEG has published 39 economic history articles out of 225 (17.3%), while the other “history-friendly” journal, the
9
Second, until 2018, PS (the red parts of the bars in the Figure 3) were a niche approach in the T8, accounting for about one-ninth of all “core” articles (i.e., for 0.5% of the total) and exceeding 1% of the total only in the QJE. About four-fifths of all PS in our database were published after 2010, and yet, in those years, they accounted for approximately one-seventh of all history articles and 0.7% of all articles in the T8. The diffusion of PS studies appears much faster in the two “history-friendly” journals: the number jumped from two articles (one in each journal) in 2001-2009 to eight and ten articles, respectively, in 2010-2018. This rise helps to explain the difference between the T3gen and the “history-friendly” journals in Figure 2. As with any radically new approach, PS probably require time to develop, and indeed, the field is still growing quite quickly. The recent survey by
Michalopoulous and Papaioannu (2020) quotes several working papers and unpublished articles which adopt this new approach.
4. Economic history: a deeply divided field
We explore the divide within economic history by looking at the differences between articles in the T-ec.hist and in T8 along three dimensions. First, we measure differences in four key features of the articles (topic, period, geographical area of interest and use of econometric techniques), further distinguishing between the T5 and the T3gen. Then, we measure the relationship between economic historians and economists looking at their publications’ outlet and affiliations. Finally, we explore the pattern of cross-citations — i.e., the number of citations to the T-ec.hist in the T8 and vice-versa.
4.1 The differences between articles in economics and economic history journals are substantial in all four features we take into account: topic (see Table A4a in the Appendix), historical period of interest (see Table A4b in the Appendix), geographical area (see Table A4c in the Appendix) and use of econometrics (see Table A4d in the Appendix). Just for an example, let’s consider topics. The category “institutions” accounts for most articles in both economics and economic history journals, but its share is about a half higher in the former than in the latter (20.0% vs 13.8%). Institutions is a very diversified category, which in economics journals include many articles on political issues, such as the roots of electoral success of the Nazi party (Adena et al 2015, Satyanath, Voigtländer and Voth 2017). However, differences are wide also in more narrowly defined categories: in the T8, 10.4% of articles deals with population and demography issues, and 6.6% on standard of living, while the proportions
10
are almost reversed in T-ec.hist journals (respectively 5.0% and 11.6%).15 On the other hand, the differences are less clear cut for other topics, such as labour or innovation.
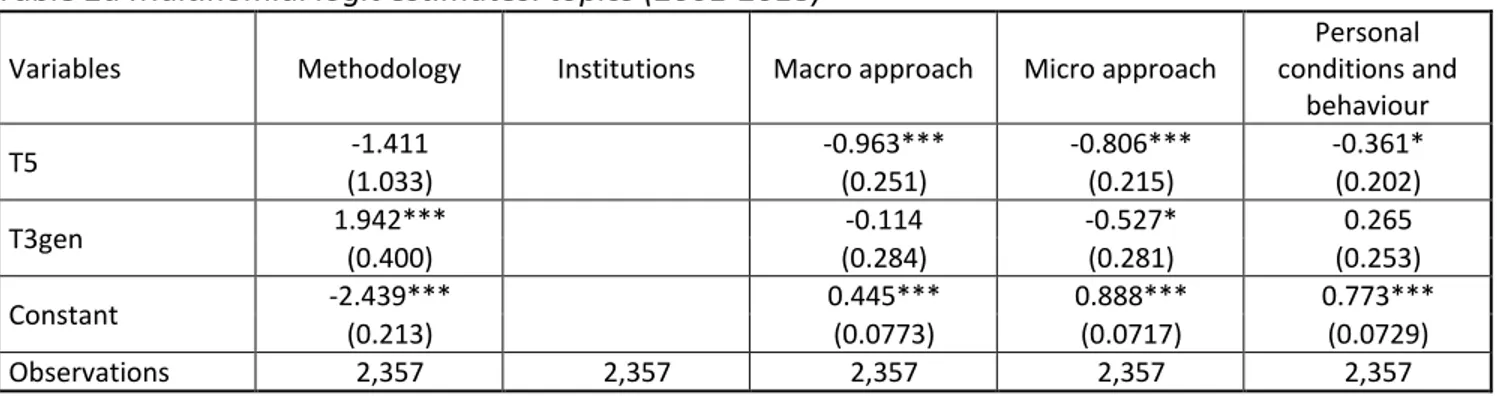
We estimate more precisely these differences by running a set of multinomial logistic
regressions, following Hamermesh (2013). The dependent variable is the number of articles for each category and the reference category is the T-ec.hist: a significant coefficient signals a difference with either T5 or T3gen. A positive (negative) sign implies that the group of articles as defined in the top row is more (less) frequent than the baseline outcome – i.e. “institutions” for topics (Table 2a), the “long 19th century (1815-1914)” for historical periods (Table 2b), the “United Kingdom” for
geographical areas (Table 2c), and “no econometrics” for the techniques (Table 2d).
Table 2 about here
The exercise confirms that differences between T-ec.hist and T8 are quite wide but adds that there are relevant differences also between T5 and T3gen. Almost three quarters of all coefficients (20 out of 28) are significant, and most of them are significant at 1%. Table 2a shows that the differences in topics is limited to the T5 – indeed articles on “institutions” account only for 13.1% of total in the T3gen. The T8 publish more articles on “long run” and on the “20th century” than T-ec.hist (Table 2b). The high share of articles on the 20th century in the T8 is likely due to the availability of better data which are often needed to use advanced techniques (Table 2d). Good data can explain to some extent the high share of articles on the United States, jointly with the affiliation of authors and possibly with the geographical location of journals (Table 2c). However, also coefficients for other areas are positive and some of them, especially for the T5, are high and highly significant. This reflect the somewhat skewed distribution by area of articles in the reference category, the T-ec.hist: about a quarter of them deal with the United Kingdom (almost half of the total for EHR), especially on the Industrial Revolution.
4.2. The database features a total of 2,040 authors, who have made 2,357 “contributions” (i.e., an average of 1.16 each).16 At the time of publication, these authors were working in 684 different
15 The largest differences appear in marginal categories with very few articles such as history of economic thought (13 articles in the T8 – i.e. 3.6% - vs 7 – 0.4%- in T-ec.hist) and firm (1 vs. 37 articles).
16 We assign to each author (and thus to his or her institution and, ultimately, to his or her country) the inverse of the number of authors of the article (0.5 if there are two authors, 0.33 if there are three and so on). We distinguish the fractionally weighted articles from the unweighted ones by using the word “contribution” instead of “article”.
11
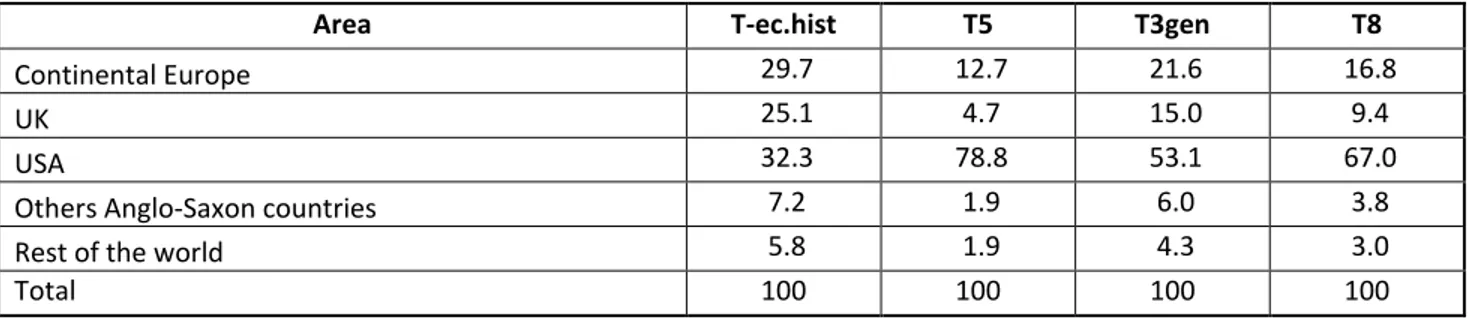
institutions, which included 573 universities and 111 other organizations (such as the World Bank, the Federal Reserve Board of Governors or the Federal Reserve Bank of New York). Almost all these institutions were located in Europe and North America, but there is a striking difference between the balanced distribution in economic history journals and the strong concentration in the United States in economics ones, especially in the T5 (Table 3).
Table 3 about here
As a rule, authors tend to show a home bias – i.e., write more about their country of affiliation (Cioni, Federico and Vasta 2018), and thus the geographical concentration in the US (67%) can explain the high share of articles on the United States in the T8 (55.1% vs. 25.8% in the T-ec.hist). In all
likelihood, this difference reflects the well-known ‘tyranny’ of the T5 (Heckman and Moktan 2020). Publishing in economic history journals, as in all field ones, and even in the other major generalist journals (the T3gen) may not be enough to get tenure or promotion in top American universities (Margo 2018).
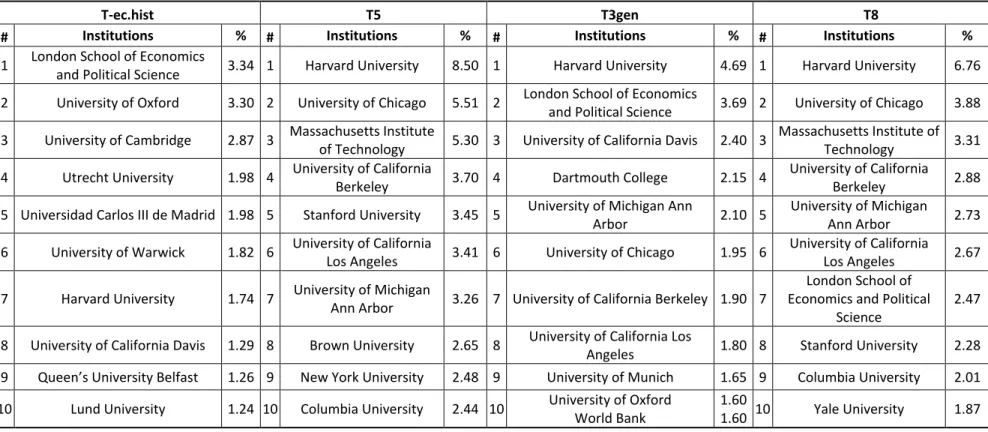
Unsurprisingly, the difference in location between economic history and economics is even wider if one considers the top ten institutions (Table 4). Eight European universities (five British and three Continental) feature in the top ten for the T-ec.hist, one only in the top ten for the T8 and none for the T5. The highest-ranked Continental European university in the T8 (and also in the T5),
Universitat Pompeu Fabra, is only 13th overall. Furthermore, the London School of Economics, the top ranked institution in the T-ec.hist and the only non-American institution in the T8, is a sui generis case. Almost all authors of articles in the T-ec.hist (95%) are affiliated with the Department of
Economic History, while over three-quarters of all articles in the T8 were written by members of other departments (mostly Economics). One only non-academic organization, the World Bank, appears in the Table 4 at the 10th position of the ranking for the T3gen, but it drops to the 32nd position in the T8.
Table 4 about here
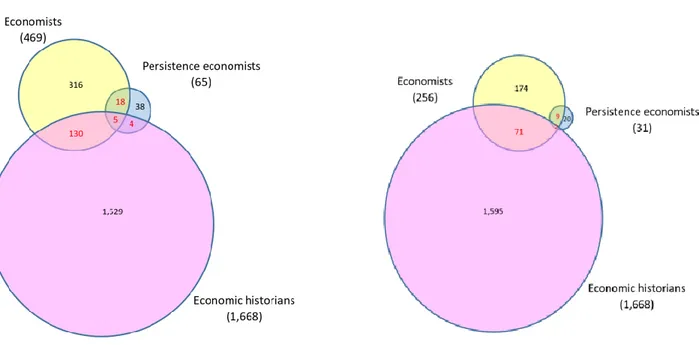
This difference in affiliations is arguably part of a more general cleavage between authors publishing in economics journals (“economists”) and in economic history ones (“economic
12
of article (H or PS) and two sets of journals – the whole database on the left (Fig. 4a) and a reduced one, featuring only the T5 and the T-ec.hist, on the right (Fig. 4b).
Figure 4 about here
More than nine economic historians out of ten (the 91.7%) have published only in the T-ec.hist and almost seven economists out of ten (69.7%) have published exclusively in the T8. Only 139 “hybrid” authors (6.8% of the total of 2,040) have published one article in both the T-ec.hist and the T8 and only 35 “high flyers” (1.7% of the total) have authored (or co-authored) at least two articles in both groups of journals. On the other hand, the 139 “hybrid” authors were substantially more
productive than both “pure” economic historian and “pure” economists.17 Overall, “hybrid” authors account for more than one sixth (17.7%) of all contributions to the T-ec.hist and for exactly one third (33.1%) of all contributions to the T8.18 Figure 4a also shows that the authors of PS, or “persistence economists”, are a distinctive “tribe” even within economists. More than half of them (38 out of 65) have published only PS, almost always with a co-author, and no other economic history articles (of course, they have been active in other fields of economics), while only five scholars have contributed to all three categories (PS, H and articles in the T-ec.hist). The number of “hybrid” authors is, by definition, smaller if one takes into account only the T5 (Figure 4b). Only 73 people (3.9% of the total in the database) have published in both a T5 journal and a T-ec.hist journal, and only 17 (0.9%) of them are “high-flyers”. However, “hybrid” scholars account for 26.4% of authors in the T5 (73 out of 276) and for (31%) in the T3gen (88 out of 284).
It is well known that economics is a male-dominated field (Hamermesh 2013), and economic history is not an exception. Overall, in our database, women account for 19.5% of all authors, 16.5% of all “pure” economists, 20.5% of all “pure” economic historians and 15.1% of “hybrid” ones. The share of women is somewhat higher (23.7%) amongst the pure “persistence economists”: PS is a new field that is attracting young scholars, among which women are more represented.
17 Each “hybrid” author has published 0.9 contributions in the T8, with a median of 0.5, while the 372 pure “economists” have published 0.6 contributions each, with the same median as the “hybrid” authors. Moreover, the “hybrid” authors have published 2.5 contributions each in T-ec.hist, with a median of 1.8, versus 1.1 contributions each and a median of 0.8 for the 1,529 pure “economic historians”.
18 By definition, the impact of the 35 “high-flyers” is proportionally larger: they account for 6.5% of contributions to the T-ec.hist journals and 14.6% to the T8.
13
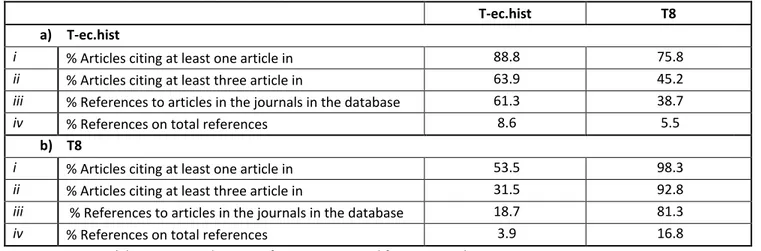
4.3. We explore the interaction between economics and economic history journals with four measures of the share of direct and cross citations — i.e. of citations to a journal in the same group (a T-ec-hist citing another T-ec-hist) or of citations to the other group. Table 5 reports results separately for T-ec-hist (Table 5a) and T8 (Table 5b).
Table 5 about here
The first two rows measure the interest of economic historians and economists to engage in the scholarly debate in both communities. We proxy it with the share of articles which quote at least once (rows i) or at least three times (rows ii) articles published in T-ec.hist and in T8. Economists are more interested in the work of their colleagues than economic historians. Almost all 365 articles in the T8 quote other articles in the T8 (98.3% quote at least one article and 92.8% quote three or more), while the same shares for the 1,992 T-ec.hist articles are decidedly lower (88.8% and 63.9%). In contrast, economists are much less interested than economic historians in the scholarly debate in the other community. Three quarters (75.8%) of articles in T-ec.hist quote at least one article in the T8, and almost half (45.2%) quote at least three articles, while only half (53.5%) of articles in the T8 quote at least one article in the T-ec.hist, and less than one third (31.5%) quote at least three articles.
The two other rows (iii and iv) of Table 5 measure the overall impact of economic history articles. They have the same numerator, the number of references to articles in T-ec.hist or T8, but a different denominator. In the rows iii) the denominators are the number of citations to the articles of the journals in the “core” database, thus adding up, by definition, to 100%, while the denominators of rows iv) are the total number of citations, including those to other journals, books, original sources etc. The difference between economic history and economics journals is again stark. The T8 quote other T8 a lot (81.3% of citations to journals in the database and 16.8% of all citations) and quote the T-ec.hist journals rather infrequently (the remaining 18.7% of references in the database and only 3.9% of all references). The T-ec.hist quote the T8 more frequently (38.7% citations), although these account for a mere 5.5% of all citations mainly because economic history journals quote many other materials (books, sources, etc.). On average, each article in T8 cites 2.4 articles published in T-ec.hist and 10.4 in T8 (median values: 1 and 9), while an article in T5-ec.hist cites 5.2 and 3.3 articles
published respectively in T5-ec.hist and in T8 (median values: 4 and 2). In a nutshell, our data suggest that economists pay less attention to economic historians than they receive.
14
5. The success in citations
The citation count became the standard gauge for measuring the impact of research in scientific fields long time ago, and it is now commonly accepted in the social sciences and economics as well (Card and DellaVigna 2013, Hamermesh 2018). We measure success with the number of citations per year since publication because older papers have had more opportunities to be cited, ceteris paribus. (Table 6).
Table 6 about here
Table 6 highlights two points. First, as expected, articles in field journals (here the T-ec.hist) are cited substantially less than articles in top economics journals (Heckman and Moktan 2020).19 The differences with the T5 are, as expected, quite large, but they remain substantial also with the T3gen.20 They range from a minimum of 2.6 times between the EJ and the JEH to a maximum of 12.7 times for the JEL vs the EREH. Second, PS are more successful than H and this cannot be mechanically related to the outlet, as the T5 have published roughly as many PS as H (respectively 52% and 54%). On the other hand, the success might depend not only on the journal (T-ec.hist or T8) and/or on the methodological approach (H vs PS) but also on the topic, period and geographical area (cf. Section 4), or on other characteristics of the article (e.g., the number and the affiliation of the authors). We address this issue with a set of regressions, using the number of citations per year as the dependent variable (Table 7).21
Table 7 about here
In the simplest specification (column 1), we measure the premium from publishing articles of economic history in any of the T8 relative to publishing in a field journal (T-ec.hist). Then, we
distinguish between groups of economics journals (column 2) or between types of articles (column 3). Columns 4 to 6 reproduce the specifications of the first three columns, adding an extensive set of
19 For the list of the top 10 cited articles for the T5 and T-ec.hist, see Appendix: Table A5.
20 The gap is also evident but smaller for the articles in the two “history-friendly” journals, the JDE and the JEG have received 4.8 and 3.0 citations per year, respectively.
21 All values are rounded up to the nearest higher integer to run a negative binomial model. As a robustness check, we also carried out a similar set of Poisson regressions, obtaining fully consistent results in terms of the size and significance of the coefficients.
15
controls (see note to Table 7 for a detailed list).22 Finally, in column 7, we contrast the relative importance of publication outlet and type of article as causes of citational success.23
The baseline specifications show, as expected, that articles in the T8 receive more citations per year than those in the T-ec.hist (column 1), articles in T5 more than in T3gen (column 2) and PS more than H articles (column 3). After introducing our set of controls, all variables remain highly significant, but the coefficients are lower, especially for the PS. The gaps with the T-ec.hist, as measured by marginal effects, are very large: 5.8 more citations per year for an article in a T5, 3.2 for one in the T3gen, 4.9 for a H article, and up to 9.4 for a PS. Column 7 shows that the journal matters more than article type: the coefficients for the T5 and T3gen remain almost the same, while the dummy for PS and the interaction term with T5 are both positive but not significant.
The controls to our baseline regression add some important insights about the causes of success (see Appendix: Table A6). In the whole sample, the techniques used are not significant. Articles on the “micro approach” receive fewer citations than those on “institutions” or on any other issue. Likewise, articles on the “long 19th century (1815-1914)”, the reference category, are quoted less than any other period, except the pre-1492 ones, which is a small category with only 106 articles (4.7% of the total). The cross-country articles attract many more citations than all articles on a single country, including the United States. As expected, the year of publication is negative and significant: more recent articles are less likely to be cited, even after normalization. As in Card and DellaVigna (2013) and Laband (2013), we find that longer articles are cited more, in all likelihood because they offer more content.
We control for a wide range of characteristics of the authors and only few affect the success of their work. “Hybrid” authors and “high flyers” (“hybrid_2” in Table A6 in the Appendix) do not receive significantly more citations than others, possibly because publishing in the T-ec.hist reduces their total tally. Consistent with the results of Hamermesh (2018), the gender of the author does not matter: the dummies for both articles by all-women teams and articles by mixed-gender teams are not significant. The affiliation with a generic American institution does not matter, while the dummy for top
universities in economics is positive (1.1 additional citations per year on average, as seen in column
4-22 We were forced to drop 49 articles because Scopus does not report the number of citations and a further 51 observations for articles on “methodology” because of the perfect collinearity with the variable “no period”.
23 Including dummies for both H and PS would have caused multi-collinearity. Thus, we prefer to focus on PS, as they have collected more citations than H articles have.
16
7) and highly significant.24 Last, but not least, as expected (Card and DellaVigna 2013, Hamermesh 2018), co-authorship increases the number of citations, by about 12.3%.25
In the Appendix, we report the results of an extensive set of robustness checks. We first test the sensitivity to changes in the set of journals, by: i) adding the two “history-friendly” journals (Table A7 in the Appendix); ii) focusing on the top ten journals as ranked by Kalaitzidakis, Mamuneas and Stengos (2011: Table 1)26 (Table A8 in the Appendix); iii) considering all the 13 journals of our database (Table A9 in the Appendix). The dummies for T5 and T3gen are almost identical and those for other groups of economic journals (the “history-friendly” and the three top field) confirm that publishing in economics journals pays relative to T-ec.hist, although less than publishing in the T5. Furthermore, we test the robustness of results to our choice of articles by: iv) adding the “non-core” economic history articles (“model testing” and “empirical testing”) in the T8 (Table A10 in the
Appendix); and by v) running regressions for two comparable lists of economic history articles in the T5 from 2001 to 2014: our database and Abramitzky (2015), who selected articles by looking at the JEL codes rather than at the title and content of the articles (Table A11 in the Appendix). The results are almost identical.
One might argue that our approach is slightly unfair towards articles in the T-ec.hist. Indeed, we are comparing a very small number of economics journals, which also attract readers with articles on other issues, with approximately one-sixth of all international economic history journals, which are generally read only by field scholars.27 Indeed, the gap between the number of citation per year between T8 and the T-ec.hist shrinks if we consider only the most quoted articles in the latter. The average and median (5.1 and 4.2, respectively) of the top decile articles in T-ec.hist are similar to the statistics for the T3gen, although still far below those of the T5. The top decile of the T.ec-hist would
24 The top universities in economics, as ranked by Quacquarelli-Symonds in 2019, are: Harvard University, Massachusetts Institute of Technology (MIT), Stanford University, University of California Berkeley (UCB), University of Chicago, the London School of Economics and Political Science (LSE), Princeton University, Yale University, University of Oxford and University of Cambridge. Note that seven of these universities are included also in the top ten by number of citations in the T8 (Table 4).
25 The optimal number of authors from the point of view of citational success seems to be three. The average number of citations per year over the whole database rises from 1.9 for single-authored articles to 2.7 for articles with two authors and to 3.7 for articles with three authors but then declines slightly to 3.4 for articles with four or more authors.
26 In this ranking, the journals placed 6th to 10th (T5bis in our robustness check) includes EJ and RESTAT and three top field journals (JET, JME and JPUB).
27Scimago (www.scimagojr.com) features 621 journals in the category of economics and econometrics. In contrast, we have identified 23 journals as economic history journals, out of which 6 deal with business history (Cioni, Federico and Vasta 2018).
17
sit at the middle of the distribution of all articles published in the T8. We test this insight by re-running the regression for the top-decile of articles in T-ec.hist (Table 8 and full controls in Table A12 in the Appendix). The dummies for journal group (columns 1 and 2) and type of article (column 3) remain positive and significant, but the coefficient is not significant for the T3gen. After adding the controls (columns 4-6), the citation premium for publishing halves for the T5 (from 5.8 citations per year to 2.5) and becomes negative, but not significant, for the T3gen. As for the type of article, the citation premium halves for the PS (from 9.4 to 5.2) and becomes really minimal for H articles (from 4.9 to 0.8). Finally, the results in column 7 confirm that only articles of any type in the T5 receive more citations than publications in the top decile of the T-ec.hist. Reassuringly, the change in sample hardly affects the coefficients of the controls. Even more reassuringly, the results are identical if, instead of the top decile, we take into account the top 365 articles by number of citations per year (the same number of articles in the T8) in the T-ec.hist (Table A13 in the Appendix).
Table 8 about here 6. The success of persistence studies
The results of the previous Section about the PS are somewhat puzzling. The raw data for the “core” sample (Table 6) suggest that they are far more successful than the “traditional” H articles (let alone the articles in the T-ec-hist), but in the full specification (Table 7, column 7), the dummy for PS and its interaction with the T5, although positive, are not significant. We explore this issue in two different ways.
First, we look at the distribution of economic history articles ranked by citation per year (Figure 5 and Table A14 in the Appendix).28
Figure 5 about here
The difference between PS and H concentrates in the top part of the distribution: there are 12 PS in the top decile (36 articles) and 19 in the top quartile, out of 40 altogether. These include the three most successful articles in the whole database, the seminal article by Acemoglu, Johnson and
28 In principle, the ranking by total citations and ranking by citations per year may differ, as very successful recent articles have had less time to accumulate citations. However, the difference hardly matters in our case: the ten most quoted articles accounted for 33.3% of the citations in the T8 and 6.1% in T-ec.hist.
18
Robinson on colonial roots of underdevelopment (2001), the survey by La Porta, Lopez-de-Silanes and Shleifer (2008) on the economic consequences of legal origins, and the article by Acemoglu, Johnson and Robinson on the reversal of fortune (2002). These articles have received respectively 3,688, 1,443 and 1,125 citations, or 199.4, 97.8 and 82.5 per year, accounting for almost two thirds (65.4%) of all citations to PS 29. The other nine PS articles in the top decile have been less successful than H articles: they have got on average 28.6 citations per year (median 27.5), versus a mean of 36.9 citations (median 31.7) for the H articles. The fourth ranked PS, the article by Nunn and Wantchekon (2011) on the effects of the slave trade on trust, is eleventh, and two other famous works, by Alesina, Giuliano and Nunn (2013) on the origins of gender roles in agriculture, and by Ashraf and Galor (2013) on the negative effects of (high and low) human genetic diversity on levels of development, are fourteenth and fifteenth. Indeed, H articles occupy the positions, from the fourth to the tenth in the ranking (cf. Table A5 in the Appendix). Five out of seven deal with issues in income distribution: the article by Piketty and Saez (2003) on income inequality in the US in the 20th century is fourth with 77.1 citations per year and the survey by Atkinson, Piketty and Saez (2011) on top incomes in the world in the last 110 years is fifth with 74.7. Income distribution attracts a lot of attention: the 18 H articles on the issue have been cited more than the average of all PS (23.0 citations per year vs 20.2). In the other deciles, from the second to the tenth, the PS are not more successful than the H. Their average number of citations is slightly higher (6.2 per year vs 4.8) but the median is decidedly lower (3.7 vs 5.3).
Our second approach focuses on the source of citations. A recent paper by Angrist et al (2020) shows how economic articles, and especially on microeconomics, are attracting an increasing number of citations from “extramural” disciplines, especially from political science, sociology and “business” (i.e. management and finance). We cannot compare our results as Angrist et al (2020) since they do not consider cross-citations between different sub-fields within economics and include economic history articles in a “miscellaneous” category with experimental economics, law and economics and so on. However, one could surmise that the focus on present-day outcomes in PS would attract more citations from economics and from other fields, while H are more likely to be quoted by other
29 The article by Acemoglu, Johnson and Robinson (2001) has been cited so many times also because many authors have used their data on settlers’ mortality as instrument. The reliability of these data is however controversial (Acemoglu, Johnson and Robinson 2012, Albouy 2012).
19
economic history articles. We test this hypothesis by classifying citations received by economic history articles in 16 categories of sources – thirteen groups of journals plus books, working papers and other sources (in this case The Economist).30 We adjust for the different number of PS and H articles by normalizing with the total number of citations received, and we measure the relative impact of PS and H for each source as the ratio between the two shares. The higher the ratio for a category is, the more PS attract attention from sources belonging to this category. In Figure 6, we plot the ratio between the two shares for the groups of journals analysed in this paper (solid bars) and for other selected sources (for full data, see Table A15 in the Appendix).
Figure 6 about here
The PS have been cited relatively more by the “history-friendly” journals, the “political science”, the “management” and the “other economic history” journals. The high share of citations to PS from JDE (second in the ranking for citation to PS) and JEG (fourth) is not really surprising, given the number of PS published in these journals.31 The ratio for “political science” journals is high but the underlying number of citations is very small – so that the highest ranked journal, the American Political Science Review, is at the 21st position for PS and at the 98th for the H articles. The high ratio for “management” reflects the success of the article by La Porta, Lopez-de-Silanes and Shleifer (2008) on the legal origins for the former. Likewise, the ratio for “other economic history” journals is so high because Economic History of Developing Regions features at the seventh position among all sources of citations to PS, in all likelihood because so many PS deal with Africa. Both H and PS are cited by
general-purpose books – most notably the Handbook of Economic Growth, which has a chapter on historical developments (Nunn 2014). On the other side, as expected, the PS get fewer citation from
30 As of 13-18 May 2019, the 365 articles in economics journals (325 H and 40 PS) have received a total of 35,092 citations (25,124 the H articles and 9,968 the PS) from more than 5,500 sources, books included. In the analysis, we focus on the 1,641 sources which has quoted at least three times an article in the database – for a total of 30,288 citations (21,567 to H and 8,728 to PS). The thirteen journals’ groups are: T-ec.hist, T5, T3gen, “history friendly”, “other economic history”, “other economics journals” (including the three top field), “political science”, “finance”, “management”, “other social science”, which includes also interdisciplinary journals, “history”, “multidisciplinary science” journals (Nature, Proceedings
of the National Academy of Science (PNAS) and Science) and a residual category “other journals”, which includes mostly
scientific journals. We allocate each journal to a group according to its main subject category in Scimago and to the “aims and scope” reported in its website.
31 The first source of citations to PS is the Journal of Comparative Economics, which focuses on institution and their change and the third is World Development, which is specialized in multidisciplinary studies in development. The first T5 is the
20
“history” journals, which overall pay little attention to economics journal, and from the T-ec.hist. The JEH is ranked second, EEH third and EHR ninth among sources cited H articles, while JEH appears in the rank for PS only in the thirteenth position.
In short, so far the PS have not shown, with the possible exception of “political science”, much capacity of attracting interest outside economics, and show distinctly less capacity to interest historians. The early PS, and especially the three top ones, have been and are still quoted a lot also because of their methodological novelty. If the number of PS published in top economics journals continues to grow, as likely, it is possible that they will quoted for their contributions to specific (economic, rather than historical) debates and thus their citation statistics would converge towards the mean of the H.
7. Conclusions
In recent times, economic history is changing its nature, widening its purview towards non strictly economic issues and looking for the historical roots of current outcomes (Cioni, Federico and Vasta 2021). These trends fit well with the intellectual curiosity and the institutional incentives of economists. First, they are interested in the present rather than in the past for its own sake, as economic historians (Abramitzky 2015, Jaremski 2020). Second, American institutions are very strongly pushing their faculty, including economic historians, to publish in top economics journals rather than in top field journals as a condition for their academic careers (Heckman and Moktan 2020). These trends have been hailed as an “integration of economic history into economics” (Margo 2018).
This paper has systematically investigated this claim through a quantitative analysis based on economic history articles published both in the top four field journals and in the eight most prominent general-interest economic journals. The results downplay the extent of the integration. There is no doubt that economists are more interested in economic history now than in the late 20th century, but the impact of economic history in economics journals is still fairly modest compared to the role it enjoyed in the first half of the 20th century and it has not been growing in recent years. Furthermore, the revival has affected very few members of the world-wide community of economic historians (almost ten thousand people, according to estimates by Baten and Mushallik (2012)) and has not much affected even the (consistent) minority who publish in the top field journals. We have
21
documented the division of authors in our database into three distinct groups, or tribes: “economic historians”, “economists”, and “persistence economists”. There are a substantial, but still limited, number of “hybrid” scholars, who publish in both economics and economic history journals. These three tribes differ substantially in terms of their research questions, style of work, pattern of citations and, above all, affiliation. The “economists” and “persistence economists” are mainly affiliated with American universities, while two-thirds of the “economic historians” are based in Europe.
Publishing in leading economics journals coincides with a greater number of citations relative to publication in field journals. On the other hand, it is well known that the competition to publish in such journals is fierce. Is the citational success of an economic history article in economic journals worth the effort? Our econometric analysis suggests a nuanced answer. It is surely worth publishing any article in economic history in the T5 economics journals, especially a persistence study. The “tyranny” of the T5 (Heckman and Moktan 2020) is, however, a common feature in all fields in economics, not just in economic history. Publishing in other major economics journal yields a smaller additional citation bonus relative to the top economic history journals, that disappears if the
comparison is limited to the top decile of the distribution by citations per year of articles in economic history journals. In a nutshell, for truly good work in “traditional” economic history, the publication outlet matters only if the article is in the T5. The persistence studies are intrinsically different, as they imply an unprecedented methodological shift.
Probably, it is too early to assess the whole impact of these new trends, but the field is evolving rapidly. Will economic history lose its soul becoming a sub-field of development studies as advocates by Nunn? Will persistence studies become a separate field? Or, perhaps, there might be the rise of a new synthesis with scholars integrating a wider range of research questions, such the more
22
References
Abramitzky, R. (2015). ‘Economics and the modern economic historian’, Journal of Economic History, 75(4), pp. 1240-1250.
Acemoglu, D., Johnson, S. and Robinson, J.A. (2001). ‘The Colonial Origins of Comparative Development: An Empirical Investigation’, American Economic Review, 91(5), pp. 1369-1401.
Acemoglu, D., Johnson, S. and Robinson, J.A. (2002). ‘Reversal of Fortune: Geography and Institutions in the Making of the Modern World Income Distribution’, Quarterly Journal of Economics, 117(4), pp. 1231-1294.
Acemoglu, D., Johnson, S. and Robinson, J.A. (2012). ‘The Colonial Origins of Comparative
Development: An Empirical Investigation: Reply’, American Economic Review, 102(6), pp. 3077-3110. Adena, M., Enikolopov, R., Petrova, M., Santarosa, V. and Zhuravskaya, E. (2015). ‘Radio and the Rise of the Nazis in Prewar Germany’, Quarterly Journal of Economics, 130(4), pp. 1885-1939.
Albouy, D.Y. (2012). ‘The Colonial Origins of Comparative Development: An Empirical Investigation: Comment’, American Economic Review, 102(6), pp. 3059-3076.
Alesina, A., Giuliano, P. and Nunn, N. (2013). ‘On the Origins of Gender Roles: Women and the Plough’, Quarterly Journal of Economics, 128(2), pp. 469-530.
Anauati, V., Galiani, S. and Gàlvez, R.H. (2016). ‘Quantifying the life cycle of scholarly articles across fields of economic research’, Economic Inquiry, 54(2), pp. 1339-1355.
Andreano, R. (1970). The new economic history: recent papers on methodology. John Wiley and Sons, Oxford.
Angrist, J., Azoulay, P., Ellison, G., Hill, R. and Feng Lu, S. (2020). ‘Inside Job or Deep Impact? Extramural Citations and the Influence of Economic Scholarship’, Journal of Economic Literature, 58(1), pp. 3-52.
Ashraf, Q.H. and Galor, O. (2013). ‘The 'Out of Africa' Hypothesis, Human Genetic Diversity, and Comparative Economic Development’, American Economic Review, 103(1), pp. 1-46.
Ashraf, Q.H. and Galor, O. (2018). ‘The Macrogenoeconomics of Comparative Development’, Journal of Economic Literature, 56(3), pp. 1119-1155.
Atkinson, A.B., Piketty, T. and Saez, E. (2011). ‘Top incomes in the long run of history’, Journal of Economic Literature, 49(1), pp. 3-71.
Austin, G. (2008). ‘Resources, techniques, and strategies south of the Sahara: revising the factor endowments perspective on African economic development, 1500-2000’, Economic History Review, 61(3), pp. 587-624.
Baten, J. and Muschallik, J. (2012). ‘The Global Status of Economic History’, Economic History of Developing Regions, 27(1), pp. 93-113.
Bornmann, L., Butz, A. and Wohlrabe, K. (2018). ‘What are the top five journals in economics? A new meta-ranking’, Applied Economics, 50(6), pp. 659-675.
Card, D.E. and DellaVigna, S. (2013). ‘Nine Facts about Top Journals in Economics’, Journal of Economic Literature, 51(1), pp. 144-161.
23
Cioni, M., Federico, G. and Vasta, M. (2018). ‘Ninety years of publications in Economic History: evidence from the top five journals (1927-2017)’, Department of Economics and Statistics Working Paper, University of Siena, n. 791.
Cioni, M., Federico, G. and Vasta, M. (2021), ‘The two Revolutions in Economic History’, in Bisin, A. and Federico, G. (eds.), Handbook of Historical Economics, Amsterdam: Elsevier North Holland.
Debreu, G. (1991). ‘The Mathematization of Economic Theory’, American Economic Review, 81 (1), pp. 1-7.
Diebolt, C. and Haupert, M. (2018). ‘We are ninjas: how economic history has infiltrated economics’, Association Française de Cliométrie (AFC) Working Papers N. 4.
Greasley, D. and Oxley, L. (2010). ‘Clio and the economist: making historians count”, Journal of Economic Surveys, 24(5), pp. 755-774.
Hamermesh, D.S. (2013). ‘Six Decades of Top Economics Publishing: Who and How?’, Journal of Economic Literature, 51(1), pp. 162-172.
Hamermesh, D.S. (2018). ‘Citations in economics: measurement, uses and impact’, Journal of Economic Literature, 56 (1), pp. 115-156.
Heckman, J.J. and Moktan, S. (2020). ‘Publishing and Promotion in Economics: The Tyranny of the Top Five’, Journal of Economic Literature, 58(2), pp. 419-470.
Jaremski, M. (2020). ‘Today’s economic history and tomorrow’s scholars’, Cliometrica, 14(1), pp. 169-180.
Kalaitzidakis, P., Mamuneas, T.P. and Stengos, T. (2011). ‘An updated ranking of academic journals in economics’, The Canadian Journal of Economics, 44(4), pp. 1525-1538.
Kelly, M. (2019). ‘The standard errors of persistence’, CEPR Discussion Paper DP13783.
La Porta, R., Lopez-de-Silanes, F. and Shleifer, A. (2008). ‘The economic consequences of legal origins’, Journal of Economic Literature, 46(2), pp. 285-332.
Laband, D.N. (2013). ‘On the use and abuse of economics journal rankings’, Economic Journal, 123(570), F223-F254.
Linnemer, L. and Visser, M. (2017). ‘The Most Cited Articles from the Top-5 Journals (1991-2015)’, Working Papers HAL-01634432.
Lyons J.S., Cain, L.P. and Williamson, S.H. (eds) (2007). Reflections on the Cliometrics Revolution. Conversations with economic historians. Routledge, London and New York.
Margo, R. (2018). ‘The integration of economic history into economics’, Cliometrica, 12(3), pp. 377-406.
McCloskey, D. (1976). ‘Does the past have useful economics?’, Journal of Economic Literature, 14(2), pp. 434-461.
Michalopoulos, S. and Papaioannou, E. (2017). ‘Series Introduction: Historical legacies and
contemporary development’, in Michalopoulos, S. and Papaioannou, E. (eds.), The long economic and political shadow of history, VoxEU.org Book III volumes, London: CEPR Press, pp. viii-xxxi.
24
Michalopoulos, S. and Papaioannou, E. (2020). ‘Historical legacy and African development’, Journal of Economic Literature, 58(1), pp. 53-128.
Nunn, N. (2009). ‘The importance of history for economic development’, Annual Reviews of Economics, 1, pp. 65-92.
Nunn, N. (2014). ‘Historical Development’, in Aghion, P. and Durlauf, S.N. (eds.), Handbook of Economic Growth, Volume 2A, Amsterdam: North-Holland, pp. 347-402.
Nunn, N. (2020). ‘The historical roots of economic development’, Science, 367, eaaz9986: DOI: 10.1126/science.aaz9986.
Nunn, N. and Wantchekon, L. (2011). ‘The Slave Trade and the Origins of Mistrust in Africa’, American Economic Review, 101(7), pp. 3221-3252.
Piketty, T. and Saez, E. (2003). ‘Income inequality in the United States, 1913-1998’, Quarterly Journal of Economics, 118(1), pp. 1-41.
Satyanath, S., Voigtländer, N. and Voth, H.J (2017). ‘Bowling for Fascism: Social Capital and the Rise of the Nazi Party’, Journal of Political Economy, 125(2), pp. 478-526.
Schularick, M. and Taylor, A.M. (2012). ‘Credit booms gone bust: Monetary policy, leverage cycles, and financial crises, 1870-2008’, American Economic Review, 102(2), pp. 1029-1061.
Spolaore, E. and Wacziarg, R. (2013). ‘How deep are the roots of economic development?’, Journal of Economic Literature, 51(2), pp. 325-369.
Squicciarini, M.P. and Voigtländer, N. (2015). ‘Human Capital and Industrialization: Evidence from the Age of Enlightenment’, Quarterly Journal of Economics, 130(4), pp. 1825-1883.
Voth, H.J. (2021). ‘Persistence: myth and mystery’, in Bisin, A. and Federico, G. (eds), Handbook of Historical Economics, Amsterdam: Elsevier North Holland.
Wei, G. (2019). ‘A bibliometric analysis of the top five economics journals during 2012-2016’, Journal of Economic Surveys, 33(1), pp. 25-59.
25
Tables and Figures
Table 1. Number of articles in the database (2001-2018)
Journal H PS Total EHR 617 617 JEH 577 577 EEH 491 491 EREH 307 307 T-ec.hist 1,992 1,992 AER 87 9 96 ECMA 5 4 9 JPE 27 - 27 QJE 53 8 61 RESTUD 5 - 5 T5 177 21 198 EJ 68 9 77 JEL 15 1 16 RESTAT 65 9 74 T3gen 148 19 167 T8 325 40 365 Core database 2,317 40 2,357 JDE 54 8 62 JEG 28 11 39 History-friendly 82 19 101 JET 2 - 2 JME 46 1 47 JPUB 27 - 27 Top field 75 1 76 Total database 2,474 60 2,534
26
Table 2a Multinomial logit estimates: topics (2001-2018)
Variables Methodology Institutions Macro approach Micro approach
Personal conditions and behaviour T5 -1.411 -0.963*** -0.806*** -0.361* (1.033) (0.251) (0.215) (0.202) T3gen 1.942*** -0.114 -0.527* 0.265 (0.400) (0.284) (0.281) (0.253) Constant -2.439*** 0.445*** 0.888*** 0.773*** (0.213) (0.0773) (0.0717) (0.0729) Observations 2,357 2,357 2,357 2,357 2,357
Table 2b. Multinomial logit estimates: historical periods (2001-2018)
Variables Classical and medieval (before 1492) Early Modern History (1492-1815) Long 19th century (1815-1914) 20th century (1915-present) Long-run T5 -0.0196 -0.202 1.223*** 1.550*** (0.486) (0.295) (0.192) (0.268) T3gen -0.0845 -0.680* 1.026*** 1.939*** (0.539) (0.379) (0.212) (0.262) Constant -2.085*** -0.678*** -0.264*** -1.968*** (0.108) (0.0617) (0.0543) (0.102) Observations 2,335 2,335 2,335 2,335 2,335
Table 2c. Multinomial logit estimates: geographical areas (2001-2018)
Variables Cross-country Continental Europe UK USA Rest of the world
T5 2.493*** 1.561*** 2.854*** 1.982*** (0.443) (0.448) (0.427) (0.461) T3gen 1.700*** 0.185 0.944*** 0.304 (0.281) (0.316) (0.292) (0.364) Constant -0.548*** 0.144** -0.146** -0.555*** (0.0761) (0.0629) (0.0676) (0.0762) Observations 2,319 2,319 2,319 2,319 2,319
Table 2d. Multinomial logit estimates: econometric techniques (2001-2018)
Variables No econometrics Econometric tools Advanced econometrics
T5 1.110*** 3.083*** (0.292) (0.298) T3gen 0.436* 2.174*** (0.240) (0.252) Constant 0.717*** -1.147*** (0.0502) (0.0837) Observations 2,357 2,357 2,357
Source: our own elaborations.
27
Table 3. Share of contributions by area of affiliation (2001-2018)
Area T-ec.hist T5 T3gen T8
Continental Europe 29.7 12.7 21.6 16.8
UK 25.1 4.7 15.0 9.4
USA 32.3 78.8 53.1 67.0
Others Anglo-Saxon countries 7.2 1.9 6.0 3.8
Rest of the world 5.8 1.9 4.3 3.0
Total 100 100 100 100
Table 4. Top 10 institutional affiliations by number of contributions (2001-2018)
T-ec.hist T5 T3gen T8
# Institutions % # Institutions % # Institutions % # Institutions %
1 London School of Economics
and Political Science 3.34 1 Harvard University 8.50 1 Harvard University 4.69 1 Harvard University 6.76 2 University of Oxford 3.30 2 University of Chicago 5.51 2 London School of Economics
and Political Science 3.69 2 University of Chicago 3.88 3 University of Cambridge 2.87 3 Massachusetts Institute
of Technology 5.30 3 University of California Davis 2.40 3
Massachusetts Institute of Technology 3.31 4 Utrecht University 1.98 4 University of California
Berkeley 3.70 4 Dartmouth College 2.15 4
University of California
Berkeley 2.88 5 Universidad Carlos III de Madrid 1.98 5 Stanford University 3.45 5 University of Michigan Ann
Arbor 2.10 5
University of Michigan
Ann Arbor 2.73 6 University of Warwick 1.82 6 University of California
Los Angeles 3.41 6 University of Chicago 1.95 6
University of California
Los Angeles 2.67 7 Harvard University 1.74 7 University of Michigan
Ann Arbor 3.26 7 University of California Berkeley 1.90 7
London School of Economics and Political
Science
2.47
8 University of California Davis 1.29 8 Brown University 2.65 8 University of California Los
Angeles 1.80 8 Stanford University 2.28 9 Queen’s University Belfast 1.26 9 New York University 2.48 9 University of Munich 1.65 9 Columbia University 2.01 10 Lund University 1.24 10 Columbia University 2.44 10 University of Oxford
World Bank
1.60
1.60 10 Yale University 1.87 Sources: our own elaborations.
Table 5. Citation patterns by groups of journals
T-ec.hist T8
a) T-ec.hist
i % Articles citing at least one article in 88.8 75.8
ii % Articles citing at least three article in 63.9 45.2
iii % References to articles in the journals in the database 61.3 38.7
iv % References on total references 8.6 5.5
b) T8
i % Articles citing at least one article in 53.5 98.3
ii % Articles citing at least three article in 31.5 92.8
iii % References to articles in the journals in the database 18.7 81.3
iv % References on total references 3.9 16.8
Source: our own elaborations on data on references retrieved from Scopus between 13-18 May 2019.
Table 6. Average and median citations per year (2001-2018)
Journal H PS Total
Average Median Average Median Average Median
EHR 1.6 1.1 1.6 1.1 JEH 1.6 1.2 1.6 1.2 EEH 1.3 0.9 1.3 0.9 EREH 1.3 0.9 1.3 0.9 T-ec.ist 1.5 1.1 1.5 1.1 AER 7.4 4.8 37.8 10.7 10.3 5.3 ECMA 4.1 4.0 14.4 13.7 8.6 4.8 JPE 6.2 4.4 6.2 4.4 QJE 13.1 8.2 27.0 19.0 14.9 10.1 RESTUD 12.2 7.6 12.2 7.6 T5 8.9 5.2 29.2 15.7 11.1 5.9 EJ 4.1 2.6 4.5 2.6 4.1 2.6 JEL 10.6 4.4 97.8 97.8 16.1 4.8 RESTAT 4.8 2.8 6.3 4.0 5.0 3.0 T3gen 5.1 3.0 10.3 4.0 5.6 3.1 T8 7.2 3.9 20.2 8.3 8.6 4.2