This document is confidential and is proprietary to the American Chemical Society and its authors. Do not copy or disclose without written permission. If you have received this item in error, notify the sender and delete all copies.
Performance assessment in fingerprinting and multi
component quantitative NMR analyses
Journal: Analytical Chemistry Manuscript ID: ac-2015-00919w.R1 Manuscript Type: Article
Date Submitted by the Author: n/a
Complete List of Authors: Gallo, Vito; Politecnico di Bari, DICATECh
Intini, Nicola; Agenzia Regionale per la Prevenzione e la Protezione dell’Ambiente, ARPA Puglia,
Mastrorilli, Piero; Polytechnic of Bari, DICATECh; Innovative Solutions S.r.l. - Spin off company of the Technical University of Bari,
Latronico, Mario; Polytechnic of Bari, DIAC; Innovative Solutions S.r.l. - Spin off company of the Technical University of Bari,
Scapicchio, Pasquale; RETELAB (Italian network of the laboratories of the Chambers of Commerce), ; LACHIMER (Special Agency of the Chamber of Commerce of Foggia),
Triggiani, Maurizio; Politecnico di Bari, Dipartimento di Ingegneria Elettrica e dell’Informazione
Bevilacqua, Vitoantonio; Politecnico di Bari, Dipartimento di Ingegneria Elettrica e dell’Informazione
Fanizzi, Paolo; Lab.Instruments S.r.l.,
Acquotti, Domenico ; Università degli studi di Parma, Centro Interdipartimentale Misure "Giuseppe Casnati"
Airoldi, Cristina; University of Milano-Bicocca, Dept. Biotechnology and Bioscience
Arnesano, Fabio; University of Bari "A. Moro", Chemistry
Assfalg, Michael; University of Verona, Department of Biotechnology Benevelli, Francesca; Bruker biospin srl,
Bertelli, Davide; University di Modena, Dept. di Science Farmaceutiche Cagliani, Laura Ruth; CNR, ISMAC, Lab. NMR
Casadei, Luca; Università degli Studi di Roma “La Sapienza”, Dipartimento di Chimica
Cesare Marincola, Flaminia; Università di Cagliari, Dipartimento di Scienze Chimiche
Colafemmina, Giuseppe; Università di Bari, Dipartimento di Chimica Consonni, Roberto; CNR, ISMAC, Lab NMR
Cosentino, Cesare; Istituto di Ricerche Chimiche e Biochimiche G. Ronzoni, NMR Center,
Davalli, Silvia; Aptuit (Verona) S.r.l.,
De Pascali, Sandra; University of Salento, DiSTeBA
D'Aiuto, Virginia; Università dell’Aquila, Dipartimento Scienze Fisiche e Chimiche – DSFC
Faccini, Andrea; Università degli studi di Parma, Centro Interdipartimentale Misure "Giuseppe Casnati"
Lamanna, Raffaele; ENEA, UTTRI-GENER
Liguori, Francesca; Consiglio Nazionale delle Ricerche, Istituto di Chimica dei Composti Organometallici
Longobardi, Francesco; University of Bari, Chemistry
Mallamace, Domenico; Università di Messina, Dipartimento di Scienze degli Alimenti e dell’Ambiente
Mazzei, Pierluigi; Università di Napoli Federico II, CERMANU Menegazzo, Ileana; University of Padova, Chemical Sciences
Milone, Salvatore; Istituto Zooprofilattico Sperimentale dell’Abruzzo e del Molise G. Caporale,
Mucci, Adele; Università di Modena e Reggio Emilia, Dipartimento di Chimica
Napoli, Claudia; Bruker BioSpin Business Unit Italy,
Pertinhez, Thelma A; University of Parma, Dept. Medicina Experimental Rizzuti, Antonino; Politecnico di Bari, DICATECh
Rocchigiani, Luca; University of Perugia, Department of Chemistry, Biology and Biotechnology
Schievano, Elisabetta; University , Chemical Sciences Sciubba, Fabio; Sapienza University of Roma, chemsitry
Sobolev, Anatoly; Institute of Chemical Methodologies, CNR, Laboratorio di Risonanza Magnetica "Annalaura Segre"
Tenori, Leonardo; FiorGen Foundation,
Valerio, Mariacristina; Università degli Studi di Roma “La Sapienza”, Dipartimento di Chimica
1 2 3 4 5 6 7 8 9 10 11 12 13 14 15 16 17 18 19 20 21 22 23 24 25 26 27 28 29 30 31 32 33 34 35 36 37 38 39 40 41 42 43 44 45 46 47 48 49 50 51 52 53 54 55 56 57 58 59
Performance assessment in fingerprinting and multi component
quantitative NMR analyses.
Vito Gallo,
*,a,b,cNicola Intini,
c,dPiero Mastrorilli,
a,cMario Latronico,
a,cPasquale Scapicchio,
eMaurizio
Triggiani,
fVitoantonio Bevilacqua,
fPaolo Fanizzi,
gDomenico Acquotti,
hCristina Airoldi,
iFabio
Arnesano,
jMichael Assfalg,
kFrancesca Benevelli,
l,mDavide Bertelli,
nLaura R. Cagliani,
oLuca
Casadei,
pFlaminia Cesare Marincola,
qGiuseppe Colafemmina,
j,rRoberto Consonni,
oCesare
Cosentino,
sSilvia Davalli,
tSandra A. De Pascali,
uVirginia D’Aiuto,
vAndrea Faccini,
hRoberto
Gobetto,
wRaffaele Lamanna,
xFrancesca Liguori,
yFrancesco Longobardi,
jDomenico Mallamace,
zPierluigi Mazzei,
aaIleana Menegazzo,
bbSalvatore Milone,
ccAdele Mucci,
ddClaudia Napoli,
lThelma
Pertinhez,
hAntonino Rizzuti,
aLuca Rocchigiani,
eeElisabetta Schievano,
bbFabio Sciubba,
pAnatoly
Sobolev,
ffLeonardo Tenori,
ggMariacristina Valerio
pa
) Dipartimento di Ingegneria Civile, Ambientale, del Territorio, Edile e di Chimica, Politecnico di Bari, via Orabona 4 CAMPUS, I-70125, Bari, Italy;
b
) SAMER (Special Agency of the Chamber of Commerce of Bari), via E. Mola 19, I-70121, Bari, Italy; c
) Innovative Solutions S.r.l. – Spin Off del Politecnico di Bari, zona H 150/B, I-70015, Noci (BA), Italy The complete list of the affiliations is reported in supporting information.
ABSTRACT: An inter-laboratory comparison (ILC) was organized with the aim to set up quality control indicators suitable for
multi component quantitative analysis by nuclear magnetic resonance (NMR) spectroscopy. 36 NMR data sets (corresponding to 1260 NMR spectra) were produced by 30 participants using 34 NMR spectrometers. The calibration line method was chosen for the quantification of a five-component model mixture. Results show that quantitative NMR is a robust quantification tool and that 26 out of 36 data sets resulted in statistically equivalent calibration lines for all considered NMR signals. The performance of each la-boratory was assessed by means of a new performance index (named Qp-score) which is related to the difference between the exper-imental and the consensus values of the slope of the calibration lines. Laboratories endowed with Qp-score falling within the suita-ble acceptability range are qualified to produce NMR spectra that can be considered statistically equivalent in terms of relative in-tensities of the signals. In addition, the specific response of nuclei to the experimental excitation/relaxation conditions was ad-dressed by means of the parameter named NR. NR is related to the difference between the theoretical and the consensus slopes of the calibration lines and is specific for each signal produced by a well-defined set of acquisition parameters.
Since the first successful experiments on the detection of nuclear resonance signals back in 1945-1946,1,2,3 Nuclear Magnetic Resonance (NMR) spectroscopy has become a powerful technique for investigating the finer properties of matter showing no sign of slackening even 70 years later. In the field of quantitative analytical chemistry, the use of NMR as quantification tool has become very common for many applications in both academic and industrial re-search such as pharmacy, food and materials science. Re-cently, the needs and advantages of using NMR spectros-copy as quantification tool have been exhaustively re-viewed by Bharti and Roy.4
NMR spectroscopy is considered a primary analytical technique due to the possibility to derive a full uncertainty budget by mathematical equations. As a consequence, NMR spectroscopy is enabled for quantitative determinations at the highest metrological level. The main feature making NMR a powerful technique in quantitative determinations concerns the direct proportionality existing between the
intensity of the NMR signal and the number of nuclei gen-erating the signal. Quantitative NMR does not need refer-ence standard molecules showing chemical structure simi-larity with the analyzed sample as conversely requested, for instance, in chromatographic methods. Quantification is typically obtained by integrating the signal of interest and scaling it to the peak area of a selected signal generat-ed by an arbitrary reference material, whose concentration is known. Notwithstanding these advantages, official qNMR methods are still rare,5 when compared to other an-alytical techniques officially recognized for quantification. The lack of official qNMR methods is a serious limitation for the exploitation of NMR potential in single component quantification analyses, and represents a critical problem when NMR potential is considered for multi-component and fingerprinting purposes. In fact, NMR spectroscopy is gaining ever growing popularity for the development of analytical approaches focusing on multi component untar-geted analyses.6-29 Among the many reasons for the gap 1 2 3 4 5 6 7 8 9 10 11 12 13 14 15 16 17 18 19 20 21 22 23 24 25 26 27 28 29 30 31 32 33 34 35 36 37 38 39 40 41 42 43 44 45 46 47 48 49 50 51 52 53 54 55 56 57 58 59 60
between the use of NMR and the use of other techniques for official purposes, high costs of NMR spectrometers and high limits of detection (LODs) are commonly invoked. However, the lack of reproducibility data for specific methods plays certainly also an important role in prevent-ing recognition of NMR measurements by institutions and certification bodies. This has to be probably ascribed to the fact that academic researchers are rarely involved in de-sign of formal standardization procedures.
Measurement uncertainty is typically evaluated by three models: one laboratory – one method (1L1M), many labor-atories – many methods (mLmM) and many laborlabor-atories – one method (mL1M). In the NMR community, the first limit model is the rule and several validation processes30 are available, demonstrating the suitability of NMR spectros-copy as quantification tool. For single component quantifi-cation, the mLmM limit model is required for a wide ac-ceptance of the quantification method. Such a model was followed in the first German and international inter-laboratory comparisons organized by the Federal Institute of Materials Research and Testing (BAM) in 1999.31 At that time, it was found that results differed enormously (up to 100 %) among the participating laboratories. The unac-ceptable result was attributed to the individual and inde-pendent setup of the measurements, the data processing and the evaluation procedure of each single laboratory. To overcome these drawbacks, approximately five years later, another inter-laboratory comparison was organized by Melz and Jancke using the mL1M model for uncertainty evaluation.31 The 33 participants used spectrometers working at 1H frequencies ranging from 200 to 600 MHz and adopted a common protocol for the experimental set-up and data processing. The NMR experiment considered for this second comparison consisted of a single 30° excita-tion pulse followed by a suitable relaxaexcita-tion delay. Data elaboration, valid for determination of mole ratios of each compound, turned out a measurement uncertainty of 1.5 % for a confidence level of 95% (k=2), thus demonstrating the importance of acquisition and processing protocols for accurate and precise quantitative NMR measurements. Moreover, it was demonstrated that precision could be im-proved when a single operator processed all NMR spectra. An interesting advantage of NMR technique deals with the possibility to suppress selectively one or more intense sig-nals with the consequent opportunity to enhance dramati-cally the signal to noise ratio of weak signals. Typidramati-cally, this kind of experiments allows to remove solvent signals thus reducing the manipulation of the samples and avoid-ing the use of large amounts of deuterated solvents. In rou-tine experiments, signal suppression can be simply ob-tained by implementing the pulse sequence with a pre-saturation scheme consisting of a low power radio fre-quency pulse able to saturate a specific resonance.
In principle, the introduction of the pre-saturation scheme should not affect the quantitative NMR measurements. The reproducibility of a single pulse experiment preceded by pre-saturation of the solvent signal has been evaluated by application of Principal Component Analysis (PCA) to 1H NMR data in the framework of two inter-laboratory com-parisons.32,33 PCA offers the advantage to estimate meas-urement reproducibility by easy visual inspection of the
scores plot, but quality control indexes to be used as
gen-eral reference parameters for quality assessment of NMR spectra are still lacking.
With the aim to set up new quality control parameters suitable for multi component quantitative NMR analysis as well as for NMR fingerprinting methods, we have orga-nized the first Italian inter-laboratory comparison accord-ing to the internationally agreed procedures ISO/IEC 17043:2010,34 which specifies general requirements for development and operation of proficiency testing schemes, and ISO/IEC 17025:2005,35 which specifies the general re-quirements for the competence to carry out tests and cali-brations performed using standard methods, non-standard methods, and laboratory-developed methods. The conven-tional statistical elaboration of data was carried out ac-cording to ISO 13528:200536 and ISO 5725, parts 1-6.37 The analytical target of the comparison was the quantifica-tion of analytes in a five-component model mixture by the calibration curve approach and using the mL1M model for uncertainty evaluation. Two different data elaborations were considered: the first one was carried out by a single operator who processed NMR spectra and developed cali-bration lines with signal areas as input data, without refer-encing to any standard molecule;38 the second one was characterized by the involvement of each participant in NMR spectra processing and signal area calculation. In the second elaboration, signal areas were scaled to a standard molecule and calibration lines were developed by a specif-ically designed web application.
In this paper, the comparison between results obtained by the two data elaborations are discussed in terms of coeffi-cient of variation. The performance assessment in the se-cond data elaboration was carried out by means of the pa-rameter (z-score) usually considered as performance in-dex in single component quantifications as well as by means of a new parameter, named Qp-score, better suited for performance assessment in multi-component and fin-gerprinting analyses. Moreover, a third index (NR), specific for each NMR signal, was introduced to gain insights into the possible effects of the acquisition parameters on signal intensities.
EXPERIMENTAL SECTION Materials
MaterialsMaterials
Materials. 2-Methyl-2-(methylthio)propanal-O-(N-methylcarbamoyl)oxime (Aldicarb, CAS. N. 116-06-3, neat purity 99.9%, Sigma Aldrich, Milan, Italy), 2-methoxy-N-(2-oxo-1,3-oxazolidin-3-yl)-acet-2',6'-xylidide (Oxadixyl, CAS. N. 77732-09-3, neat purity 99.9%, Sigma Aldrich, Mi-lan, Italy), O,S-dimethylphosphoramidothioate (Methamidophos, CAS. N. 102658-92-6, neat purity 98.5%, Sigma Aldrich, Milan, Italy), (2-dimethylamino-5,6-dimethylpyrimidin-4-yl)-N,N-dimethylcarbamate (Pirimi-carb, CAS. N. 23103-98-2, neat purity 99.0%, Sigma Al-drich, Milan, Italy), 3-(trimethylsilyl)-2,2,3,3-tetradeutero-propionic acid sodium salt (TSP, CAS. N. 24493-21-8, 99 %D, Armar Chemicals, Döttingen, Switzerland), deuterium oxide (D2O, CAS. N. 7789-20-0, 99.86 %D, Sigma Aldrich, Milan, Italy) were used for sample preparation. Chemical structures of compounds are reported in Chart 1.
Sample prepara Sample preparaSample prepara
Sample preparationtiontiontion. Standard and test mixtures were pre-pared under thermic and hygrometric control (20 ± 5 °C, 40-60 R.H.%) by gravimetric method using a certified ana-1 2 3 4 5 6 7 8 9 10 11 12 13 14 15 16 17 18 19 20 21 22 23 24 25 26 27 28 29 30 31 32 33 34 35 36 37 38 39 40 41 42 43 44 45 46 47 48 49 50 51 52 53 54 55 56 57 58 59
lytical balance KERN ABT 100-5M (KERN & Sohn GmbH, Balingen, Germany) with weighing range 1÷101.000 mg, readability 0.01 mg and reproducibility 0.05 mg. The bal-ance was periodically calibrated by certified test weight set KERN DKD-K-11801, 11-06, s/n G0703552. Uncertainty for each analyte mass was calculated taking into account uncertainty parameters of the balance. A factor k = 2, cor-responding to a confidence level of 95 %, was considered to determine extended uncertainties.
A solution made up of TSP in D2O (20.33 ± 0.29 mg/L) was used to prepare six standard (labelled as A-E and Blank) and one test (labelled as X) mixtures at the levels listed in Table S1 (in the range 0÷500 mg/L). Standard mixtures were used to obtain the calibration curves considered to determine the concentration values of the test mixture X. Mixtures were prepared by diluting stock solutions to the desired concentration using class A glassware. NMR tubes were filled in with 1.0 mL of the solution.
Experimental procedures Experimental procedures Experimental procedures
Experimental procedures. Nine NMR signals were selected for this study: three for Aldicarb (A1, A2 and A3), one for Methamidophos (M1), two for Oxadixyl (O1 and O2), two for Pirimicarb (P1 and P2) and the singlet of TSP which was taken as reference. A typical 1H NMR spectrum of the mixture is reported in Figure S1 and the integration ranges used for calculation of the peak areas are listed in Table S2. In order to choose the optimal recycle delay, T1 values were determined taking into proper account all signals listed in Table S2. T1 determination was carried out by in-version recovery experiments applied to single component solutions (analyte in D2O) at two different magnetic fields, 9.4 T (400 MHz) and 16.5 T (700 MHz), and two concen-tration levels, ca. 37 mg/L and ca. 600 mg/L. The highest T1 value (5.4 s, measured for M1 signal of a 37.4 mg/L so-lution of Methamidophos at 9.4 T) was taken into account to set recycle delay to 30 s. D2O was not degassed before preparation of the solutions. Single component solutions and test mixtures were prepared in the same laboratory using the same batch of D2O. NMR tubes were filled with 0.5 mL solution, sealed and delivered to participants. Data acquisition and processing
Data acquisition and processing Data acquisition and processing
Data acquisition and processing. . . . The NMR experiment con-sidered for the inter-laboratory comparison consisted of a single 90° excitation pulse preceded by a selective pre-saturation step. Even though it was organized before the publication of the EUROLAB technical report on NMR method development and validation,39 this work resulted coherent with guidelines described therein. For each NMR tube, 5 spectra were recorded to comply with conditions for repeatability (measurements performed under the same operating conditions over a short period of time) considering the same NMR tube, same spectrometer, same user, consecutive runs without removing NMR tube from the magnet and to comply with conditions for intermediate precision (measurements performed under repeatability condition devoid of only one obligation) considering the same NMR tube, same spectrometer, same user, at least 24 h delay between runs, removal of the NMR tube from the magnet from run to run. Summarizing, each participant recorded 35 NMR spectra (5 replicates for each of the 7 NMR tubes) in three different sessions: i) 3 consecutive runs per NMR tube (run 1, run 2 and run 3); ii) 1 run per NMR tube delayed at least 24 h from the first session (run
4); iii) 1 run per NMR tube delayed at least 24 h from the second session (run 5). It has been demonstrated38 that results obtained in repeatability conditions (considering only data obtained by runs 1-3), in intermediate precision conditions (considering only data obtained by runs 1, 4 and 5) and both conditions (considering data obtained by runs 1-5) can be safely considered as substantially equiva-lent. In the present paper, calculation on all available repli-cates (runs 1-5) will be described. More details on NMR data acquisition and processing are reported in Supporting Information.
Statistical elaboration Statistical elaborationStatistical elaboration
Statistical elaboration. Signal integrals were scaled to TSP integral and the corresponding (Isignal/ITSP) values were up-loaded on a web application specifically designed and vali-dated for data elaboration in agreement with internation-ally accepted requirements.35,36,37 (Isignal/ITSP) values were uploaded reporting at least four decimal places. The five (Isignal/ITSP) replicates collected for each signal and for each NMR tube were submitted to Shapiro-Wilk test to ascertain their normal distribution and to Huber, Dixon and Grubbs tests for identification of possible outliers. Throughout the paper, Grubbs tests refer to application of both the classi-cal Grubbs test identifying one outlier and the double Grubbs test which enables the identification of two outli-ers. Data identified as outliers by all the four tests were not considered in successive steps. Data derived from standard mixtures A-E and Blank were used to plot (Isignal/ITSP) ver-sus analyte concentrations and to develop an equation for the calibration line by least square linear regression. The equation of general formula y=a∙x+b (with y=(Isignal/ITSP) and x = concentration as mg/L) was used to calculate con-centration values of analytes in test mixture X. Then, the 5 concentration values calculated for the test mixture X were submitted to Shapiro-Wilk test to ascertain their normal distribution and to Huber, Dixon and Grubbs tests for iden-tification of possible outliers. After removing outliers, cal-culated concentrations were used to determine the mean concentration values and the corresponding standard de-viations which were considered as intra-laboratory uncer-tainties of the method. Results from all participants (36 sets of results from 34 NMR spectrometers) were submit-ted to data elaboration for proficiency test and for deter-mination of the assigned values for analytes in mixture X. The lack of official qNMR analyses for this case study prompted us to determine assigned values as consensus values from participants.34 Thus, for each analyte, accord-ing to the flow chart suggested by Horwitz,40 the 36 stand-ard deviation values were submitted to Cochran test (pro-vided that all of the 5 replicates of mixture X successfully passed the above mentioned tests for outliers) with the aim to identify and remove outliers for successive calcula-tions. In turn, mean concentration values from data sets which passed successfully the Cochran test were submit-ted to Grubbs tests with the aim to further refine the quali-ty of the results. The remaining sets of data were submit-ted to Shapiro-Wilk test to ascertain the normal distribu-tion of the populadistribu-tion (data were always normal distribut-ed after refinement by Cochran and Grubbs tests) and were used to calculate, for each analyte in test mixture X, the assigned concentration value, the inter-laboratory standard deviation, the coefficient of variation (CV%) and the reproducibility limits.
1 2 3 4 5 6 7 8 9 10 11 12 13 14 15 16 17 18 19 20 21 22 23 24 25 26 27 28 29 30 31 32 33 34 35 36 37 38 39 40 41 42 43 44 45 46 47 48 49 50 51 52 53 54 55 56 57 58 59 60
RESULTS AND DISCUSSION Performance assessment for sin Performance assessment for sinPerformance assessment for sin
Performance assessment for single component quantitative gle component quantitative gle component quantitative gle component quantitative NMR measurements
NMR measurementsNMR measurements
NMR measurements. Among the quantification approaches available for NMR spectroscopy,4 the calibration line method was chosen in this work as it allows for identifica-tion of a theoretical line to be taken as reference in per-formance assessment. Moreover, this method has a general applicability in analytical chemistry and has the advantage to nullify the effects of nuclei relaxation on quantitative accuracy, provided that all the acquisition parameters are kept constant for standard and test solutions.4 Thus, it is expected that systematic errors deriving from hardware features or from the set of acquisition parameters should be minimized.
A first statistical data elaboration of the ILC was carried out by a single operator who processed NMR spectra (Fou-rier transformation, phase and baseline correction, signal integration) and obtained calibration lines with no scaled signal areas as input data.38 In a second data elaboration, NMR data processing was carried out by each participant and signal areas were scaled to TSP area. Therefore, the main difference between the two elaboration approaches relays on different processing conditions. Results of both elaborations are summarized in Table S3 where assigned concentration values along with the corresponding stand-ard deviations, coefficients of variation and reproducibility limits are reported. It is apparent that changing the pro-cessing conditions of the NMR spectra, from “one operator – all NMR data sets” to “one operator – one NMR data set”, has a little impact on the final result in terms of mean val-ue. Conversely, standard deviations (and consequently the related coefficients of variation and reproducibility limits) are affected by the different NMR processing conditions. Notwithstanding the deterioration of their quality in terms of coefficient of variation (CV%), these results are quite satisfactory if this test is considered as a confirmatory method for organic residues and contaminants. Indeed, ac-cording to the European Commission decision concerning the performance of analytical methods and the interpreta-tion of results,41 the inter-laboratory coefficient of varia-tion (CV%) for repeated analysis of a reference material, under reproducibility conditions, shall not exceed 5.7% for concentration values higher than 1000 ppm, according to Horwitz equation:
CV% = 2(1 – 0,5·logC)
where C is the mass fraction expressed as a power of 10 (e.g. 1 mg/g = 10–3). Being the concentration values con-sidered in this work lower than 500 mg/L, the highest ob-tained CV% value of 4.9 % indicates that single excitation pulse preceded by selective pre-saturation of the solvent is a reliable NMR experiment for quantification purposes. Once determined the assigned values for all the analytes, performance statistics was carried out with the aim to es-timate the deviation of the mean concentration values from the assigned value for each participant, including those producing data sets rejected by Cochran and Grubbs tests. A commonly used parameter estimating the perfor-mance for quantitative results is z-score, which is defined as:
z=Ciσ -C
where Ci is the mean concentration value determined by the i-th data set, ͞C is the assigned concentration value and σ is the inter-laboratory standard error, all referred to a single NMR signal. Satisfactory performance is indicated by |z|≤2.0, questionable performance is obtained when 2.0<|z|<3.0 while |z|≥3.0 indicates unsatisfactory per-formance. In the latter case, suitable actions are required to identify and to solve the analytical problems.
Figure 1 shows the z-scores of Aldicarb quantification by NMR A1 singlet. It is apparent that, even though results of 10 participants were excluded from calculation of the as-signed value, the quality of the result was satisfactory for 35 sets of NMR data and only 1 unsatisfactory performance was registered. Very similar results were obtained using each of all other NMR signals (Supporting information, Figures S2-S8). High performance quantifications are ob-tained also when signals different from singlets were taken into account (as in case of M1 and O2 where a doublet and a group of signals were considered, respectively). It is worth noting that performance in terms of result quality was not affected by the magnetic field, hardware configu-ration, manufacturer and production year of the spectrom-eter. These findings highlight the robustness of NMR spec-troscopy when calibration curve approaches are adopted.
Figure 1. z-score for quantification of Aldicarb by means of A1 signal (Green: |z|≤2.0; Yellow: 2.0<|z|<3.0; Red:|z|≥3.0.; assigned concentration value: 94.57 [mg/L]; inter-laboratory standard devi-ation: 3.64; reproducibility limit: 12.46; CV%: 3.8%).
Z-score represents a satisfactory indicator for performance assessment in single component analyses, but it cannot ac-count for performance assessment in multi-component analyses because a single z-score refers to only a single quantification measurement. Thus, for performance as-sessment in fingerprinting measurements and quantitative multi-component analyses the introduction of indicators more appropriate than z-score is desirable.
Basics of quantitative NMR Basics of quantitative NMRBasics of quantitative NMR
Basics of quantitative NMR. Before discussing the new quality control parameters proposed by us in performance assessment for fingerprinting measurements and quantita-tive multi-component analyses, recall of the basic equation of quantitative NMR is advisable (Equation 1).
I=k∙n Equation 1 1 2 3 4 5 6 7 8 9 10 11 12 13 14 15 16 17 18 19 20 21 22 23 24 25 26 27 28 29 30 31 32 33 34 35 36 37 38 39 40 41 42 43 44 45 46 47 48 49 50 51 52 53 54 55 56 57 58 59
Equation 1 provides the direct proportionality between the number of moles (n) of nuclei generating a signal and the intensity (I) of the same signal with a proportionality constant k being the spectrometer constant which remains the same for all resonances in a NMR spectrum.4
Let us consider, in a NMR spectrum, the signal (a) having intensity Ia generated by specific protons belonging to the analyte of interest and the signal (r) having intensity Ir generated by specific protons in a reference compound. Applying equation 1 to Ia and Ir gives:
Ia=k∙na Ir=k∙nr Hence the ratio Z[\
[]^ = Z _\
_]^ (Equation 2) is independent from the proportionality constant k and, as a consequence, it does not depend on the spectrometer. Thus, taking the methyl protons signal of TSP as reference signal, all of the calibration lines obtained plotting (Ia/ITSP) versus analyte concentration (C) should be independent from the spec-trometer and statistically equivalent to each other. In other words, all the participants to an ILC should develop equivalent calibration lines
ZIa
ITSP^ =a∙C+b Equation 3
where intercept b should have a null value due to the fact that no signal is generated if no nuclei (C=0 mg/L) are contained in the mixture. Thus, Equation 3 can be rewrit-ten as `IIa TSPa = ` na nTSPa = b manalyte Manalyte∙Na mTSP MTSP∙NTSP c =a∙C=a∙manalyteV Equation 4
where manalyte is the mass of the analyte, mTSP is the mass of TSP, Manalyte is the molar mass of the analyte, MTSP is the molar mass of TSP, Na is the number of protons generating the signal (a), NTSP is the number of methyl protons (nine) generating the reference signal, and V the solution volume. Equation 4 can be rearranged into:
d manalyte Manalyte∙Na mTSP MTSP∙NTSPe =a∙ manalyte V Equation 5
From equation 5 the theoretical value that slope must as-sume for a given TSP concentration can be extracted:
atheoretical=MMTSP analyte∙ Na NTSP∙ V mTSP= MTSP Manalyte∙ Na 9 ∙CTSP1 Equation 6
The need to harmonize NMR protocols prompted us to propose a new parameter suited for checking the equiva-lence of the calibration lines. Such a parameter will be shown to represent a quality control index of the NMR spectra to use in fingerprinting applications and multi component NMR quantifications.
Quality control parameters for performance assessment in Quality control parameters for performance assessment in Quality control parameters for performance assessment in Quality control parameters for performance assessment in fingerprinting measurements and quantitative multi fingerprinting measurements and quantitative multi fingerprinting measurements and quantitative multi fingerprinting measurements and quantitative multi----component analyses
component analyses component analyses
component analyses. In order to assess the laboratory per-formance in multi-component analyses without consider-ing as many z-scores as the number of analytes, we pro-pose a new parameter, named Qp-score, accounting for
participant performance as the result of instrumental ade-quacy and operator skill. Knowing that, for each signal, cal-ibration lines developed by each participant must be equivalent each other, let us define the indicator of the line equivalence Qp as:
Qp=σaslopei-a Equation 7
where ai is the slope of the calibration line determined by the i-th participant, ͞a is the consensus slope value and σslope is the inter-laboratory standard deviation on slopes, all re-ferred to a single NMR signal. ͞The values ͞a and σslope are de-termined using ai successfully passing the Huber test. By an analogous reasoning followed for z-score, performance assessment by Qp-score is considered satisfactory when |Qp|≤2.0, questionable when 2.0<|Qp|<3.0 and unsatisfac-tory when |Qp|≥3.0.
In the case study of Aldicarb quantification by NMR signal A1, Huber tests applied to the 36 slope values gave 11 out-liers, the 5 lowest and the 6 highest values. The 25 remain-ing values resulted normal distributed after Shapiro-Wilk test and were considered for calculation of ͞a and σslope. The values of ͞a and σslope were 0.0340 [L/mg] and 0.0032 [L/mg], respectively.
Concerning the experimental intercept values, the popula-tion was not normal and was too scattered so that iterated Huber test gave meaningless results (all values were iden-tified as outliers). The mean value of the intercept was – 0.048 and the related standard deviation was 0.513 indi-cating that the null value can be well considered as exper-imental intercept.
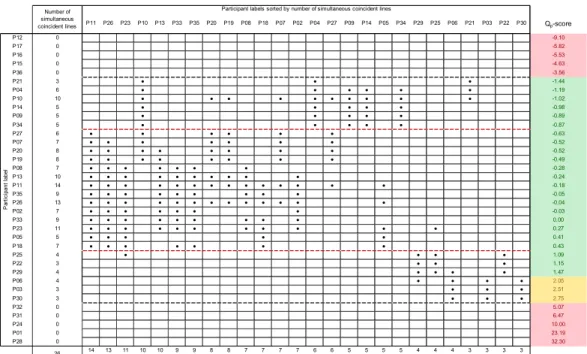
These results give y=0.0340∙x as consensus equation for the calibration line, but do not yet demonstrate the statis-tical equivalence of the calibration lines. In order to evalu-ate the statistical parallelism, and then the equivalence of the calibration lines, all possible slope pairs were submit-ted to the paired t-test with 95% confidence level. Compu-tational part of the test consists of calculation of parameter tslopes as the difference between two slopes divided by the standard error of the difference between the same two slopes.42 Then, tslopes was compared with Student’s t at the desired confidence level (95%) to evaluate whether the null hypothesis was supported, that is whether no rela-tionship between two data sets existed. If the slope ob-tained by one data population is significantly different from that generated with another (and independent) data set, then tslopes > t, else tslopes ≤ t and the two slopes can be considered statistically equivalent. Results of the paired t-tests applied to all possible slope pairs are summarized in Figure 2 where statistically equivalent lines are cross linked by black circles. For instance, participant P11 duced a calibration line which is equivalent to those pro-duced by participants P27, P07, P20, P19, P08, P13, P35, P26, P02, P33, P23, P05 and P18.
It is apparent from Figure 2 that the slopes of 26 calibra-tion lines (bordered by black dashed lines) are statistically equivalent. Of these 26 lines, 23 were characterized by |Qp| lower than 2, i.e. in the range of satisfactory performance assessment. Moreover, with the exception of participant P10, the highest number of simultaneous coincidences (7 to 14) was recorded for participants endowed with very 1 2 3 4 5 6 7 8 9 10 11 12 13 14 15 16 17 18 19 20 21 22 23 24 25 26 27 28 29 30 31 32 33 34 35 36 37 38 39 40 41 42 43 44 45 46 47 48 49 50 51 52 53 54 55 56 57 58 59 60
low Qp-scores (ranging from –0.63 to 0.43, bordered by red dashed lines in Figure 2).
The statistical equivalence of the calibration lines is in agreement with the theoretical treatment described above. It represents the experimental evidence that, for a given TSP concentration, slopes assume a certain value depend-ing on the signal and not on the spectrometer constants. Once defined the concentration range of the analytes, slopes associated to satisfactory Qp-scores indicate that the corresponding NMR spectra were recorded and processed under similar conditions. Deviation from the consensus value of the slope is explained in terms of hardware relia-bility, acquisition and processing parameters. Therefore, Qp-score represents a quality control index which accounts for hardware functioning conditions and operator skills. It is important to point out that questionable and unsatisfac-tory Qp-scores did not prevent successful single compo-nent quantifications as the latter depend only on the quali-ty of the calibration line. Indeed, good fitting in the linear regression allows for a good performance in terms of z-score but it does not account for deviation of the slope from its theoretical value.
Figure 2. Results of the paired t-test for statistical equivalence of pairs of calibration lines and laboratory Qp-scores (referred to the A1
signal). Equivalent lines are cross linked by the black circle ●; Green: |Qp|≤2.0; Yellow: 2.0<|Qp|<3.0; Red:|Qp|≥3.0 Given that Qp-score is a quality parameter of the NMR
spectrum as a whole, it can be expected that, as far as mul-ticomponent analysis is concerned, Qp-score based per-formance assessment of a laboratory should be almost in-dependent from the considered signal. This is indeed the case, as clearly demonstrated by inspection of Figure 3, where Qp-scores obtained by each participant by consider-ing each of the NMR signals selected for this study are re-ported. Apart from the variations of the Qp-scores falling in the proximity of the limiting value ±2, the performance category (|Qp|≤2.0, 2.0<|Qp|<3.0 and |Qp|≥3.0) is retained for all considered signals. These findings are in good
agreement with the high reproducibility of 1H NMR exper-iments evaluated by PCA in previous studies.32,33
The introduction of Qp-score paves the way to validation of multi component quantification methods, of great im-portance for fingerprinting and profiling applications. In fact, such validation procedures might be carried out in the future by an inter-laboratory comparison where laborato-ry performance could be preliminarily assessed developing calibration lines for any arbitrary compound mixture. Once fixed a Qp acceptability range (for instance, |Qp|<1), all la-boratories within such range will be qualified to produce NMR spectra of a given mixture that are statistically equiv-alent in terms of relative intensities of the signals. In other
P11 P26 P23 P10 P13 P33 P35 P20 P19 P08 P18 P07 P02 P04 P27 P09 P14 P05 P34 P29 P25 P06 P21 P03 P22 P30 Qp-score P12 0 -9.10 P17 0 -5.82 P16 0 -5.53 P15 0 -4.63 P36 0 -3.56 P21 3 ● ● ● -1.44 P04 6 ● ● ● ● ● ● -1.19 P10 10 ● ● ● ● ● ● ● ● ● ● -1.02 P14 5 ● ● ● ● ● -0.98 P09 5 ● ● ● ● ● -0.89 P34 5 ● ● ● ● ● -0.87 P27 6 ● ● ● ● ● ● -0.63 P07 7 ● ● ● ● ● ● ● -0.52 P20 8 ● ● ● ● ● ● ● ● -0.52 P19 8 ● ● ● ● ● ● ● ● -0.49 P08 7 ● ● ● ● ● ● ● -0.28 P13 10 ● ● ● ● ● ● ● ● ● ● -0.24 P11 14 ● ● ● ● ● ● ● ● ● ● ● ● ● ● -0.18 P35 9 ● ● ● ● ● ● ● ● ● -0.05 P26 13 ● ● ● ● ● ● ● ● ● ● ● ● ● -0.04 P02 7 ● ● ● ● ● ● ● -0.03 P33 9 ● ● ● ● ● ● ● ● ● 0.00 P23 11 ● ● ● ● ● ● ● ● ● ● ● 0.27 P05 5 ● ● ● ● ● 0.41 P18 7 ● ● ● ● ● ● ● 0.43 P25 4 ● ● ● ● 1.09 P22 3 ● ● ● 1.15 P29 4 ● ● ● ● 1.47 P06 4 ● ● ● ● 2.05 P03 3 ● ● ● 2.51 P30 3 ● ● ● 2.75 P32 0 5.07 P31 0 6.47 P24 0 10.00 P01 0 23.19 P28 0 32.30 14 13 11 10 10 9 9 8 8 7 7 7 7 6 6 5 5 5 5 4 4 4 3 3 3 3
Participant labels sorted by number of simultaneous coincident lines
P a rt ic ip a n t la b e l
Number of simultaneous coincident lines Number of simultaneous coincident lines 26 1 2 3 4 5 6 7 8 9 10 11 12 13 14 15 16 17 18 19 20 21 22 23 24 25 26 27 28 29 30 31 32 33 34 35 36 37 38 39 40 41 42 43 44 45 46 47 48 49 50 51 52 53 54 55 56 57 58 59
words, for a given set of acquisition parameters, laborato-ries gaining satisfactory Qp-scores will be accredited to record NMR spectra on every kind of mixture, thus allow-ing for poolallow-ing of NMR data in suitable databanks.
Figure 3. Qp-scores for all NMR signals as labeled in Table S2. Green: |Qp|≤2.0; Yellow: 2.0<|Qp|<3.0; Red:|Qp|≥3.0 It is worth noting that, in real experiments, a deviation
from theoretical slope is expected due to the specific re-sponse of the nuclei to the experienced excita-tion/relaxation conditions during spectrum acquisition. Such a response depends on several factors including: i) hard excitation pulse which must be uniform throughout all the spectral width; ii) proximity of the signals to the off-sets; iii) recycle delay, which must be long enough to allow for complete magnetization recovery of all nuclei; iv) ener-gy exchange effects (NOE, spin diffusion, etc.) introduced by soft pulses. Therefore, in any inter-laboratory compari-son the consensus slope may differ from the theoretical one as an effect of the specific set of acquisition parame-ters.
In order to gain insights into the effects of the experi-mental excitation/relaxation conditions on the nuclei re-sponse, we introduce a new indicator as the relative devia-tion of the consensus slope from theoretical value, accord-ing to equation 8.
NR=atheoretical-a
atheoretical ∙100 Equation 8 NR calculated for all signals considered in this study are reported in Table 1.
NR values for the various signals ranged from –18.2% to 6.2% indicating that signals are not affected to the same extent by the used acquisition parameters. Moreover, NR
values were different also for signals generated by in-equivalent nuclei in the same molecule.
Table Table Table
Table 1111. . . . NR values (%) calculated NR values (%) calculated NR values (%) calculated for all NMR signals as lNR values (%) calculated for all NMR signals as lfor all NMR signals as la-for all NMR signals as la-a- a-beled in Table
beled in Table beled in Table
beled in Table SSSS2. 2. M2. 2. MMMTSPTSPTSPTSP = 172.27 [g/mol]; N= 172.27 [g/mol]; N= 172.27 [g/mol]; N= 172.27 [g/mol]; NTSP TSP TSP TSP = 9; C= 9; C= 9; C= 9; CTSPTSPTSPTSP = = = = 20.33 [mg/L]. 20.33 [mg/L].20.33 [mg/L]. 20.33 [mg/L]. Signal SignalSignal Signal A1A1A1 A1 A2A2 A2A2 A3A3A3A3 M1M1 M1M1 O1O1O1O1 O2O2 O2O2 P1P1P1P1 P2P2 P2P2 Manalyte [g/mol] 190 190 190 141 278 278 238 238 Na 6 3 1 3 3 3 3 3 atheoretical ×102 [L/mg] 2.97 1.48 0.49 2.00 1.01 1.01 1.19 1.19 a ×102 [L/mg] 3.40 1.72 0.54 1.95 0.95 1.20 1.39 1.38 NR [%] –14.6 –15.7 –9.3 2.4 6.2 –18.2 –17.0 –16.7 In the present case, NR represents an index of the response of the nuclei submitted to a NMR experiment characterized by a single 90° excitation pulse preceded by a selective pre-saturation step with the specific set of acquisition pa-rameters. In our opinion, among the above-mentioned fac-tors affecting the nuclei response, energy exchange effects
A1 A2 A3 M1 O1 O2 P1 P2 Participant label P12 -9.10 -8.07 -6.46 -6.62 -8.55 -6.67 -6.59 -6.68 P17 -5.82 -5.29 -4.03 -4.21 -5.50 -4.29 -4.29 -4.19 P16 -5.53 -4.90 -4.08 -4.07 -5.35 -4.18 -4.01 -4.00 P15 -4.63 -4.12 -3.25 -3.34 -4.33 -3.33 -3.31 -3.32 P36 -3.56 -3.20 -2.67 -2.60 -3.39 -2.83 -2.56 -2.58 P21 -1.44 -1.34 -1.11 0.22 -0.68 0.78 -1.21 -1.01 P04 -1.19 -1.11 -0.84 -0.82 -1.20 -0.96 -0.82 -0.82 P10 -1.02 -0.99 -0.71 -0.71 -1.04 -0.78 -0.72 -0.68 P14 -0.98 -1.00 -0.96 -0.86 -0.89 -0.66 -1.05 -1.03 P09 -0.89 -0.96 -0.84 -0.71 -0.86 -0.73 -0.75 -0.74 P34 -0.87 -0.91 -0.77 -0.58 -1.04 -0.75 -0.49 -0.83 P27 -0.63 -0.62 -0.42 -0.36 -0.71 -0.47 -0.29 -0.60 P07 -0.52 -0.65 -0.39 -0.29 -0.48 -0.39 -0.35 -0.31 P20 -0.52 -0.50 -0.37 -0.48 -0.59 -0.46 -0.30 -0.25 P19 -0.49 -0.55 -0.32 -0.29 -0.67 -0.39 -0.29 -0.14 P08 -0.28 -0.39 -0.20 -0.06 -0.34 -0.23 -0.18 -0.01 P13 -0.24 -0.37 -0.13 -0.07 -0.25 -0.19 -0.14 0.01 P11 -0.18 -0.22 1.03 -0.72 -1.13 -0.90 -0.46 -0.82 P35 -0.05 -0.26 0.21 -0.04 -0.03 -0.20 -0.10 0.08 P26 -0.04 -0.23 -0.10 -1.28 -0.06 0.41 -0.38 -0.25 P02 -0.03 -0.15 -0.31 0.13 0.16 -0.45 0.10 0.01 P33 0.00 0.06 -0.22 -0.03 0.15 -0.05 0.14 -0.01 P23 0.27 0.54 0.65 0.11 -0.07 0.86 0.50 0.59 P05 0.41 0.22 0.33 0.44 0.17 0.21 0.32 0.54 P18 0.43 0.40 0.22 0.49 0.50 0.44 0.47 0.62 P25 1.09 0.80 0.77 0.83 0.75 0.71 0.86 1.04 P22 1.15 0.80 0.77 0.99 0.83 0.84 1.02 0.80 P29 1.47 1.20 1.08 1.14 1.16 0.97 1.12 1.01 P06 2.05 1.86 1.63 1.56 1.80 1.53 1.59 1.53 P03 2.51 2.08 1.72 1.85 2.15 1.68 1.90 1.74 P30 2.75 2.32 1.96 2.13 2.38 1.99 2.08 2.11 P32 5.07 4.28 3.56 3.83 4.49 3.68 3.82 3.73 P31 6.47 5.54 4.62 4.91 5.82 4.77 4.88 4.76 P24 10.00 8.62 7.08 7.52 9.27 7.27 7.50 7.43 P01 23.19 20.03 16.33 15.56 20.26 16.45 16.51 16.56 P28 32.30 28.19 22.62 22.61 28.75 23.11 23.21 23.35 Signal 1 2 3 4 5 6 7 8 9 10 11 12 13 14 15 16 17 18 19 20 21 22 23 24 25 26 27 28 29 30 31 32 33 34 35 36 37 38 39 40 41 42 43 44 45 46 47 48 49 50 51 52 53 54 55 56 57 58 59 60
introduced by soft pulses can be considered the most rele-vant to interpret the NR values obtained in the present study. Energy exchange effects are certainly operative in the acquisition condition characterized by a selective pulse acting during the long recycle delay (30 s). The other fac-tors are thought to affect NR values only marginally be-cause possible incorrect setting of the pulses (factors i and
ii) will give random contributions averaged to almost null deviation of the calibration line and because the adopted recycle delay (longer than 5 times the highest measured T1) ensures complete recovery of the magnetization (fac-tor iii). Anyway, a deeper study on factors affecting the nu-clei response to experimental acquisition conditions to give the NR values reported in Table 1 requires further NMR experiments. This is out of the scope of the present paper.
CONCLUSION
This study introduces a new quality control parameter, Qp -score, suitable for harmonization of fingerprinting proto-cols and quantitative multi component analysis. Such pa-rameter, that was designed considering consolidated in-ternationally agreed statistics, represents an unbiased evaluation tools for NMR method validations.
Qp-score accounts for laboratory performance in terms of both instrumental adequacy and operator skill and enables laboratories to pooling of NMR data in suitable databanks. Moreover, Qp can be valuable for the development of multi-laboratory metabolomic platforms. In fact, it was shown that participants having Qp-score in a suitable acceptability range are able to produce NMR spectra of a given mixture that can be considered statistically equivalent in terms of relative intensities of the signals. Another practical use of Qp-score consists of the entitlement of laboratories en-dowed with acceptable |Qp| values to carry out quantifica-tions by using relative intensity of the signal of interest af-ter fitting with the consensus calibration line deriving from the inter-laboratory comparison. For instance, in suitable networking conditions, equivalent calibration lines could be shared to enable different laboratories to carry out quantitative analyses without wasting time in calibration steps, with a consequent increase of productivity.
Since basic equations of quantitative NMR are independent from the type of solvent, it can be expected that perfor-mance assessment by Qp-score applies also to experiments carried out in solvents others than D2O (for instance, in or-ganic solvents such as CDCl3 widely used in lipidomics and in complex mixtures such as biofluids which are mostly used in their native state).
Another parameter, NR, has been proposed, which is relat-ed to differences between the theoretical and the consen-sus slopes of the calibration lines and which is specific for each signal produced by a well-defined set of acquisition parameters. For a given molecule in a defined solvent, NR represents an index of the specific response of the various nuclei submitted to a definite NMR experiment.
AUTHOR INFORMATION
Corresponding Author
* [email protected]; Phone: +39 0805963607; Fax: +39 0805963611
Author Contributions
The manuscript was written through contributions of all authors. All authors have given approval to the final version of the manu-script.
Notes
The authors declare no competing financial interest.
ACKNOWLEDGMENT
This work was carried out with voluntary contribution of all par-ticipants under the hint of the Chamber of Commerce of Bari. Alessandro Ambrosi (President of the Chamber of Commerce of Bari), Angela Patrizia Partipilo (Secretary General of the Cham-ber of Commerce of Bari), Piero Pontrelli (Director of SAMER), Umberto Bucci and Giuseppe Margiotta (President and Vice Pres-ident of SAMER, respectively) are gratefully acknowledged for financial support in organization of promotion events.
GIDRM (Gruppo Italiano di Discussione sulle Risonanze Magnetiche) and GIRM (Gruppo Interdivisionale di Risonanze Magnetiche della Società Chimica Italiana) are also acknowledged.
The complete list of acknowledged persons is reported in Support-ing information.
Supporting Information Available
This information is available free of charge via the Internet at
http://pubs.acs.org/
REFERENCES
(1) Purcell, E. M.; Torrey, H. C.; Pound R. V. Phys. Rev. 1946, 69, 37-38.
(2) Bloch, F.; Hansen, W. W.; Packard, M. Phys. Rev. 1946, 69, 127-127.
(3) Bloch, F.; Hansen, W. W.; Packard, M. Phys. Rev. 1946, 70, 474-485.
(4) Bharti, S. K.; Roy, R. Trends Anal. Chem. 2012, 35, 5-26. (5) For Site-Specific Natural Isotope Fractionation (SNIF-NMR) see: a) method OIV-MA-AS311-05; b) AOAC Official method 995.17; c) AOAC Official method 2006.05; d) AOAC Official Meth-od 2000.19; for solid fat content determination see: e) AOCS Official Method Cd 16b-93; f) AOCS Official Method Cd 16-81; for moisture and fat in meats see: g) AOAC Official Method 2008.06.
(6) Del Coco, L.; Assfalg, M.; D’Onofrio, M.; Sallustio, F.; Pesce, F.; Fanizzi, F. P.; Schena, F. P. Metabolomics 2013, 9, 740-751.
(7) Napoli, C.; Sperandio, N.; Lawlor, R. T.; Scarpa, A.; Molinari, H.; Assfalg, M. J. Proteome Res. 2012, 11, 1274-1283.
(8) Assfalg, M.; Bortoletti, E.; D’Onofrio, M.; Pigozzi, R.; Molinari, H.; Boner, A. L.; Peroni, D.G.; Piacentini, G.L. Brit. J. Derm. 2012, 166, 1123-1125.
(9) Mucci, A.; Parenti, F.; Righi, V.; Schenetti, L. Food Chem. 2013, 141, 3167–3176.
(10) Pertinhez, T.A.; Casali, E.; Lindner, L.; Spisni, A.; Baricchi, R.; Berni, P. Blood Transfus. 2014, 12, 548-556.
(11) Tomassini, A.; Vitalone, A.; Marini, F.; Praticò, G.; Sciubba, F.; Bevilacqua, M.; Delfini, M.; Di Sotto, A.; Di Giacomo, S.; Mariani, P.; Mammola, C. L.; Gaudio, E.; Miccheli, A.; Mazzanti, G. J. Proteome Res. 2014, 13, 5848-5859.
(12) Brasili, E.; Praticò, G.; Marini, F.; Valletta, A.; Capuani, G.; Sciubba, F.; Miccheli, A.; Pasqua, G. Metabolomics 2014, 10, 1186-1196.
(13) Calvani, R.; Brasili, E.; Praticò, G.; Sciubba, F.; Roselli, M.; Finamore, A.; Marini, F.; Marzetti, E.; Miccheli, A. J. Clin. Gastroenterol. 2014, 48, S5-S7.
(14) Sciubba, F.; Capuani, G.; Di Cocco, M. E.; Avanzato, D.; Delfini, M. Food Res. Int. 2014, 62, 66-73.
(15) Caligiani, A.; Coisson, J. D.; Travaglia, F.; Acquotti, D.; Palla, G.; Palla, L.; Arlorio, M. Food Chem. 2014, 148, 77-85.
(16) Caligiani, A.; Palla, L.; Acquotti, D.; Marseglia, A.; Palla G. Food Chem. 2014, 157, 94-99. 1 2 3 4 5 6 7 8 9 10 11 12 13 14 15 16 17 18 19 20 21 22 23 24 25 26 27 28 29 30 31 32 33 34 35 36 37 38 39 40 41 42 43 44 45 46 47 48 49 50 51 52 53 54 55 56 57 58 59
(17) Airoldi, C.; Tripodi, F.; Guzzi, G.; Nicastro, R.; Coccetti, P. Mol. BioSyst. 2015, 11, 379-383.
(18) Petrakis, E. A.; Cagliani, L. R.; Polissiou, M. G.; Consonni, R. Food Chem. 2015, 173, 890-896.
(19) Cagliani, L. R.; Pellegrino, G.; Giugno, G.; Consonni R. Talanta, 2013, 106,169-173.
(20) Consonni, R.; Cagliani, L. R.; Stocchero, M.; Porretta, S. J. Agr. Food Chem. 2010, 58, 7520-7525.
(21) Mallamace, D.; Corsaro, C.; Salvo, A.; Cicero, N.; Macaluso, A.; Giangrosso, G.; Ferrantelli, V.; Dugo, G. Physica A, 2014 401, 112-1170.
(22) Cicero, N.; Corsaro, C.; Salvo, A.; Vasi, S.; Giofrè S.V.; Ferrantelli, V.; Di Stefano, V.; Mallamace, D.; Dugo, G. Natural Product Research, 2015, in press DOI: 10.1080/14786419.2015.1012166.
(23) Rizzuti, A.; Aguilera-Saez, L. M.; Gallo, V.; Cafagna, I.; Mastrorilli, P.; Latronico, M.; Pacifico, A.; Matarrese, A. M.; Ferrara, G. Food Chemistry, 2015, 171 341-350.
(24) Gallo, V.; Mastrorilli, P.; Cafagna, I.; Nitti, G. I.; Latronico, M.; Longobardi, F.; Minoja, A. P.; Napoli, C.; Romito, V. A.; Schäfer, H.; Schütz, B.; Spraul M. J. Food Compos. Anal. 2014, 35, 44-52
(25) Ferrara, G.; Mazzeo, A.; Pacucci, C.; Netti, G.; Cafagna, I.; Mastrorilli, P.; Vezzoso, M.; Gallo V.; Am. J. Enol. Viticult. 2014, 65, 381-387.
(26) Longobardi, F.; Ventrella, A.; Bianco, A.; Catucci, L.; Cafagna, I.; Gallo, V.; Mastrorilli, P.; Agostiano A.; Food Chem. 2013, 141, 3028-3033.
(27) Rizzuti, A.; Caliandro, R.; Gallo, V.; Mastrorilli, P.; Chita, G.; Latronico M. Food Chem. 2013, 141, 1908-1915.
(28) Aghemo, C.; Albertino, A.; Gobetto, R.; Lussiana, C.; De Maria, A.; Isocrono, D. Eur. J. Lipid. Sci. Tech. 2012, 114, 1409– 1416.
(29) Aghemo, C.; Albertino, A.; Gobetto, R.; Spanna, F. J. Sci. Food Agr. 2011, 91, 2088–2094
(30) A non-exhaustive list of some recent examples is reported: a) Weber, M.; Hellriegel, C.; Rück, A.; Sauermoser, R.; Wüthrich, J.; Accreditation and Quality Assurance 2013, 18, 91-98; b) Ohtsuki, T.; Sato, K.; Sugimoto, N.; Akiyama, H.; Kawamura, Y. Talanta, 2012, 99, 342-348; c) Schoenberger, T.; Anal. Bioanal. Chem. 2012, 403, 247-254.
(31) Malz, F.; Jancke, H.; J. Pharm. Biomed. Anal. 2005, 38, 813-823.
(32) Ward, J. L.; Baker, J. M.; Miller, S. J.; Deborde, C.; Maucourt, M.; Biais, B.; Rolin, D.; Moing, A.; Moco, S.; Vervoort, J.; Lommen, A.; Schäfer, H.; Humpfer, E.; Beale, M. H. Metabolomics 2010, 6, 263-273.
(33) Viant, M. R.; Bearden, D. W.; Bundy, J. B.; Burton, I. W.; Collette, T. W.; Ekman, D. R.; Ezernieks, V.; Karakach, T. K.; Yu Lin, C.; Rochfort, S.; De Ropp, J. S.; Teng, Q.; Tjeerdema, R. S.; Walter, J. A.; Wu, H. Environ. Sci. Technol. 2009, 43, 219-225.
(34) ISO/IEC 17043:2010 and reference norms cited therein. (35) ISO/IEC 17025:2005 and reference norms cited therein. (36) ISO 13528:2005and reference norms cited therein.
(37) a) ISO 1:1994; b) ISO 2:1994; c) ISO 3:1994; d) ISO 4:1994; e) ISO 5:1998; f) ISO 5725-6:1994; and reference norms cited therein.
(38) Gallo, V.; Scapicchio, P.; Vezzoso, M.; Fanizzi, P. Risonanza magnetica e controllo qualità – Presentazione dei risultati del primo confront interlaboratorio nazionale, Ed. Camera di Commercio di Ba-ri, 2013 (available free of charge at http://www.samer.it/articoli/allegato/Samer_rev1_def.pdf and at
http://www.innovative-solutions.it/wp-content/uploads/2013/09/Pubblicazione-con-ISBN.pdf).
(39) EUROLAB Technical Report 1/2014, Guide to NMR Method Development and Validation – Part 1: Identification and
Quantification, 2014.
(40) Horwitz, W. Pure Appl. Chem. 1995, 67, 331-343.
(41) COMMISSION DECISION of 12 August 2002 implementing Council Directive 96/23/EC concerning the performance of analytical
methods and the interpretation of results (2002/657/EC), Official Journal of the European Communities, August 17th, 2002.
(42) Snedecor, G. W.; Cochran, W. G., Statistical Methods, Eighth Edition, Iowa State University Press, 1989.
1 2 3 4 5 6 7 8 9 10 11 12 13 14 15 16 17 18 19 20 21 22 23 24 25 26 27 28 29 30 31 32 33 34 35 36 37 38 39 40 41 42 43 44 45 46 47 48 49 50 51 52 53 54 55 56 57 58 59 60