RESEARCH PAPER
Genetic architecture of sporadic frontotemporal
dementia and overlap with Alzheimer
’s and
Parkinson
’s diseases
Raffaele Ferrari,
1Yunpeng Wang,
2Jana Vandrovcova,
1,3Sebastian Guel
fi,
1,3Aree Witeolar,
2Celeste M Karch,
4Andrew J Schork,
5Chun C Fan,
5James B Brewer,
6,7International FTD-Genomics Consortium (IFGC), International
Parkinson
’s Disease Genomics Consortium (IPDGC), International Genomics of
Alzheimer
’s Project (IGAP), Parastoo Momeni,
8Gerard S Schellenberg,
9William P Dillon,
10Leo P Sugrue,
10Christopher P Hess,
10Jennifer S Yokoyama,
11Luke W Bonham,
11Gil D Rabinovici,
11Bruce L Miller,
11Ole A Andreassen,
2Anders M Dale,
5,6,7John Hardy,
1Rahul S Desikan
10▸ Additional material is published online only. To view please visit the journal online (http://dx.doi.org/10.1136/ jnnp-2016-314411). For numbered affiliations see end of article.
Correspondence to Dr Raffaele Ferrari, Department of Molecular Neuroscience, University College London, Russell Square House, London WC1B 5EH, UK; [email protected]
The IFGC and IPDGC members are listed in the supplementary acknowledgments.
Received 12 July 2016 Revised 24 October 2016 Accepted 1 November 2016 Published Online First 29 November 2016
To cite: Ferrari R, Wang Y, Vandrovcova J, et al. J Neurol Neurosurg Psychiatry 2017;88:152–164.
ABSTRACT
Background Clinical, pathological and genetic overlap between sporadic frontotemporal dementia (FTD), Alzheimer’s disease (AD) and Parkinson’s disease (PD) has been suggested; however, the relationship between these disorders is still not well understood. Here we evaluated genetic overlap between FTD, AD and PD to assess shared pathobiology and identify novel genetic variants associated with increased risk for FTD. Methods Summary statistics were obtained from the International FTD Genomics Consortium, International PD Genetics Consortium and International Genomics of AD Project (n>75 000 cases and controls). We used conjunction false discovery rate (FDR) to evaluate genetic pleiotropy and conditional FDR to identify novel FTD-associated SNPs. Relevant variants were further evaluated for expression quantitative loci.
Results We observed SNPs within the HLA, MAPT and APOE regions jointly contributing to increased risk for FTD and AD or PD. By conditioning on polymorphisms associated with PD and AD, we found 11 loci associated with increased risk for FTD. Meta-analysis across two independent FTD cohorts revealed a genome-wide signal within the APOE region (rs6857, 30-UTR=PVRL2, p=2.21×10⁻¹²), and a suggestive signal for rs1358071 within the MAPT region (intronic=CRHR1, p=4.91×10⁻⁷) with the effect allele tagging the H1 haplotype.
Pleiotropic SNPs at the HLA and MAPT loci associated with expression changes in cis-genes supporting involvement of intracellular vesicular trafficking, immune response and endo/lysosomal processes.
Conclusions Ourfindings demonstrate genetic pleiotropy in these neurodegenerative diseases and indicate that sporadic FTD is a polygenic disorder where multiple pleiotropic loci with small effects contribute to increased disease risk.
INTRODUCTION
Frontotemporal dementia (FTD) is a neurodegen-erative disorder characterised by progressive
impair-ment of behaviour, cognition and executive
function or language.1Recent converging evidence suggests clinical, pathological and genetic overlap between FTD and other common neurodegenera-tive diseases including Alzheimer’s disease (AD) and Parkinson’s disease (PD).
From a clinical perspective, FTD and AD can sometimes be difficult to distinguish at onset or during disease progression:2non-cognitive manifes-tations such as mood changes, psychosis and vari-able social conduct can characterise the initial phases of AD patients.3Similarly, cognitive dysfunc-tions such as changes in abstract thinking or poor
judgement, planning and difficulty in completing
tasks become evident in either condition as the disease progresses.4This might partially reflect the fact that FTD and AD are associated with progres-sive impairment of similar brain circuits (frontal, prefrontal or temporal lobes and/or subcortical regions).5Of note, among the primary progressive aphasia (PPA) cases in FTD, logopenic progressive aphasia (LPA) has been suggested as an atypical early presentation of AD.6In addition, the subtype called FTD and parkinsonism linked to
chromo-some 17 (FTDP-17)—linked to mutations in the
microtubule-associated protein tau (MAPT)7 and
progranulin (GRN) genes8—shows
parkinsonian-like syndrome,9 while dementia features can be
found in up to 30–80% of PD cases (Parkinson’s
Disease Dementia (PDD)) in later stages of the disease.10
From a pathological perspective, abnormal intra-cellular accumulation of the tau protein is seen in FTD and AD.11Additionally, TDP-43 pathology has been reported in AD and FTD at different disease stages,12and in some rare PD cases associated with variability in leucine-rich repeat kinase 2 (LRRK2).13 From a genetic perspective, distinct genetic and genome-wide scale studies have suggested potential genetic overlap between FTD, AD and PD at
spe-cific loci. The MAPT gene on chromosome 17 has
been extensively investigated in FTD11and has been recently implicated in AD14 and PD,15 suggesting
that tau pathology might jointly contribute to FTD, AD and PD. In addition, genome-wide association studies (GWAS) have revealed that common genetic variants within theHLA region on chromosome 6 increase risk for FTD,16AD17and PD.18
Evaluating genetic overlap between complex traits is based on the concept that gene(s) or genetic variant(s) can influence more than one distinct phenotype (=genetic pleiotropy).19Availability of large-scale genetic data sets (eg, genome-wide summary statis-tics) is a key to estimate the level of genetic overlap, or genetic pleiotropy, across diverse traits including groups of related disorders.20
We have recently developed methods to evaluate genetic plei-otropy across different disorders (identifying novel genetic var-iants associated with various conditions including multiple sclerosis and AD).14 21 22 In the current work, we sought to apply these methods taking advantage of existing large-scale genetic data (ie, summary statistics) for FTD,16AD23and PD24 to identify genetic overlap, that is, pleiotropic effects, across these neurodegenerative disorders.
MATERIALS AND METHODS Participant samples
We evaluated complete summary statistics ( p values and ORs)
from GWAS data of clinically diagnosed FTD,16 AD23 and
PD.24 We used AD-GWAS summary statistic data from the
International Genomics of AD Project (IGAP Stage 1), which consisted of 17 008 AD and 37 154 controls with genotyped or
imputed data at 7 055 881 SNPs (see table 1 for additional
details).23 We obtained PD-GWAS summary statistic data from
the International Parkinson’s Disease Genomics Consortium
(IPDGC) consisting of 5333 cases and 12 019 controls with genotyped and imputed data at 7 689 524 SNPs (seetable 1for additional details).24
We examined FTD summary statistic GWAS data (discovery+ replication phase) from the International FTD-Genomics
Consortium (IFGC).16 As our discovery cohort, we used the
IFGC phase I cohort (table 1), consisting of 2154 FTD cases and 4308 controls with genotyped and imputed data at 6 026 384 SNPs.16To replicate our findings from the discovery
analyses using IFGC phase I, we assessed the p values of pleio-tropic SNPs (conditional FDR<0.05; see the‘Statistical analysis’ section) within the IFGC phase II sample. The IFGC phase II sample consisted of 1372 FTD cases and 5094 controls geno-typed using a partially custom-designed Illumina NeuroX chip (see table 1 for details).16 The IFGC multicenter GWAS has
been described in detail elsewhere.16 Briefly, 44 international research groups contributed samples to this two-stage clinical FTD-GWAS. We evaluated genetic data from patients clinically diagnosed with behavioural variant FTD (bvFTD), semantic dementia (SD), progressive non-fluent aphasia (PNFA) and FTD with motor neuron disease (FTD-MND). As described in the original study, we excluded any cases with clinically diagnosed LPA, progressive supranuclear palsy (PSP) or corticobasal degen-eration (CBD). In this study,MAPT and GRN mutation carriers
were excluded whereas individuals with C9orf72 expansions
were not excluded because this locus was identified subsequent to original sample collection. The relevant institutional review boards or ethics committees approved the research protocol of the individual GWAS used in the current analysis, and all human participants gave written informed consent.
Statistical analysis
Using recently developed statistical methods to evaluate pleio-tropic effects, we evaluated single nucleoide polymorphysms (SNPs) associating with FTD, AD and PD. These methods have been described in extensive detail in a number of recent publica-tions.14 17 22 Briefly, for given associated phenotypes A and B, pleiotropic enrichment of phenotype A with phenotype B exists if the proportion of SNPs or genes associated with phenotype A increases as a function of increased association with phenotype B. To assess enrichment, we constructed fold-enrichment plots of nominal −log10( p) values for all FTD-SNPs and a subset of
SNPs determined by the significance of their association with PD and AD. In fold-enrichment plots, the presence of
enrich-ment is reflected by an upward deflection of the curve for
phenotype A if the degree of deflection from the expected null line is dependent on the degree of association with phenotype B. To assess for polygenic effects below the standard
GWAS significance threshold, we focused the fold-enrichment
plots on SNPs with nominal −log10( p)<7.3 (corresponding to Table 1 Summary data from all GWAS used in the current study
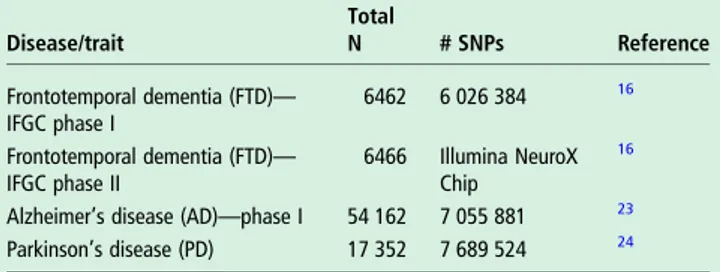
Disease/trait Total N # SNPs Reference Frontotemporal dementia (FTD)— IFGC phase I 6462 6 026 384 16 Frontotemporal dementia (FTD)— IFGC phase II 6466 Illumina NeuroX Chip 16
Alzheimer’s disease (AD)—phase I 54 162 7 055 881 23 Parkinson’s disease (PD) 17 352 7 689 524 24
GWAS, genome-wide association studies; IFGC, International FTD-Genomics Consortium.
Figure 1 Fold-enrichment plots of enrichment versus nominal−log10p
values (corrected for inflation) in FTD below the standard GWAS threshold of p<5×10⁻⁸as a function of
significance of association with AD (A) and PD (B) and at the level of −log10( p)≥0, −log10( p)≥1,
−log10( p)≥2 corresponding to p≤1,
p≤0.1 and p≤0.01, respectively. Blue line indicates all SNPs. AD, Alzheimer’s disease; FTD, frontotemporal dementia; GWAS, genome-wide association studies; PD, Parkinson’s disease.
Ferrari R, et al. J Neurol Neurosurg Psychiatry 2017;88:152–164. doi:10.1136/jnnp-2016-314411 153
Neurogenetics
group.bmj.com on January 18, 2017 - Published by
http://jnnp.bmj.com/ Downloaded from
p value>5×10⁻⁸). The enrichment can be directly interpreted in terms of true discovery rate (TDR=1−false discovery rate [FDR]).22
To identify specific loci involved in FTD and AD or FTD and
PD, we computed conjunction FDR.17 Conjunction FDR,
denoted by FDRtrait1& trait2, is defined as the posterior
probabil-ity that a SNP is null for either phenotype or both simultan-eously, given the p values for both traits are as small, or smaller, than the observed p values. A conservative estimate of the
conjunction FDR is given by the maximum statistic in taking the maximum of FDRtrait1|trait2 and FDR trait2|trait1.17 We used an
overall FDR threshold of<0.05, which means five expected
false discovery per hundred reported. Additionally, we con-structed Manhattan plots based on the ranking of conjunction FDR to illustrate the genomic location of the pleiotropic loci.17
To identify specific FTD loci, we computed conditional
FDR.14 22 The standard FDR framework derives from a model that assumes the distribution of test statistics in a GWAS can be
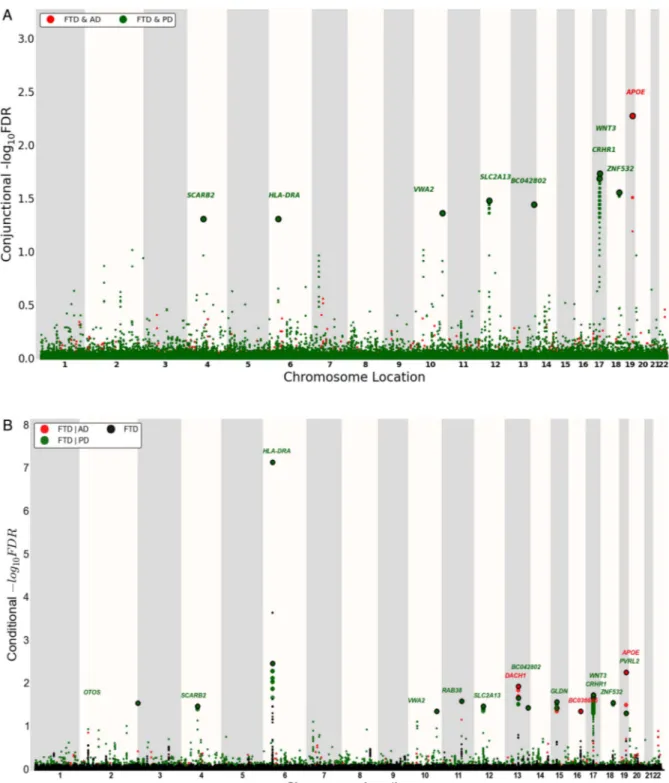
Figure 2 ‘Conjunction’ (A) and ‘conditional’ (B) Manhattan plots of conjunction and conditional –log10(FDR) values for FTD (black) and FTD given
AD (FTD|AD, red) and PD (FTD|PD, green). SNPs with conditional and conjunction–log10FDR>1.3 (ie, FDR<0.05) are shown with large points. A
black line around the large points indicates the most significant SNP in each LD block, and this SNP was annotated with the closest gene, which is listed above the symbols in each locus. For additional details, see online supplementary information. AD, Alzheimer’s disease; FTD, frontotemporal dementia; LD, linkage disequilibrium; PD, Parkinson’s disease.
formulated as a mixture of null and non-null effects, with true associations (non-null effects) having more extreme test statis-tics, on average, than false associations (null effects). The condi-tional FDR is an extension of the standard FDR, which incorporates information from GWAS summary statistics of a second phenotype to adjust its significance level. The condi-tional FDR is defined as the probability that a SNP is null in the first phenotype given that the p values in the first and second phenotypes are as small as, or smaller, than the observed ones. It is important to note that ranking SNPs by standard FDR or by p values both give the same ordering of SNPs. In contrast, if the primary and secondary phenotypes are related genetically, conditional FDR re-orders SNPs and results in a different ranking than that based on p values alone. We used an overall FDR threshold of <0.05, which meansfive expected false dis-covery per hundred reported. Additionally, we constructed Manhattan plots based on the ranking of conditional FDR to illustrate the genomic location of the pleiotropic loci. In all ana-lyses, we controlled for the effects of genomic inflation by using intergenic SNPs.14 22 Detailed information on fold-enrichment and conditional Q-Q plots, Manhattan plots and conditional FDR can be found in prior reports.14 22
For loci with conditional FDR<0.05, we performed afixed effects, inverse variance weighted meta-analysis across the dis-covery and replication FTD cohorts (IFGC phases I and II, total n=3526 FTD cases and 9402 healthy controls) using the R
package meta (http://CRAN.R-project.org/package=meta).25
Briefly, the fixed effects, inverse variance weighted meta-analysis summarises the combined statistical support across independent studies under the assumption of homogeneity of effects. Individual study β estimates (log ORs) are averaged, weighted by the estimated SE.
Expression quantitative trait loci
For the expression quantitative trait loci (eQTL) analyses, we used data generated within the Braineac (http://www.braineac. org) and GTEx (http://www.gtexportal.org/home/) projects. Briefly, in braineac, eQTL data were generated from 101
neuro-pathologically defined controls in the following 10 brain
regions: cerebellar cortex, frontal cortex, hippocampus, medulla (specifically inferior olivary nucleus), occipital cortex (specific-ally primary visual cortex), putamen, substantia nigra, thalamus, temporal cortex and intralobular white matter. In GTEx, eQTL data were available for the following 10 brain regions: anterior cingulate cortex (BA24; n=72), caudate (basal ganglia; n=100), cerebellar hemisphere (n=89), cerebellum (n=103), cortex (n=96), frontal cortex (BA9; n=92), hippocampus (n=81),
hypothalamus (n=81), nucleus accumbens (basal ganglia; n=93) and putamen (basal ganglia; n=82).
Each eQTL was within ± 1 MB of each SNP, and the signi
fi-cance threshold was p<1×10⁻⁵as per website curators.
RESULTS
Polygenic enrichment in FTD as a function of AD and PD
We observed enrichment for FTD-SNPs (IFGC phase I) across different levels of significance of association with AD and PD (figure 1). For progressively stringent p value thresholds of FTD-SNPs (ie, increasing values of nominal−log10PFTD≥6), we
found 140-fold and 120-fold pleiotropic enrichment as a func-tion of AD (−log10PAD≥3.0) and PD (−log10PPD≥3.0) SNPs,
respectively (figure 1). Although decreased in magnitude, we observed a similar pattern of enrichment for AD-SNPs and PD-SNPs conditional on FTD-SNPs suggesting symmetric genetic overlap between the three neurodegenerative diseases (see online supplementaryfigure S1).
Conjunction FDR identifies shared FTD loci
At a conjunction FDR<0.05, we identified 11 SNPs that were asso-ciated with FTD and AD or PD (figure 2A and table 2). These included rs405509 (chromosome 19; intergenic; closest gene= APOE; conjunction trait=AD; min conjunction FDR=0.0052) and
rs9268877 (chromosome 6; intergenic; closest gene=HLA-DRA;
conjunction trait=PD; min conjunction FDR=0.048). We also found two pleiotropic loci in theMAPT haplotype-region, namely
rs199528 (chromosome 17; intronic=WNT3; conjunction
trait=PD; min conjunction FDR=0.018) and rs1358071 (chromo-some 17; intronic=CRHR1; conjunction trait=PD; min conjunc-tion FDR=0.02). We detected addiconjunc-tional shared loci between FTD
and PD on chromosomes 4 (rs7664889, intronic=SCARB2), 10
(rs676768, intronic=VWA2), 12 (rs10784359, intronic=
SLC2A13), 13 (rs2893253; intergenic; closest gene=EFNB2) and 18 (rs12964543, intronic=ZNF532) (table 2).
Conditional FDR identifies novel FTD loci
To identify novel SNPs associated with FTD, we ranked IFGC phase I FTD-SNPs conditional on their genetic association with AD and PD (conditional FDR), particularly focusing on those SNPs that did not reach genome-wide significant levels in the previous FTD-GWAS. At a conditional FDR <0.05, we found 13 novel FTD susceptibility loci: 11/13 polymorphisms were available for replication purposes within the IFGC2 cohort (7 actual SNPs and 4 proxies with linkage disequilibrium (LD)
r2≥0.7 and within 500 kb distance from the reference SNP
(based on HapMap 22/21)) (figure 2b, table 3). Then,
Table 2 Overlapping loci between FTD, PD and AD at a conjunction FDR<0.05
SNP Position Chr Location; nearest gene Associated phenotype Min Conj FDR FTD p-value Associated phenotype p-value Direction of effect rs7664889 77 087 704 4 Intronic;SCARB2 PD 4.84E−02 1.75E−04 8.88E−04 ++++ rs9268877 32 431 147 6 Intergenic;HLA-DRA PD 4.84E−02 1.04E−10 7.41E−04 ++++ rs676768 116 030 773 10 Intronic;VWA2 PD 4.27E−02 3.12E−04 6.14E−04 ++++ rs10784359 40 445 750 12 Intronic;SLC2A13 PD 3.26E−02 1.58E−04 7.47E−05 ++++ rs2893253 107 067 203 13 Intergenic;EFNB2 PD 3.55E−02 2.02E−04 1.11E−04 ++++ rs199528 44 843 136 17 Intronic;WNT3 PD 1.80E−02 4.09E−05 9.82E−16 ++++ rs1358071 43 803 189 17 Intronic;CRHR1 PD 2.02E−02 4.96E−05 7.76E−15 ++++ rs12964543 56 543 095 18 Intronic;ZNF532 PD 2.73E−02 1.12E−04 3.08E−04 ++++ rs405509 45 408 836 19 Intergenic;APOE AD 5.22E−03 1.25E−05 6.16E−70 ++++
AD, Alzheimer’s disease; FDR, false discovery rate; FTD, frontotemporal dementia; PD, Parkinson’s disease.
Ferrari R, et al. J Neurol Neurosurg Psychiatry 2017;88:152–164. doi:10.1136/jnnp-2016-314411 155
Neurogenetics
group.bmj.com on January 18, 2017 - Published by
http://jnnp.bmj.com/ Downloaded from
meta-analysis across IFGC phase I and II cohorts revealed one genome-wide significant locus (p<5×10⁻⁸): rs6857 on
chromo-some 19 (3’-UTR=PVRL2; conditioning trait=PD; reference
allele=T; OR=1.34; 95% CI 1.23 to 1.45; p=2.21×10⁻¹²)
(table 3,figures 3A and4B). We also found one suggestive locus
(at p<5×10⁻⁷) on rs1358071 within the MAPT region on
chromosome 17 (intronic=CRHR1; conditioning trait=PD;
ref-erence allele=A; OR=1.19; 95% CI 1.11 to 1.27;
p=4.91×10⁻⁷) (table 3,figures 3B and4B).
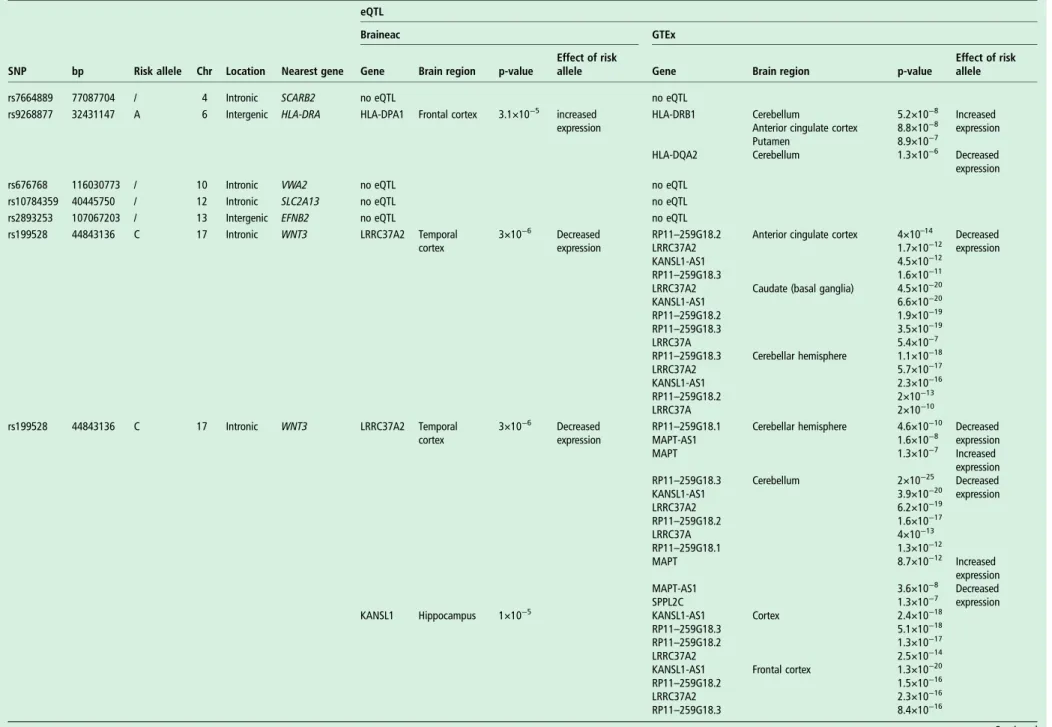
Expression quantitative trait loci
We evaluated potential biological relevance for each of
the identified conjunction and conditional FDR SNPs
(rs7664889, rs9268877, rs676768, rs10784359, rs2893253, rs199528, rs1358071, rs12964543, rs405509, rs4417745, rs1328032, rs2446406, rs7184882, rs6857, rs302665 and rs10507789) in human brain tissues assayed for genome-wide gene expression. There were 20 eQTLs in the Braineac data set, while data extracted from GTEx indicated up to 144 significant eQTLs (table 4). These were driven by rs199528 and rs1358071
(chr 17;MAPT-haplotype locus) and by rs9268877 (chr 6; HLA
locus). No eQTLs were found for rs405509 and rs6857 (chr19; APOE locus).
The eQTL data from Braineac and GTEx were cross-supportive in different brain regions, including frontal and tem-poral cortices, jointly indicating influence on expression levels
ofLRRC37A2, KANSL1, LRRC37A4 and CRHR1 for rs199528
and rs1358071; conversely, changes in expression ofHLA-DPA1
(from Braineac in frontal cortex), and HLA-DRB1 and
HLA-DQA2 (from GTEx in subcortical regions and cerebellum) were evident for rs9268877 (table 4).
DISCUSSION
The current work shows that several genetic markers are jointly associated with increased risk for FTD, AD and PD. By lever-aging recently developed and validated genetic methods, our findings indicate potential shared genetic architecture among these neurodegenerative diseases and suggest the polygenic nature of sporadic FTD where multiple pleiotropic loci with small effect size contribute to increased disease risk. To the best of our knowledge, this is the first large-scale study assessing genetic overlap between sporadic FTD and AD, and sporadic FTD and PD.
Using the conjunction FDR (which identifies loci jointly asso-ciated with two traits), we found eight polymorphisms specific to FTD-PD and one to FTD-AD; through the conditional FDR (which leverages secondary phenotypes, eg, AD and PD, to improve statistical power for gene discovery) we identified 13 novel FTD associated loci. Of note, all nine conjunction FDR loci were also detected in the conditional FDR analyses support-ing the notion that the shared polymorphisms increase risk for developing sporadic FTD. Across all analyses, we found notable
relevance for theHLA, MAPT and APOE regions.
Building on prior work implicating the involvement of the
immune system in PD26 and AD,17 we found that rs9268877,
on chromosome 6, intergenic between HLA-DRA and
HLA-DRB5, is a shared marker between FTD and PD. The risk allele of this SNP was robustly associated with changes in
expression of HLA-DPA1 (increased expression), HLA-DRB1
(increased expression) and HLA-DQA2 (decreased expression)
in brain tissues.HLA-DPA1 is an HLA class II α chain paralogue presenting peptides derived from extracellular proteins;27this is
of particular relevance as impairment of clearance of extracellu-lar debris might increase risk of developing a neurodegenerative
Table 3 No ve l SNPs sho wing associa tion with FTD at conditional FDR<0.05 SNP P osition Chr Near es t gene R efer ence allele Associa ted phenotype Min C ond FDR IF GC phase I p-value IF GC phase I OR (95% CI) IF GC phase II p-value IF GC phase II OR (95% CI) Meta-analy sis p-value Meta-analy sis OR (95% CI) rs4417745 241 225 364 2 Intergenic; OTO S A PD 2.73E − 02 2.52E − 05 1.36 (1.18 –1.57) 0.47 1.06 (0.90 –1.25) 3.20E − 04 1.22 (1.09 –1.36) rs7664889 77 087 704 4 Intr onic; SC ARB2 T PD 3.23E − 02 1.75E − 04 0.73 (0.62 –0.86) 0.82 0.98 (0.81 –1.18) 3.18E − 03 0.83 (0.73 –0.94) rs676768 116 030 773 10 Intr onic; VW A2 # T PD 4.25E − 02 3.12E − 04 0.78 (0.68 –0.90) 0.55 0.96 (0.82 –1.11) 2.40E − 03 0.86 (0.78 –0.95) rs1328032 71 420 424 13 Intergenic; DA CH1 A AD 1.38E − 02 1.93E − 07 0.67 (0.57 –0.78) 0.34 0.94 (0.83 –1.06) 7.39E − 05 0.80 (0.72 –0.88) rs2446406 51 679 783 15 Intr onic; GLDN # A PD 2.59E − 02 7.18E − 07 0.81 (0.74 –0.88) 0.40 0.96 (0.87 –1.06) 2.24E − 05 0.87 (0.82 –0.93) rs7184882 73 737 373 16 In orf; LOC101927998 T AD 4.24E − 02 6.64E − 07 0.71 (0.62 –0.81) 0.08 0.89 (0.78 –1.02) 3.08E − 06 0.78 (0.71 –0.86) rs199528 44 843 136 17 Intr onic; WNT3 T PD 1.79E − 02 4.09E − 05 0.82 (0.74 –0.90) 0.03 0.89 (0.80 –0.99) 9.59E − 06 0.85 (0.79 –0.91) rs1358071 43 803 189 17 Intr onic; CRHR1 A PD 2.01E − 02 4.96E − 05 1.22 (1.12 –1.31) 0.001 1.16 (1.07 –1.26) 4.91E − 07 1.19 (1.11 –1.27) rs12964543 56 543 095 18 Intr onic; ZNF532 # A PD 2.71E − 02 1.12E − 04 1.24 (1.11 –1.38) 0.24 1.05 (0.96 –1.15) 9.10E − 04 1.12 (1.05 –1.2) rs6857 45 392 254 19 3 0-UTR; PVRL2 # T PD 4.69E − 02 7.03E − 07 1.31 (1.18 –1.46) 4.46E − 07 1.37 (1.21 –1.55) 2.21E − 12 1.34 (1.23 –1.45) rs405509 45 408 836 19 Intergenic; AP OE T AD 5.26E − 03 1.25E − 05 1.18 (1.09 –1.27) 0.93 1.0 (0.92 –1.09) 5.98E − 05 1.15 (1.08 –1.24) ORs pr ovided for the refer ence allele. # rs676768 not available, pr oxy SNP rs12782946 fr om IF GC phase II. # rs2446406 not available, pr oxy SNP rs2445742 fr om IF GC phase II. # rs12964543 not available, pr oxy SNP exm2272683 fr om IF GC phase II. # rs6857 not available, pr oxy SNP rs2075650 fr om IF GC phase II. AD, Alzheimer ’s disease; FDR, false disco very ra te; FTD, fr ontotempor al dementia; IF GC, Interna tional FTD-Genomics C onsortium; PD, Parkinson ’s disease.
condition,28 including FTD and PD. While HLA-DRB1 has
functions similar to HLA-DPA1, HLA-DQA2 belongs to the
HLA class II α chain family located in intracellular vesicles: it plays a central role in the peptide loading of MHC class II mole-cules and releasing the class II-associated invariant chain peptide (CLIP) molecule from the peptide-binding site. This prevents the binding of self-peptide fragments prior to MHC II
localisa-tion within the endolysosome.29 Taken together, these data
support and further elucidate details about the role of immune system and endolysosomal processes in FTD and PD.
Our results also point to theMAPT region as jointly involved in PD and FTD through two SNPs on chromosome 17 mapping
toWNT3 (wingless-type MMTV integration site family member
3; rs199528) and CRHR1 (corticotropin releasing hormone
receptor 1; rs1358071). The risk alleles of both markers, which
tag the H1 MAPT-haplotype (figure 4a), are associated with
robust expression changes ofLRRC37A2 (decreased expression), KANSL1 (decreased expression), LRRC37A4 (increased
expres-sion) and CRHR1 (decreased expression). The LRRC37A
(leucine-rich repeat containing 37 member) genes encode plasma membrane proteins that pass from the Golgi to the endoplasmic reticulum (ER) and extracellular areas through
vesicle transport30reiterating that intracellular vesicle trafficking is a sensitive and potentially vulnerable process in the brain.
The KANSL1 (KAT8 regulatory NSL complex subunit 1) gene
encodes a nuclear protein targeting the DNA and involved in histone acetylation with the MLL1 and NSL1 complexes: dis-ruption, mutations or haploinsufficiency of this gene have been
associated with the 17q21.31 microdeletion syndrome.31
CRHR1 encodes a G protein-coupled receptor for neuropep-tides involved in diverse physiological processes including stress and immune responses.32 Overall, these data strongly suggest
that the H1 MAPT-haplotype contributes to increased risk for FTD and PD and its effect is likely mediated by modulating changes in the expression profiles of functionally important cis-genes.
We found evidence for involvement of the APOE region in
FTD. We detected a genome-wide significant association signal
in sporadic FTD for rs6857 (30UTR in PVRL2; p
value=2.21×10⁻¹²) and identified rs405509, intergenic
between TOMM40 (translocase of outer mitochondrial
mem-brane 40) and APOE (apolipoprotein E), as jointly associated with FTD and AD. Rs6857 and rs405509 are in linkage
equilib-rium (LE; r2=0.1) and are part of two separate haplotypes
Figure 3 Forest plots for (A) rs6857 on chromosome 19 and (B) rs1358071 on chromosome 17.
Ferrari R, et al. J Neurol Neurosurg Psychiatry 2017;88:152–164. doi:10.1136/jnnp-2016-314411 157
Neurogenetics
group.bmj.com on January 18, 2017 - Published by
http://jnnp.bmj.com/ Downloaded from
(figure 4b): (1) one spanning 12 kb (including 13 SNPs
[rs142042446, rs12972156, rs12972970, rs34342646,
rs283811, rs283815, rs71352238, rs184017, rs2075650,
rs34404554, rs11556505, rs778934950 and rs59007384] with
r2∼0.8) and encompassing PVRL2 and TOMM40 for rs6857
(haplotype a), and (2) one spanning 14 kb (including 10 SNPs [rs157584, rs71337246, rs7157588, rs7157590, rs1160985, rs760136, rs741780, rs1038025, rs34215622 and rs7259620]
with r2 ∼0.8) and encompassing TOMM40 and APOE for
rs405509 (haplotype b). Our data indicate that rs6857 increases risk of FTD, while this was not the case for rs405509. No SNP within either haplotype (a or b) was functionally associated with cis-regulatory effects. A large body of evidence implicates APOE as a strong genetic risk factor for AD. Whether it is a genetic modifier of disease risk with non-AD neurodegenerative diseases is still unclear. In this respect, several studies in the literature have highlighted this locus as a potential risk factor, with vari-able effect size, for a variety of conditions including vascular dementia (VD), amyotrophic lateral sclerosis (ALS), PD and
dementia with Lewy bodies (DLB).33Although early work did
notfind a clear association between the APOE locus and FTD,34 more recent studies suggest that it might associate with FTD risk35–37 and accelerate frontotemporal brain atrophy.38 Given potential overlap between patients diagnosed with clinical FTD and AD,39 it is unclear whether the current findings reflect a
genuine association with FTD or might be inflated by subtle
presence of AD or FTD cases in either original study cohort. Nonetheless, these data raise the question whether the detected PVRL2 SNP tags an FTD-specific risk disease haplotype: future work will be required to further characterise the potential role of this locus—in particular, haplotype a—in FTD.
We also detected several pleiotropic loci between FTD and
PD, in addition toHLA, MAPT and APOE. The marker on chr
4, rs7664889, is intronic to the SCARB2 (scavenger receptor
class B member 2) gene that encodes a glycoprotein locating to the membrane of lysosomes and endosomes further supporting the notion of impacted endolysosomal tracts in FTD and PD. The marker on chromosome 12, rs10784359 maps to the
Figure 4 (A)MAPT-locus on chromosome 17. The two SNPs, rs1358071 and rs199528, are shared between FTD and PD. Either SNP is in LD with rs1052553 whose major allele (A) tags the H1MAPT-haplotype. The major alleles of rs1358071 and rs199528 are also the effect alleles, and they are in LD with rs1052553 (r2=0.75 and 0.84, respectively). Thus, the effect at this locus is H1 driven. (B)APOE locus. The two haplotypes a and b
are depicted. Haplotype a is the one driven by rs6857 with 13 SNPs in LD (r2∼0.8; font color: blue). Haplotype b is the one driven by rs405509 with
10 SNPs in LD (r2∼0.8; font color: black). Rs6857 and rs405509, and the respective haplotypes a and b, are in LE (r2∼0.1). FTD, frontotemporal
Table 4 Summary of eQTL in brain from Braineac and GTEx
eQTL
Braineac GTEx
SNP bp Risk allele Chr Location Nearest gene Gene Brain region p-value
Effect of risk
allele Gene Brain region p-value
Effect of risk allele rs7664889 77087704 / 4 Intronic SCARB2 no eQTL no eQTL
rs9268877 32431147 A 6 Intergenic HLA-DRA HLA-DPA1 Frontal cortex 3.1×10⁻⁵ increased expression
HLA-DRB1 Cerebellum 5.2×10⁻⁸ Increased expression Anterior cingulate cortex 8.8×10⁻⁸
Putamen 8.9×10⁻⁷
HLA-DQA2 Cerebellum 1.3×10⁻⁶ Decreased expression rs676768 116030773 / 10 Intronic VWA2 no eQTL no eQTL
rs10784359 40445750 / 12 Intronic SLC2A13 no eQTL no eQTL rs2893253 107067203 / 13 Intergenic EFNB2 no eQTL no eQTL rs199528 44843136 C 17 Intronic WNT3 LRRC37A2 Temporal
cortex
3×10⁻⁶ Decreased expression
RP11–259G18.2 Anterior cingulate cortex 4×10–14 Decreased expression LRRC37A2 1.7×10⁻¹²
KANSL1-AS1 4.5×10⁻¹² RP11–259G18.3 1.6×10⁻¹¹ LRRC37A2 Caudate (basal ganglia) 4.5×10⁻²⁰ KANSL1-AS1 6.6×10⁻²⁰ RP11–259G18.2 1.9×10⁻¹⁹ RP11–259G18.3 3.5×10⁻¹⁹ LRRC37A 5.4×10⁻⁷ RP11–259G18.3 Cerebellar hemisphere 1.1×10⁻¹⁸ LRRC37A2 5.7×10⁻¹⁷ KANSL1-AS1 2.3×10⁻¹⁶ RP11–259G18.2 2×10⁻¹³ LRRC37A 2×10⁻¹⁰ rs199528 44843136 C 17 Intronic WNT3 LRRC37A2 Temporal
cortex
3×10⁻⁶ Decreased expression
RP11–259G18.1 Cerebellar hemisphere 4.6×10⁻¹⁰ Decreased expression MAPT-AS1 1.6×10⁻⁸ MAPT 1.3×10⁻⁷ Increased expression RP11–259G18.3 Cerebellum 2×10⁻²⁵ Decreased expression KANSL1-AS1 3.9×10⁻²⁰ LRRC37A2 6.2×10⁻¹⁹ RP11–259G18.2 1.6×10⁻¹⁷ LRRC37A 4×10⁻¹³ RP11–259G18.1 1.3×10⁻¹² MAPT 8.7×10⁻¹² Increased expression MAPT-AS1 3.6×10⁻⁸ Decreased expression SPPL2C 1.3×10⁻⁷
KANSL1 Hippocampus 1×10⁻⁵ KANSL1-AS1 Cortex 2.4×10⁻¹⁸ RP11–259G18.3 5.1×10⁻¹⁸ RP11–259G18.2 1.3×10⁻¹⁷ LRRC37A2 2.5×10⁻¹⁴ KANSL1-AS1 Frontal cortex 1.3×10⁻²⁰ RP11–259G18.2 1.5×10⁻¹⁶ LRRC37A2 2.3×10⁻¹⁶ RP11–259G18.3 8.4×10⁻¹⁶ Continued Ferr ari R, et al . J Neur ol Neur osurg Ps ychia try 2017; 88 :152 – 164. doi:10.1136 /jnnp-2016-31 4411 159
Neur
ogenetics
group.bmj.com on January 18, 2017 - Published by http://jnnp.bmj.com/ Downloaded fromeQTL
Braineac GTEx
SNP bp Risk allele Chr Location Nearest gene Gene Brain region p-value
Effect of risk
allele Gene Brain region p-value
Effect of risk allele MAPT 1.3×10⁻⁷ Increased
expression KANSL1-AS1 Hippocampus 2.4×10⁻¹⁶ Decreased expression RP11–259G18.3 3.1×10⁻¹³
RP11–259G18.2 7×10⁻¹³ LRRC37A2 3.7×10⁻¹² KANSL1-AS1 Hypothalamus 1.3×10⁻¹⁵ rs199528 44843136 C 17 Intronic WNT3 KANSL1 Hippocampus 1×10⁻⁵ Decreased
expression
LRRC37A2 Hypothalamus 7.6×10⁻¹⁵ Decreased expression RP11–259G18.3 1.6×10⁻¹³
RP11–259G18.2 5.8×10⁻¹³ LRRC37A 5.6×10⁻⁸ KANSL1-AS1 Nucleus accumbens (basal
ganglia) 1.8×10⁻²⁰ RP11–259G18.3 1.4×10⁻¹⁸ LRRC37A2 4.9×10⁻¹⁷ RP11–259G18.2 3.4×10⁻¹⁶ RP11–259G18.1 7.3×10⁻⁷ KANSL1-AS1 Putamen (basal ganglia) 2.5×10⁻¹⁹ RP11–259G18.3 6.9×10⁻¹⁵ LRRC37A2 3.1×10⁻¹⁴ RP11–259G18.2 9.6×10⁻¹¹ LRRC37A 1×10⁻⁶ RP11–259G18.1 1.6×10⁻⁶ rs1358071 43803189 A 17 Intronic CRHR1 LRRC37A4 Cerebellum 7.4×10⁻²² Increased
expression
LRRC37A4P Anterior cingulate cortex 1.9×10⁻¹¹ Increased expression 1.8×10⁻¹⁶ RP11–259G18.2 1.6×10⁻⁹ Decreased expression Frontal cortex 3.6×10⁻¹⁰ RP11–707O23.5 4.3×10⁻⁹
Hippocampus 4.7×10⁻¹⁰ LRRC37A2 5.3×10⁻⁸ 5.3×10⁻⁷ RP11–259G18.3 7.5×10⁻⁷ Medulla 2.7×10⁻⁸ KANSL1-AS1 9.7×10⁻⁷
Occipital cortex 1.9×10⁻¹¹ LRRC37A4P Caudate (basal ganglia) 7.3×10⁻¹⁵ Increased expression 5.5×10⁻¹¹ LRRC37A2 1.7×10⁻¹⁴ Decreased expression Putamen 2.2×10⁻⁶ RP11–707O23.5 4.5×10⁻¹³ Substantia nigra 7.3×10⁻¹¹ RP11–259G18.2 3.1×10⁻¹² 2.4×10⁻⁷ KANSL1-AS1 2.8×10⁻¹¹ rs1358071 43803189 A 17 Intronic CRHR1 LRRC37A4 Temporal
cortex
3.1×10⁻¹² Increased expression
RP11–259G18.3 Caudate (basal ganglia) 1.1×10⁻¹⁰ Decreased expression 1.1×10⁻⁷ LRRC37A 6.3×10⁻⁶
Thalamus 5.7×10⁻¹² LRRC37A4P Cerebellar hemisphere 1.3×10⁻¹⁵ Increased expression 5.2×10⁻¹⁰ PLEKHM1 4.0×10⁻¹³
White matter 7.7×10⁻⁶ LRRC37A2 2.6×10⁻¹² Decreased expression KANSL1 Hippocampus 6.1×10⁻⁷ Decreased
expression RP11–259G18.2 1.5×10⁻⁹ RP11–259G18.3 1.9×10⁻⁹ RP11–259G18.1 2.6×10⁻⁹ KANSL1-AS1 6.1×10⁻⁹ LRRC37A 2.5×10⁻⁸ Continued Ferr ari R, et al . J Neur ol Neur osurg Ps ychia try 2017; 88 :152 – 164. doi:10.1136/jn np-2016-3144 11
ogenetics
group.bmj.com on January 18, 2017 - Published by http://jnnp.bmj.com/ Downloaded fromTable 4 Continued
eQTL
Braineac GTEx
SNP bp Risk allele Chr Location Nearest gene Gene Brain region p-value
Effect of risk
allele Gene Brain region p-value
Effect of risk allele RP11–798G7.5 5.9×10⁻⁸ Increased expression RP11–707O23.5 2.8×10⁻⁷ Decreased expression FMNL1 4.2×10⁻⁷ Increased expression CTD-2020K17.1 5.2×10⁻⁶ MAPT 6.6×10⁻⁶ LRRC37A4P Cerebellum 5.3×10⁻¹⁸ PLEKHM1 4.2×10⁻¹⁷ RP11–259G18.3 5.6×10⁻¹⁶ Decreased expression LRRC37A2 3.3×10⁻¹⁵ RP11–259G18.2 6.6×10⁻¹⁵ RP11–707O23.5 2.6×10⁻¹³ RP11–259G18.1 1.5×10⁻¹⁰ LRRC37A 1.7×10⁻¹⁰ KANSL1-AS1 7.1×10⁻¹⁰ RP11–798G7.5 1.4×10⁻⁹ Increased expression MAPT 5.4×10⁻⁹
rs1358071 43803189 A 17 Intronic CRHR1 KANSL1 Hippocampus 6.1×10⁻⁷ Decreased expression
MAPT-AS1 Cerebellum 6.2×10⁻⁸ Decreased expression FMNL1 2.7×10⁻⁶ Increased
expression KANSL1-AS1 Cortex 1.5×10⁻¹⁴ Decreased expression LRRC37A2 1.6×10⁻¹¹ RP11–707O23.5 2.7×10⁻¹¹ LRRC37A4P 3.2×10⁻¹¹ Increased expression RP11–259G18.3 5.7×10⁻¹¹ Decreased expression RP11–259G18.2 1.3×10⁻¹⁰ CRHR1-IT1 1.3×10⁻⁸ PLEKHM1 9.4×10⁻⁷ RP11–259G18.1 7.8×10⁻⁶ CRHR1 Medulla 2.9×10⁻⁶ LRRC37A2 Frontal cortex 2.5×10⁻¹¹
LRRC37A4P 9.3×10⁻¹¹ Increased expression RP11–259G18.2 2.2×10⁻¹⁰ Decreased expression KANSL1-AS1 8.2×10⁻¹⁰ RP11–707O23.5 9.8×10⁻¹⁰ RP11–259G18.3 1.7×10⁻⁹ DND1P1 1.6×10⁻⁶ CRHR1-IT1 2.7×10⁻⁶ MAPT 4.1×10⁻⁶ Increased expression LRRC37A4P Hippocampus 2.0×10⁻¹² LRRC37A2 1.6×10⁻¹¹ Decreased expression RP11–259G18.2 2.7×10⁻¹¹ Continued Ferr ari R, et al . J Neur ol Neur osurg Ps ychia try 2017; 88 :152 – 164. doi:10.1136 /jnnp-2016-31 4411 161
Neur
ogenetics
group.bmj.com on January 18, 2017 - Published by http://jnnp.bmj.com/ Downloaded fromTable 4 Continued
eQTL
Braineac GTEx
SNP bp Risk allele Chr Location Nearest gene Gene Brain region p-value
Effect of risk
allele Gene Brain region p-value
Effect of risk allele KANSL1-AS1 4.1×10⁻¹¹ RP11–707O23.5 5.8×10⁻¹¹ RP11–259G18.3 2.5×10⁻⁸ rs1358071 43803189 A 17 Intronic CRHR1 CRHR1 Medulla 2.9×10⁻⁶ Decreased
expression
CRHR1-IT1 Hippocampus 4.8×10⁻⁸ Decreased expression DND1P1 2.4×10⁻⁶ LRRC37A2 Hypothalamus 1.1×10⁻¹² RP11–707O23.5 3.2×10⁻¹¹ KANSL1-AS1 8.7×10⁻¹⁰ LRRC37A4P 1.8×10⁻⁹ Increased expression RP11–259G18.2 2.1×10⁻⁸ Decreased expression RP11–259G18.3 2.3×10⁻⁸
LRRC37A4P Nucleus accumbens (basal ganglia) 2.2×10⁻¹⁶ Increased expression KANSL1-AS1 2.3×10⁻¹³ Decreased expression RP11–707O23.5 1.2×10⁻¹¹ RP11–259G18.3 4.2×10⁻¹¹ LRRC37A2 5.8×10⁻¹¹ RP11–259G18.2 8.6×10⁻⁹ CRHR1-IT1 1.0×10⁻⁷
LRRC37A4P Putamen (basal ganglia) 2.9×10⁻¹² Increased expression LRRC37A2 1.5×10⁻¹⁰ Decreased expression KANSL1-AS1 2.9×10⁻¹⁰ RP11–707O23.5 1.6×10⁻⁹ RP11–259G18.3 4.1×10⁻⁹ RP11–259G18.2 1.7×10⁻⁸ CRHR1-IT1 5.8×10⁻⁷ rs12964543 56543095 / 18 Intronic ZNF532 no eQTL no eQTL
rs405509 45408836 / 19 Intergenic APOE no eQTL no eQTL rs4417745 241225364 / 2 Intergenic OTOS no eQTL no eQTL rs1328032 71420424 / 13 Intergenic DACH1 no eQTL no eQTL rs2446406 51679783 / 15 Intronic GLDN no eQTL no eQTL rs7184882 73737373 C 16 In orf LOC101927998 no eQTL no eQTL rs6857 45392254 T 19 30-UTR PVRL2 no eQTL no eQTL rs302665 87879627 / 11 Intronic RAB38 no eQTL no eQTL rs10507789 71409940 / 13 Intergenic DACH1 no eQTL no eQTL
eQTL, expression quantitative trait loci.
Ferr ari R, et al . J Neur ol Neur osurg Ps ychia try 2017; 88 :152 – 164. doi:10.1136/jn np-2016-3144 11
ogenetics
group.bmj.com on January 18, 2017 - Published by http://jnnp.bmj.com/ Downloaded fromintronic region ofSLC2A13 (solute carrier family 2 member 13) a gene which is part of the extended locus that includesLRRK2 indicating that this region may also mediate FTD risk.40
Some limitations might apply to studies of this kind. Particularly, in the original works, the diagnoses of FTD, AD and PD were established clinically. This has the potential to introduce subtle clinical overlap across cohorts, thus assessments in large pathology confirmed cohorts is the next valuable and warranted step to take. However, it must be acknowledged that such ad hoc cohorts are currently not yet available.
Considered together with prior work, our results overall are a first step in the process of decrypting common underpinnings of FTD, AD and PD: they suggest that a subset of genetic markers
in the HLA and MAPT-H1 regions (and potentially the APOE
cluster) might be jointly involved in these neurodegenerative dis-orders. In the case of the HLA and MAPT loci, differentially expressed genes in distinct brain regions might account for the clinical and phenotypic differences observed across these disor-ders.41Of note, the relevant pleiotropic SNPs that we found in
the HLA and MAPT regions do appear to exert their effect by
influencing expression changes in cis-genes involved in immune response, endolysosomal processes, intracellular vesicular traf-ficking and DNA/chromatin-associated metabolism, further sup-porting the notion of involvement of these processes in neurodegenerative disease, including FTD.42More work will be needed to further characterise our pleiotropic signals, which might hold promise in the future for developing global prevent-ive and therapeutic strategies for FTD, AD and PD.
In summary, we here identified (1) genetic overlap between
FTD and AD and FTD and PD and (2) novel loci influencing
FTD pathobiology with small effect size illustrating that a sub-stantial polygenic component contributes to FTD risk.
Author affiliations 1
Department of Molecular Neuroscience, Institute of Neurology, UCL, London, UK 2NORMENT, Institute of Clinical Medicine, University of Oslo and Division of Mental Health and Addiction, Oslo University Hospital, Oslo, Norway
3Department of Medical & Molecular Genetics, King’s College London, Guy’s Hospital, London, UK
4Department of Psychiatry, Washington University, St. Louis, Missouri, USA 5
Department of Cognitive Sciences, University of California, San Diego, La Jolla, California, USA
6
Department of Radiology, University of California, San Diego, La Jolla, California, USA
7
Department of Neurosciences, University of California, San Diego, La Jolla, California, USA
8
Laboratory of Neurogenetics, Department of Internal Medicine, Texas Tech University Health Science Center, Lubbock, Texas, USA
9
Department of Pathology and Laboratory Medicine, University of Pennsylvania Perelman School of Medicine, Philadelphia, Pennsylvania, USA
10
Neuroradiology Section, Department of Radiology and Biomedical Imaging, University of California, San Francisco, San Francisco, California, USA 11
Department of Neurology, University of California, San Francisco, San Francisco, California, USA
Acknowledgements The authors thank the International FTD-Genomics Consortium (IFGC), the International Parkinson’s Disease Genomic Consortium (IPDGC) and the International Genomics of Alzheimer’s Project (IGAP) for providing summary statistics data for these analyses. Further acknowledgments for IFGC, IPDGC and IGAP are found in the online supplementary material.
Contributors R Ferrari; D G Hernandez; M A Nalls; J D Rohrer; A Ramasamy; J B J Kwok; C Dobson-Stone; P R Schofield; G M Halliday; J R Hodges; O Piguet; L Bartley; E Thompson; E Haan; I Hernández; A Ruiz; M Boada; B Borroni; A Padovani; C Cruchaga; N J Cairns; L Benussi; G Binetti; R Ghidoni; G Forloni; D Albani; D Galimberti; C Fenoglio; M Serpente; E Scarpini; J Clarimón; A Lleó; R Blesa; M Landqvist Waldö; K Nilsson; C Nilsson; I R A Mackenzie; G-Y R Hsiung; D M A Mann; J Grafman; C M Morris; J Attems; T D Griffiths; I G McKeith; A J Thomas; P Pietrini; E D Huey; E M Wassermann; A Baborie; E Jaros; M C Tierney; P Pastor; C Razquin; S Ortega-Cubero; E Alonso; R Perneczky;
J Diehl-Schmid; P Alexopoulos; A Kurz; I Rainero; E Rubino; L Pinessi; E Rogaeva; P St George-Hyslop; G Rossi; F Tagliavini; G Giaccone; J B Rowe; J C M Schlachetzki; J Uphill; J Collinge; S Mead; A Danek; V M Van Deerlin; M Grossman;
J Q Trojanowski; J van der Zee; M Cruts; C Van Broeckhoven; S F Cappa; I Leber; D Hannequin; V Golfier; M Vercelletto; A Brice; B Nacmias; S Sorbi; S Bagnoli; I Piaceri; J E Nielsen; L E Hjermind; M Riemenschneider; M Mayhaus; B Ibach; G Gasparoni; S Pichler; W Gu; M N Rossor; N C Fox; J D Warren; M G Spillantini; H R Morris; P Rizzu; P Heutink; J S Snowden; S Rollinson; A Richardson; A Gerhard; A C Bruni; R Maletta; F Frangipane; C Cupidi; L Bernardi; M Anfossi; M Gallo; M E Conidi; N Smirne; R Rademakers; M Baker; D W Dickson; N R Graff-Radford; R C Petersen; D Knopman; K A Josephs; B F Boeve; J E Parisi; W W Seeley; B L Miller; A M Karydas; H Rosen; J C van Swieten; E G P Dopper; H Seelaar; Y A L Pijnenburg; P Scheltens; G Logroscino; R Capozzo; V Novelli; A A Puca; M Franceschi; A Postiglione; G Milan; P Sorrentino; M Kristiansen; H-H Chiang; C Graff; F Pasquier; A Rollin; V Deramecourt; T Lebouvier; D Kapogiannis; L Ferrucci; S Pickering-Brown; A B Singleton; J Hardy; P Momeni
Contributors RF and RSD analysed and interpreted data and wrote the manuscript. YW, JV, SG, AW, CMK, AJS, CCF, JBB, PM, GSS, WPD, LPS, CPH, JSY, LWB, GDR, BLM, OAA, AMD and JH contributed to the conception or design of the work or the acquisition or analysis of data and critically reviewed the drafted manuscript at multiple stages.
Funding This research was supported by grants from the National Institutes of Health (NIH-AG046374, K01 AG049152), Larry J Hilbom Foundation, the Research Council of Norway (#213837, #225989, #223273, #237250/EU JPND), the South East Norway Health Authority (2013–123), Norwegian Health Association and the KG Jebsen Foundation. RSD was supported by the National Alzheimer’s Coordinating Center Junior Investigator Award, ASNR Foundation Alzheimer’s Imaging Research Grant Program and NIH/NIDA grant U24DA041123. RF is supported by Alzheimer’s Society (grant number 284). For IFGC, IPDGC and IGAP funding sources, see online supplemental acknowledgements.
Disclaimer The funding organisations had no role in the design and conduct of the study; collection, management, analysis and interpretation of the data; preparation, review or approval of the manuscript; and decision to submit the manuscript for publication.
Competing interests None declared.
Ethics approval The relevant institutional review boards or ethics committees approved the research protocol of the individual GWAS used in the current analysis, and all human participants gave written informed consent.
Provenance and peer review Not commissioned; externally peer reviewed.
REFERENCES
1 Bang J, Spina S, Miller BL. Frontotemporal dementia.Lancet2015;386:1672–82. 2 Bora E, Walterfang M, Velakoulis D. Theory of mind in behavioural-variant
frontotemporal dementia and Alzheimer’s disease: a meta-analysis.J Neurol Neurosurg Psychiatr2015;86:714–9.
3 Mega MS, Cummings JL, Fiorello T, et al. The spectrum of behavioral changes in Alzheimer’s disease.Neurology1996;46:130–5.
4 Karantzoulis S, Galvin JE. Distinguishing Alzheimer’s disease from other major forms of dementia.Expert Rev Neurother2011;11:1579–91.
5 Silveri MC. Frontotemporal dementia to Alzheimer’s disease. Dialogues Clin Neurosci 2007;9:153–60.
6 Rohrer JD, Warren JD. Phenotypic signatures of genetic frontotemporal dementia.
Curr Opin Neurol2011;24:542–9.
7 Hutton M, Lendon CL, Rizzu P, et al. Association of missense and 5’-splice-site mutations in tau with the inherited dementia FTDP-17.Nature1998;393:702–5.
8 Baker M, Mackenzie IR, Pickering-Brown SM, et al. Mutations in progranulin cause tau-negative frontotemporal dementia linked to chromosome 17.Nature
2006;442:916–19.
9 Siuda J, Fujioka S, Wszolek ZK. Parkinsonian syndrome in familial frontotemporal dementia.Parkinsonism Relat Disord2014;20:957–64.
10 Irwin DJ, Lee VM, Trojanowski JQ. Parkinson’s disease dementia: convergence of α-synuclein, tau and amyloid-β pathologies.Nat Rev Neurosci2013;14:626–36. 11 Spillantini MG, Goedert M. Tau pathology and neurodegeneration.Lancet Neurol
2013;12:609–22.
12 Josephs KA, Murray ME, Whitwell JL, et al. Updated TDP-43 in Alzheimer’s disease staging scheme.Acta neuropathol2016;131:571–85.
13 Ling H, Kara E, Bandopadhyay R, et al. TDP-43 pathology in a patient carrying G2019S LRRK2 mutation and a novel p.Q124E MAPT.Neurobiol Aging
2013;34:2889.e5-9.
14 Desikan RS, Schork AJ, Wang Y, et al. Genetic overlap between Alzheimer’s disease and Parkinson’s disease at the MAPT locus.Mol Psychiatry2015;20:1588–95.
15 Satake W, Nakabayashi Y, Mizuta I, et al. Genome-wide association study identifies common variants at four loci as genetic risk factors for Parkinson’s disease.Nat Genet2009;41:1303–7.
Ferrari R, et al. J Neurol Neurosurg Psychiatry 2017;88:152–164. doi:10.1136/jnnp-2016-314411 163
Neurogenetics
group.bmj.com on January 18, 2017 - Published by
http://jnnp.bmj.com/ Downloaded from
16 Ferrari R, Hernandez DG, Nalls MA, et al. Frontotemporal dementia and its subtypes: a genome-wide association study.Lancet Neurol2014;13:686–99.
17 Yokoyama JS, Wang Y, Schork AJ, et al. Association between genetic traits for immune-mediated diseases and Alzheimer disease.JAMA Neurol2016;73:691–7.
18 Hamza TH, Zabetian CP, Tenesa A, et al. Common genetic variation in the HLA region is associated with late-onset sporadic Parkinson’s disease.Nat Genet2010;42:781–5.
19 Gratten J, Visscher PM. Genetic pleiotropy in complex traits and diseases: implications for genomic medicine.Genome Med2016;8:78.
20 Parkes M, Cortes A, van Heel DA, et al. Genetic insights into common pathways and complex relationships among immune-mediated diseases.Nat Rev Genet
2013;14:661–73.
21 Wang Y, Bos SD, Harbo HF, et al. Genetic overlap between multiple sclerosis and several cardiovascular disease risk factors.Mult Scler2016.
22 Desikan RS, Schork AJ, Wang Y, et al. Polygenic overlap between C-Reactive protein, plasma lipids, and Alzheimer disease.Circulation2015;131:2061–9. 23 Lambert JC, Ibrahim-Verbaas CA, Harold D, et al. Meta-analysis of 74,046
individuals identifies 11 new susceptibility loci for Alzheimer’s disease.Nat Genet
2013;45:1452–8.
24 Nalls MA, Plagnol V, Hernandez DG, et al. International Parkinson Disease Genomics Consortium. Imputation of sequence variants for identification of genetic risks for Parkinson’s disease: a meta-analysis of genome-wide association studies.
Lancet2011;377:641–9.
25 Willer CJ, Li Y, Abecasis GR. METAL: fast and efficient meta-analysis of genomewide association scans.Bioinformatics2010;26:2190–1.
26 Ahmed I, Tamouza R, Delord M, et al. Association between Parkinson’s disease and the HLA-DRB1 locus.Mov Disord2012;27:1104–10.
27 Urayama KY, Chokkalingam AP, Metayer C, et al. HLA-DP genetic variation, proxies for early life immune modulation and childhood acute lymphoblastic leukemia risk.
Blood2012;120:3039–47.
28 Sokolowski JD, Mandell JW. Phagocytic clearance in neurodegeneration.Am J Pathol2011;178:1416–28.
29 Lenormand C, Bausinger H, Gross F, et al. HLA-DQA2 and HLA-DQB2 genes are specifically expressed in human Langerhans cells and encode a new HLA class II molecule.J Immunol2012;188:3903–11.
30 Giannuzzi G, Siswara P, Malig M, et al. Evolutionary dynamism of the primate LRRC37 gene family.Genome Res2013;23:46–59.
31 Koolen DA, Kramer JM, Neveling K, et al. Mutations in the chromatin modifier gene KANSL1 cause the 17q21.31 microdeletion syndrome.Nat Genet2012;44: 639–41.
32 Weber H, Richter J, Straube B, et al. Allelic variation in CRHR1 predisposes to panic disorder: evidence for biased fear processing.Mol Psychiatry2016;21:813–22. 33 Verghese PB, Castellano JM, Holtzman DM. Apolipoprotein E in Alzheimer’s disease
and other neurological disorders.Lancet Neurol2011;10:241–52.
34 Geschwind D, Karrim J, Nelson SF, et al. The apolipoprotein E epsilon4 allele is not a significant risk factor for frontotemporal dementia.Ann Neurol1998;44: 134–8.
35 Engelborghs S, Dermaut B, Mariën P, et al. Dose dependent effect of APOE epsilon4 on behavioral symptoms in frontal lobe dementia.Neurobiol Aging
2006;27:285–92.
36 Rubino E, Vacca A, Govone F, et al. Apolipoprotein E polymorphisms in frontotemporal lobar degeneration: a meta-analysis.Alzheimers Dement
2013;9:706–13.
37 Srinivasan R, Davidson Y, Gibbons L, et al. The apolipoprotein E epsilon4 allele selectively increases the risk of frontotemporal lobar degeneration in males.J Neurol Neurosurg Psychiatr2006;77:154–8.
38 Agosta F, Vossel KA, Miller BL, et al. Apolipoprotein E epsilon4 is associated with disease-specific effects on brain atrophy in Alzheimer’s disease and frontotemporal dementia.Proc Natl Acad Sci USA2009;106:2018–22.
39 van der Zee J, Sleegers K, Van Broeckhoven C. Invited article: the Alzheimer disease-frontotemporal lobar degeneration spectrum.Neurology2008;71: 1191–7.
40 Gao J, Nalls MA, Shi M, et al. An exploratory analysis on gene–environment interactions for Parkinson disease.Neurobiol aging2012;33:2528.e1. e1-6. 41 Hyman BT. Tau propagation, different tau phenotypes, and prion-like properties of
tau.Neuron2014;82:1189–90.
42 Ferrari R, Forabosco P, Vandrovcova J, et al. Frontotemporal dementia: insights into the biological underpinnings of disease through gene co-expression network analysis.Mol Neurodegener2016;11:21.