Department of Industrial Engineering
Ph. D. Thesis in
MECHANICAL ENGINEERING
XIV CYCLE (2013–2015)
Supply Chain Management in the
Fashion Retail Industry: a
multi-method approach for the
optimisation of performances
Giada Martino
Supervisor Ch.mo Prof. Raffaele Iannone Coordinator Ch.mo Prof. Vincenzo SergiAl termine di questi tre anni di dottorato, credo sia doveroso esprimere ri-conoscenza verso le persone che mi hanno costantemente sostenuto ed aiu-tato, permettendomi di completare al meglio questo percorso e di superare le difficolt`a.
Un ringraziamento speciale va al mio tutor, il Prof. Raffaele Iannone, per l’impegno, la competenza, la disponibilit`a e la pazienza con cui mi ha seguito e consigliato in ogni fase di realizzazione del lavoro.
Ringrazio il Prof. Alfredo Lambiase e il Prof. Stefano Riemma per avermi accolta nel gruppo di ricerca e per i preziosi consigli.
Grazie al Prof. Michael Packianather e a Baris Yuce per essere riusciti a rendere il breve periodo trascorso presso l’Universit`a di Cardiff ricco di stimoli e di conoscenze utili alla mia attivit`a di ricerca.
Un ringraziamento speciale, professionale ma anche e soprattutto personale, al prof. Salvatore Miranda, per la stima dimostratami e per avermi incor-aggiata e ascoltata con pazienza e sensibilit`a.
Ringrazio i miei genitori che sono da sempre i miei punti di riferimento e non mi hanno mai fatto mancare il loro affetto ed il loro sostegno. Grazie a mia sorella Annalaura per aver sempre saputo come calmare la mia ansia. Un grazie speciale ad Arturo, che mi ha sempre incoraggiata e che con es-trema pazienza ha sopportato i miei sbalzi di umore e le mie paranoie. Infine, ringrazio tutti gli amici che mi hanno accompagnato e sostenuto nell’arco di questi tre anni, che mi sono stati vicino, con affetto sincero, condividendo le tappe di questa strada e comprendendo il grande valore che per me ha avuto questo percorso. Grazie alle mie colleghe, Valentina e Chiara, per aver reso semplici e divertenti anche i momenti pi`u difficili (nel nostro laboratorio verde kiwi), grazie a Marcello per non essere ancora rius-cito ad insegnarmi come si stratificano i dati. . .
Abstract
Fashion and Apparel Supply Chains work in a very fast-changing envi-ronment always demanding better quality, higher availability of products, broader assortments and shorter delivery times. Then, an efficient Sup-ply Chain Management can make the difference between success or failure in the market. In this context, this thesis analyses the characteristics of this particular industry at different levels. Starting from the analysis of the whole Supply Chain, aimed at identifying the most critical areas and processes, this work proposes a reference framework for the definition and subsequent optimisation of the physical and informative flows. The model also includes all the cost and revenue items connected to the processes which are characteristic of a Fashion Supply Chain working with a wide network of direct-operated or franchising mono-brand stores. In recent years, the tra-ditional model, only based on a brick & mortar business, has been overcome due to the wide spread of e-commerce. This evolution forced companies to adopt a new integrated strategy, called Omni-Channel Retailing, in order to meet customers requests and offer a wider product selection. With these perspectives, the framework has been revised and extended in order to rep-resent no longer only the physical network but also the mobile purchasing paths and allow us to evaluate how this new integrated strategy may impact on the performances of a traditional Supply Chain. From all these analysis it emerged that the most critical process for a company operating in this sector, is the Replenishment process, i.e. the definition of the delivery times and quantities from the central warehouse to the whole network of stores and clients. An heuristic optimisation method, called the Bees Algorithm, was adopted to solve this problem and, together with the reference frame-work, represents a useful Decision Support System for fashion companies in the definition of the purchasing quantities and operations plans well ahead of the sales season.
1 Fashion and Apparel Industry: Supply Chain
Characteris-tics and Challenges 23
1.1 Introduction . . . 23
1.2 Complexity of the fashion world . . . 24
1.3 Market segmentation . . . 27
1.4 Demand Driven Supply Chains . . . 28
1.5 The growth of Quick Response and Fast Fashion . . . 31
1.6 Conclusions . . . 33
2 Supply Chain Risk Assessment: Understanding main tar-gets and critical areas 35 2.1 Introduction . . . 36
2.2 Risk sources . . . 38
2.3 Research Methodology . . . 39
2.3.1 Process Analysis . . . 42
2.3.2 Identification of Main Targets . . . 45
2.3.3 Identification of Risk Factors . . . 47
2.3.3.1 Market driven orientation risk factors . . . . 47
2.3.3.2 Cost reduction risk factors . . . 51
2.3.3.3 Brand internationalization and market ex-pansion risk factors . . . 54
2.3.3.4 Environmental sustainability risk factors . . 55
2.3.4 Clusterization . . . 59 2.3.5 Network Definition . . . 60 2.3.6 Pairwise Comparison . . . 60 2.3.7 Prioritization . . . 66 2.4 Conclusions . . . 70 9
3 Framework for Optimisation of Supply Chain performances 71
3.1 Introduction . . . 72
3.2 Definition of the framework . . . 73
3.2.1 Development of the New Collection (A) . . . 75
3.2.2 Classification (B) . . . 77
3.2.3 Demand Forecasts (C) . . . 80
3.2.3.1 Forecast Techniques in the Fashion Industry 80 3.2.3.2 Forecasting Factors and data . . . 81
3.2.4 Definition of the Merchandise Orders (D) . . . 86
3.2.5 Definition of the Delivery Orders (E) . . . 87
3.2.6 Suppliers (F) . . . 88
3.2.7 Central Warehouses (G) . . . 89
3.2.8 Definition of the Replenishment Orders (H) . . . 90
3.2.9 Stores (I) . . . 91
3.2.10 Deviation analysis (J) . . . 92
3.2.11 Factory Outlet stores (K) . . . 93
3.3 The Causal Loop Diagram . . . 94
3.3.1 Principles of System Thinking and System Dynamics in Supply Chain Management . . . 94
3.3.2 Pre-Season phase . . . 95
3.3.3 In-Season phase . . . 101
3.3.4 Economic Performance . . . 104
3.3.5 The Final Causal Loop Diagram . . . 104
3.4 Technical Key Performance Indicators . . . 106
3.4.1 Service Level . . . 106 3.4.2 Forecasting Accuracy . . . 108 3.4.3 Inventory Turnover . . . 108 3.4.4 Sales Percentage . . . 108 3.4.5 Availability . . . 109 3.4.6 Out of Stock . . . 110 3.5 Conclusions . . . 110
4 Design of the Simulation model 113 4.1 Introduction . . . 113
4.2 Definition of the simulation model . . . 113
4.2.1 Key performance Indicators . . . 116
4.3 Introduction to the case study . . . 118
4.3.1 Definition of the scenarios . . . 120
4.4 Sensitivity Analysis . . . 121
5 Impact Analysis of the Introduction of an Omni-Channel
Retailing System 129
5.1 Introduction . . . 130
5.2 An overview on Omni-Channel retailing strategy . . . 131
5.3 Impact on a traditional Supply Chain . . . 137
5.4 Design of the simulation model . . . 139
5.5 Introduction to the case study . . . 142
5.5.1 Definition of the scenarios . . . 142
5.6 Analysis of the results . . . 144
5.6.1 Service level . . . 144 5.6.2 Forecasting Accuracy . . . 144 5.6.3 Inventory turnover . . . 145 5.6.4 Sales Percentage . . . 145 5.6.5 Shelf Availability . . . 146 5.6.6 Out of Stock . . . 146 5.6.7 Purchase Cost . . . 147
5.6.8 Primary Transport Cost . . . 147
5.6.9 Warehouse Management Cost . . . 148
5.6.10 Secondary Transport Cost . . . 148
5.6.11 Stores Management Cost . . . 149
5.6.12 Out of Stock Cost . . . 151
5.6.13 Revenues . . . 151
5.6.14 Profit . . . 151
5.7 Conclusions . . . 152
6 Optimisation of the Replenishment Problem using the Bees Algorithm 153 6.1 Introduction . . . 153
6.2 The Replenishment Problem in the Retail Industry . . . 154
6.3 The Basic Bees Algorithm . . . 156
6.4 The proposed Tabu-Bees algorithm . . . 158
6.5 Design of the Optimisation process: the replenishment problem160 6.6 Experimental results . . . 161
6.7 Conclusions . . . 162
1.1 Product lifecycle in the fashion industry compared to other
markets [Bandinelli et al., 2011] . . . 25
1.2 A traditional Supply Chain in the Fashion Industry . . . 29
1.3 Quick Response and Fast Fashion compared to the traditional management approach [HermesLab, 2009] . . . 32
2.1 Risk sources in the Supply Chain . . . 39
2.2 Process flow representing the research methodology . . . 41
2.3 Example of a Gantt Chart for the main processes in the Fash-ion Retail Industry . . . 45
2.4 Network structure for the risk prioritization . . . 63
2.5 Detailed connections between risk factors . . . 64
2.6 ABC analysis for the risk factors . . . 69
3.1 Framework for the Optimization of the Supply Chain in the Fashion Retail Industry . . . 74
3.2 Gaussian curve representing demand trend according to sizes 85 3.3 Causal relationships for Definition of New Collection, De-mand Forecasting and Merchandise Planning . . . 97
3.4 Causal relationships for Delivery process . . . 98
3.5 Causal relationships for Replenishment process . . . 100
3.6 Price trend . . . 103
3.7 Causal relationships for Sales process . . . 103
3.8 Causal relationships for Deviation Analysis . . . 104
3.9 Economic relationship . . . 105
3.10 The Final Causal Loop Diagram for a Fashion Retail Supply Chain . . . 105
3.11 Six Major Management Processes of the SCOR Model . . . . 106
3.12 KPIs identification from SCOR 11.0 model . . . 107
4.1 General Diagram of the simulation model . . . 114
4.2 Case study historical sales data for the whole sales season . . 120
4.3 Demand Profile of Scenario 1 and 2 . . . 122
4.4 Demand Profile of Scenario 3 and 4 . . . 122
4.5 Demand Profile of Scenario 5 and 6 . . . 122
4.6 Results of the sensitivity analysis for the parameter u (per-centage of variation of the operations plans) . . . 123
4.7 Comparison of the results for the Primary and Secondary Transport Costs . . . 125
4.8 Comparison of the results for Purchase Cost and Service Level125 4.9 Comparison of the results for Out of Stock and OOS Cost . . 126
4.10 Comparison of the results for Management Cost and Inven-tory Turnover for Stores . . . 126
4.11 Comparison of the results for Shelf Availability and Sales Percentage . . . 127
4.12 Comparison of the results for Revenues and Forecasting Ac-curacy . . . 127
4.13 Comparison of the results for Inventory Turnover and Man-agement Cost for Warehouse . . . 128
4.14 Comparison of the results for the Profit . . . 128
5.1 Compound Annual Grow Rate (CAGR) for online and offline apparel market . . . 130
5.2 Omni-Channel strategies . . . 132
5.3 Customer path for ”Info Store”, ”Book & Collect” and ”Mo-bile Commerce” strategies . . . 132
5.4 Supply Chain of the Fashion Retail Industry - Traditional and ”Buy Online, Pick up in Store” channels . . . 138
5.5 Availability check process in the virtual inventory system . . 139
5.6 General Diagram of the Simulation Model . . . 141
5.7 Service level for physical stores and online channel . . . 144
5.8 Forecasting accuracy for stores and items . . . 145
5.9 Inventory turnover for warehouse and stores . . . 145
5.10 Sales percentage . . . 146
5.11 Shelf Availability . . . 146
5.12 Out of Stock for physical stores and online channel . . . 147
5.14 Primary Transport Cost . . . 148
5.15 Warehouse Management Cost . . . 148
5.16 Secondary and Courier Transport Costs . . . 150
5.17 Management Costs for Warehouse and Stores . . . 150
5.18 Out of Stock Costs . . . 151
5.19 Revenues . . . 151
5.20 Revenues . . . 152
6.1 The Natural Foraging Behaviour of Honey Bees [Vaishali, 2014]157 6.2 Comparison between basic bees and Tabu-Bees results: Profit value for 6 different configurations of items and stores . . . . 163
6.3 Correlation matrix - part 1 . . . 168
1.1 Example of a Gantt Chart for the Production and Supply
Process in the Fall/Winter Season . . . 27
1.2 Comparison between Lean and Agile Supply Chain models [Bhatia, 2014] . . . 31
2.1 Main processes in a Fashion Retail Supply Chain . . . 43
2.1 Main processes in a Fashion Retail Supply Chain . . . 44
2.2 Literature confirmation for the selected supply chain targets . 47 2.3 Risk map for the Pre-Season phase (part 1) . . . 57
2.4 Risk map for the Pre-Season phase (part 2) . . . 58
2.5 Risk map for the In-Season and Post-Season phase . . . 59
2.6 Clustering (part 1) . . . 61
2.7 Clustering (part 2) . . . 62
2.8 Saaty’s fundamental scale . . . 65
2.9 Prioritization of the targets according to their weights . . . . 67
2.10 Normalized weights for each risk factor . . . 68
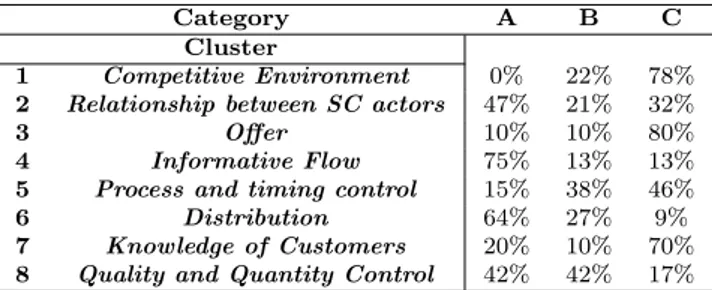
2.11 Percentage distribution of risk factors over the ABC classes for each cluster . . . 69
2.12 Percentage distribution of risk factors over the ABC classes for the three time phases . . . 69
3.1 Example of activity schedule for a Fall/Winter Season . . . . 76
3.2 Example of characteristics of collection items . . . 76
3.3 Product category classification . . . 79
3.4 Input factors for Demand Forecasts . . . 83
3.5 Summary of the forecasting factors and their characteristics . 85 4.1 Nomenclature . . . 114
4.2 Key Performance Indicators . . . 117
4.3 Clothing items characteristics of the case study . . . 118
4.4 Stores characteristics of the case study . . . 118
4.5 Stores characteristics related to secondary transport for the case study . . . 119
4.6 Suppliers characteristics related to primary transport for the case study . . . 119
4.7 Case study historical sales data for each item and each store . 120 4.8 Parameters of the simulation model . . . 121
4.9 One-factor-at-a-time Sensitivity Analysis . . . 123
4.10 Results of the Sensitivity Analysis . . . 124
5.1 Multi-Channel versus Omni-Channel Management [Verhoef et al., 2015] . . . 136
5.2 Parameters of the Omni-Channel simulation model . . . 143
5.3 Simulated Scenarios . . . 143
5.4 Parameters used for the evaluation of Courier Costs . . . 149
6.1 Pseudo-code of the basic bees algorithm . . . 158
6.2 Pseudo-code of the Tabu-Bees algorithm . . . 159
6.3 Parameters of the Bees and Tabu-Bees Algorithms for the replenishment problem . . . 161
6.4 Summary of the nomenclature used in the thesis . . . 171
6.4 Summary of the nomenclature used in the thesis . . . 172
”Do you think your industry is tough? Imagine customer preferences that can shift literally overnight, product lifecycles measured in weeks, and the value of your product plummeting if you miss the latest trend. Welcome to the world of fast fashion” [Sull and Turconi, 2008]
The previous statement perfectly summarises the main challenges that man-agers operating in this field have to face every day. The Fashion and Apparel Industry is, in fact, one of the key pillars of the global economy, but it also represents one of the most flexible and unpredictable Industries, given the high volatility of demand and fast changes in customer tastes and trends. Until the late 1980s, traditional fashion and apparel retailers used demand forecasting for the definition of their operations plans long before the actual time of product consumption, i.e. the sales season. In the last decades, though, this sector experienced a real revolution due to the introduction of the ”Fast Fashion” model and to the widespread of e-commerce retail sales. The term ”Fast Fashion” describes the retail strategy of adapting merchan-dise assortments to current and emerging trends as quickly and effectively as possible. Even if this concept is now mostly associated with large retailers as Zara and H&M, one of the first brands adopting this strategy well before the term was coined, was the Italian Benetton. This company gave birth to an innovative organisation of the production process which directly followed market demand, allowing them to promptly satisfy customer request, with
an immediate response even to sudden increases in demand, thank to a flex-ible, coordinated and integrated production. Fast fashion retailers have, in fact, replaced the traditional push model – in which the strategy is based on the prediction of upcoming trends by designers – with an opportunity pull approach, in which retailers respond to customer demand trying to get the right product in the market within just a few weeks, versus an industry average of six months [Hansson, 2011].
Besides this deep change in the management model, the whole Retail busi-ness - not only the Fashion and Apparel one - is now facing a new tremen-dous challenge: surviving in a model that includes the Internet [Shoenbach-ler and Gordon, 2002]. As online purchasing is continuing to grow, the future of pure brick-and-mortar retailers is called into question. Despite physical stores still remain at the heart of the customer relationship, in fact, online and mobile sales appear to rule [Brown et al., 2013]. Then, in the last decade, the major retailing company are converging towards the ”Omni-Channel” strategy, i.e. a synchronized operating model in which all company’s channels - traditional stores and mobile channels - are aligned, allowing companies to meet customers’ requirements and to be more com-petitive. In other words, connected customers can shop for and purchase the same items across many different channels: in a physical store, on their home or laptop computers, on their connected mobile devices. This allows them to shop online for virtually anything, virtually everywhere [Solutions, 2012].
In this complex and dynamic context, the present thesis has the main aim of proposing a tool to support companies of this sector in the decision making process of definition of the operations plans long before the beginning of the sales season. The research work is organised as follows. Chapter 1 gives an overview of the main challenges of a typical demand-driven Supply Chain in the Fashion Retail Industry, focusing on the characteristics of products and market, and introducing the Fast Fashion and Quick Response Models. In Chapter 2, after the definition of the process flow, from the design of the clothing item to its introduction in the market, a detailed Risk Analysis allowed us to identify the most critical areas and processes, and the main
target that managers try to perceive. In particular, it emerged that main aim of fashion business is the correct Time Management, intended as the ability of being responsive to market fluctuation. To perceive this goal, the Replenishment was identified as the most crucial process when managing an extended network of direct-operated or franchising mono-brand stores. The problem of allocating inventory from a central warehouse to several locations satisfying separate demand streams is, in fact, principally aimed at dynamically optimizing stores assortment, trying to ensure high product availability and to minimize overstock or out of stock events.
Those two problems are separately faced. The Time Management is anal-ysed in Chapters 3, 4 and 5 by proposing a framework for the optimisation of performances for the traditional pure brick-and-mortar case, and then for the Omnichannel strategy. In particular, Chapter 3 describes the con-ceptual framework, in Chapter 4 the simulation model is defined and the results are analysed, while Chapter 5 evaluates the impact that the adoption of this new integrated strategy may have on a traditional Supply Chain. In the end, in Chapter 6, a heuristic optimisation algorithm, called the Bees algorithm, is adopted to solve the Replenishment problem.
Chapter
1
Fashion and Apparel Industry:
Supply Chain Characteristics and
Challenges
Contents
1.1 Introduction . . . 23
1.2 Complexity of the fashion world . . . 24
1.3 Market segmentation . . . 27
1.4 Demand Driven Supply Chains . . . 28
1.5 The growth of Quick Response and Fast Fashion 31
1.6 Conclusions . . . 33
1.1
Introduction
Fashion can be seen as the point where the material product, in the form of clothes, meets the immaterial aspect of what looks good at a given point in time. In other words, there is the physical part of the product, that is a garment, which is enriched by symbolic and immaterial value resulting in fashion. One of the main issue is its volatile nature: to be defined ”fashion”
it must change [Aagerup, 2011]. This peculiarity makes the Fashion and Ap-parel industry a very dynamic sector, subject to constant and quick changes thus making time a crucial variable within competition. In addition, volatile markets and unpredictable demand are leading to the adoption of specific Supply Chain models which try to manage the complexity in this sector. In this complex context, the main challenge is gaining value through supply chain management, allowing to respond quickly, efficiently and with flexi-bility to demand fluctuations [Battista and Schiraldi, 2013]. This obviously requires [Masson et al., 2007]:
- market sensitivity, which guarantees connection to the customer and ca-pacity to capture trends as they emerge;
- integration with all the other Supply Chain actors sharing real-time de-mand data;
- process alignment, both within the company and externally with upstream and downstream partners.
This Chapter, then, describes the main characteristics and challenges of this particular industry analysing customers, products segmentation and Supply Chain models and drivers.
1.2
Complexity of the fashion world
The Fashion and Apparel Industry represents a particular example of the manufacturing Industry and shows several characteristics that make it diffi-cult to manage its productive and logistic process using traditional methods. In particular, three main issues were identified for this sector [Christopher et al., 2004]:
• Short Product Life Cycles: the product is designed to capture the mood of the moment, then, compared to other markets, fashion sales trend has a rapid growth, a peak of popularity and immediately a stage of decline or even rejection of the product by the market (Figure 1.1).
Figure 1.1: Product lifecycle in the fashion industry compared to other markets [Bandinelli et al., 2011]
Since products have a limited time in the market from their introduc-tion to decline, retailers have to be more efficient in the replenishment process [Barnes, 2009].
• Unpredictable and Volatile Demand, since it is driven by extremely unstable phenomena, such as weather, movies, sports, etc. Consumer demand could, in fact, completely change in a short time range because an increasing star leads a new fashion trend [Wang et al., 2012b], then nobody can ever tell if a fashion item will be successful on the market; • Impulsive Purchasing Behaviour : given the fickle nature of fashion shoppers and the impulsiveness that surrounds their purchase be-haviour, retailers have to arrange layouts and displays items in an appropriate way in order to manipulate purchasing decisions [New-man and Foxall, 2003]. These considerations point out the need to ensure high availability, not only in terms of product range but also in terms of sizes and colours.
Other characteristics highlighted by several studies in this sector are:
• Extremely Wide Product Variety [Vaagen and Wallace, 2008]: it comes to thousands of Stock Keeping Units (SKUs) considering variety of sizes and colours, then production lines have to manage highly variable small batches [De Carlo et al., 2013];
• Demand-Driven Supply Chains [Walters, 2006]: in recent years, con-sumer expectation has increased asking for speed, variety and style at low prices;
• Long and Complex Supply Chains, which often include suppliers lo-cated in several different Countries [Bruce et al., 2007]. In fact, off-shore transfer of the labor intensive stages of the supply chain to low-cost countries, has been one of the favourite options of companies in the industrialised countries to offset some of the risks in the volatile world of fashion [Fernie and Azuma, 2004]. This contributes to highly increase lead time even reducing labor cost;
• Long time-to-market, there is almost a year lapse from the definition of the clothing item to the delivery to the stores. Table 1.1 shows an example of a Gantt chart for the production and supply process in the winter season and highlights that the development of the collec-tion starts in October while the first sales in the stores are recorded in the following September. It means that wholesalers and stores de-fine their orders before the previous season is over and therefore the level of unsold stocks is not known yet [Forza and Vinelli, 2000] thus contributing to enlarge demand uncertainty [Tiaojun and Jiao, 2011]; • New Product Development (NPD) Process is long and not always suc-cessful. This activity usually begins two years before production [Bandinelli et al., 2013] and not all items that come out from this process are introduced into the market. The process is difficult to standardise and control thus generating costs of development and pro-totyping that cannot be recovered by sales. In fact, pattern book only represents the collection idea but items which are not successful during presentation will not be produced.
From all these considerations, it becomes clear that non-value added phases represent an important part of the production process, making lo-gistic costs significantly impact on the total cost of products. If this cannot be a critical issue for companies working in the luxury market, given the
Table 1.1: Example of a Gantt Chart for the Production and Supply Process in the Fall/Winter Season
Steps/Months 10 11 12 1 2 3 4 5 6 7 8 9 10 11 12 1 2 3 Development of collection
Presentation Sales to wholesalers Raw material purchasing Production
Deliveries to stores Selling Season
very high contribution margins that they can achieve, for large mass produc-tions, instead, these costs may critically affect on profits, defining company’s economic success or failure.
1.3
Market segmentation
Given its great size, the Clothing Retail Industry can be internally divided into several segments according to different variables. One of the most commonly used criteria for differentiating market and customers is the price. According to this, we can distinguish [Bandinelli et al., 2014]:
• Haute Couture: are luxurious clothing items, tailored for each cus-tomer and made of fine craftsmanship garments. Cuscus-tomers buy haute couture for the emotional value of having an exclusive designer’s name [Kim and Mauborgne, 1998];
• Pret-`a-porter (ready to wear): it represents the transition from handi-craft tailoring to industrialization and includes prestigious brands and their core collections;
• Diffusion: it is defined by a high qualitative level and a medium stylis-tic content. Through the development of these lines, luxury brands created the so-called “massclusivity” phenomenon [Zegheanu, 2013], which is a category of mass market consumers who feel they are pur-chasing something special for a price slightly higher than the high street;
• Bridge: while maintaining some stylistic content, products of this segment have prices affordable to most people;
• Mass Market : it targets a wide range of consumers and is constantly growing. It is defined by non exclusive items with low prices and low stylistic content.
From a consumer perspective, in addition to gender and age, we can dis-tinguish the following segments [Richards and Sturman, 1977, Corporation, 2010, Jackson and Shaw, 2009] :
• Conservative: shoppers who prefer a more traditional look, buying products that will wear well and last in terms of style and durability; • Fashion Forward : consumers who are looking for the newest trends
and styles;
• Comfort Seekers: costumers who seek value and comfort rather than fashion;
• Brand-Conscious: consumers who are very likely to wear current-vogue branded merchandise;
• Price oriented : costumers who look for low cost clothing items regard-less of the brand and the fashion content.
It is clear that companies have to clearly choose their target market, in terms of customers and products, to consequently define the best business strategy.
1.4
Demand Driven Supply Chains
A traditional Supply Chain in the Fashion Industry (Fig. 1.2) involves [Coraggia, 2009]:
- Fibres suppliers: they represent the first ring of the chain. The fibre is the smallest component of fabrics and gives them color and weight;
Figure 1.2: A traditional Supply Chain in the Fashion Industry
- Textile producers: they prepare different types of raw materials for further processing in order to obtain yarns, fabrics and textiles;
- Apparel manufacturers: they perform activities as cutting and sewing in order to tailor the final clothing items;
- Warehouses: they have the main purpose of receiving final products from suppliers, often located in far away countries, and distribute them to stores and clients according to their specific orders;
- Retailers: they represent the final ring of the supply chain and sell clothing items to final customers trying to satisfy their demand.
Given the characteristics of market and products, these value chains cannot simply follow a static traditional model. According to Fisher [1997], in fact, products can be divided into two main categories: either primar-ily functional or primarprimar-ily innovative. While functional products, such as grocery, normally do not change quickly over time and have a stable and predictable demand, innovative products, like fashion apparel, are charac-terized by newness, greater variety [Vaagen and Wallace, 2008] and customi-sation [De Felice et al., 2012] which needs low production volumes [De Carlo et al., 2013] and flexibility and makes demand unpredictable [Wang et al., 2012b]. In addition, their life cycle is short [Barnes, 2009], because as im-itators erode the competition advantage that innovative products enjoy, companies are forced to introduce a steady stream of newer innovations. With these peculiarities, Fashion & Apparel products require a fundamen-tally different Supply Chain than do stable, functional products. While an efficient Supply Chain strategy with focus on cost minimization should be used for functional products, a responsive/demand driven strategy with
focus on products availability, matching the marketplace with customer de-mands, could best fit innovative products [Lam and Postle, 2006]. A demand driven Supply Chain involves transforming the traditional chain configura-tion into an integrated multitier supply network, eliminating informaconfigura-tion latency. This may reduce operating costs and improve profitability and cus-tomer service [Gupta et al., 2015] thank to a real-time information sharing on demand and inventory levels. Through a demand driven approach, that enables companies to react quickly and effectively when unexpected changes arises [Budd et al., 2012], it is possible to:
- improve fill rates and reduce out of stocks thus increasing revenues and recoverable sales;
- reduce inventory levels as demand uncertainty is reduced by the reduction in information latency;
- reduce supply disruptions thank to real-time visibility to the complete demand/supply situation.
In this context, both Lean and Agile models must be introduced in or-der to improve supply chain management performances. These two models, whose characteristics are summarised in Table 1.2, allow managing the re-quest for speed and efficiency whilst responding with flexibility to demand fluctuations [Battista and Schiraldi, 2013]. With the term ”Lean” we mean a supply chain able to meet strict requirements in terms of delivery times, order completeness and accuracy [Bruce et al., 2007], working on forecasts and inventory-focused information exchange. On the other hand, an ”Ag-ile” Supply Chain is able to thrive in an environment of rapid and unpre-dictable changes and to respond to actual changes in demand [Christopher et al., 2004]. An hybrid strategy, then, may take one of several approaches [Digest, 2006]:
- Using make-to-stock/lean strategies for high volume, stable demand prod-ucts, and make-to-order/agile for everything else;
- Have flexible production capacity to meet surges in demand or unexpected requirements;
Table 1.2: Comparison between Lean and Agile Supply Chain models [Bhatia, 2014]
Lean Agile Products Functional Innovative Demand Predictable Volatile Product life cycle Long Short Product Variety Low High Customer drivers Cost Assortment Forecast approach Calculative Consultative
- Use of postponement strategies, where ”platform” products are made to forecast, and then final assembly and configuration done upon final cus-tomer.
1.5
The growth of Quick Response and Fast
Fash-ion
To respond to all the issues illustrated in the previous paragraphs, since the 1980s various management techniques, specific for the fashion and clothing industry have arisen. The increasing demand for fashion products instead of basic/classic ones, the increasing number of mid-season collections in or-der to expand product offer and the introduction of techniques that allow the reduction of lead Time [Fairhurst and Bhardwaj, 2010], such as Quick Response (QR) and Fast Fashion (FF), deeply changed this sector.
These new management models clearly differ from the traditional one which is based on planned manufacturing (Figure 1.3). It lies in producing ac-cording to orders received during the presentation of collection (”Orders in Hand”), before the sales season. This traditional management model in-volves a single collection for the whole season and it is still widely employed by luxury brands because the high stylistic and material content of the clothing items requires to produce almost exclusively based on consolidated orders.
Quick Response and Fast Fashion instead, try to respond much more quickly to market needs by planning production on the effective demand
Figure 1.3: Quick Response and Fast Fashion compared to the traditional manage-ment approach [HermesLab, 2009]
recorded in stores.
Quick Response was firstly introduced in the US in the 1980s to speed up the response time across the supply chain from a customer choosing a fashion item to its replenishment in the stores [Fernie, 1994]. Its total application involves on-line electronic communication of sales data from re-tailers to merchandise vendors and the prompt supply of goods needed to return the inventory to previously defined levels [Fiorito et al., 1995]. This method provides several competitive advantages for all supply chain’s ac-tors [Birtwistle et al., 2006]. From retailer’s point of view, Quick Response systems, through collaborative partnership with the suppliers, allow the re-duction of inventories, buying mistakes and lead time thus lowering costs and improving profitability [Birtwistle et al., 2007]. Quick Response is not only used in the Fashion & Apparel sector but, since it is particularly suit-able to market with high volatile demand, long replenishment lead time and short life cycle products, it is crucially important also in industries such as consumer electronics and toys [Sethi and Tsan-Ming, 2010].
The development of Fast Fashion in the 1990s and its wide use, lead to over-coming the concept of ”season” through the continuous increase of number of annual collections to be presented to customers and delivered to the Point of Sales (POS). This is possible only thank to a rapid reaction to market impulses, very short product life cycles, continuous assortment renewal, fast
inventory turnover in the stores as well as affordable processes and attrac-tive design [Scozzese, 2012]. In other words Fast Fashion systems combine short production and distribution lead times with highly fashionable prod-ucts [Cachon and Swinney, 2009].
Other models that try to combine the classical planned manufacturing with Fast Fashion systems are called ”semi-planned”. In the most common case, this process involves two biannual collections integrated with ”fast” produc-tion and several replenishments during the selling season with the purpose of increasing customer satisfaction [Giancola, 1999].
It is clear that organizational solutions of the supply chain are not restricted to those previously described, but there are a multitude of hybrid solutions used in current practice which try to achieve economic efficiency. In fact typ-ically, neither Fast Fashion or planned manufacturing applies to the whole product range in stores; nearly 80% of goods may be core and basic lines managed in the traditional manner, with fast fashion accounting for up to 20% with high fashionable items or ”capsule collections”.
1.6
Conclusions
Effective management to achieve competitive advantages includes the abil-ity to manage a complex network as a whole. In the particular context of the fashion industry, the operational strategy consists of ordering, well in ad-vance, a large number of different references, each having a relatively short life cycle of only a few weeks. However, on the contrary, a fashion supply chain must respond quickly to market changes in order to meet customers requests and increase profitability. These opposing requirements, force the management to face several decision making problems in order to find the best definition and mix of all the variables, such as the definition of the Seasonal Budget, the selection of the items composing the collection, the choice of the quantities to be purchased etc., with the aim of maximising profits and customer satisfaction. In this context, next chapter will anal-yse into detail the whole traditional fashion supply chain focusing on the
identification of the main possible risk factors. This study will allow us to identify critical areas that will be better analysed following.
Chapter
2
Supply Chain Risk Assessment:
Understanding main targets and
critical areas
Contents 2.1 Introduction . . . 36 2.2 Risk sources . . . 38 2.3 Research Methodology . . . 39 2.3.1 Process Analysis . . . 422.3.2 Identification of Main Targets . . . 45
2.3.3 Identification of Risk Factors . . . 47
2.3.3.1 Market driven orientation risk factors . 47
2.3.3.2 Cost reduction risk factors . . . 51
2.3.3.3 Brand internationalization and market
expansion risk factors . . . 54
2.3.3.4 Environmental sustainability risk factors 55
2.3.4 Clusterization . . . 59
2.3.5 Network Definition . . . 60
2.3.6 Pairwise Comparison . . . 60
2.3.7 Prioritization . . . 66
2.4 Conclusions . . . 70
2.1
Introduction
According to the United States Fashion Industry Association [Sheng, 2014], the second top ranked fashion industry challenge is ”managing supply chain risks” immediately after ”increasing production or sourcing costs”.
The increasing trend towards globalization and outsourcing is, in fact, lead-ing many industrial sectors to entrust relevant parts of their business to suppliers often located in developing countries. This phenomenon is caus-ing loss of control and of full visibility of the supply chains, thus increascaus-ing risks connected to any possible changes or disruptions.
In the highly dynamic context of the Fashion and Apparel Industry, the proper assessment and management of the supply chain risks can be crucial for its efficiency. For example, due to the adoption of traditional long-term demand forecasts, any change or fluctuation may lead to over-stock – pro-ducing excessive quantities that quickly become obsolete or out of fashion – or stock-out – undersizing actual sales volume resulting in an image damage and lost sales. Another possible risk is given by the off-shoring trend which, from one side, ensures a substantial cost advantage but from the other, contributes to lengthen geographical distances and lead-time. This leads to the extension of replenishment times and consequently to the difficulty of quickly respond to any delay along the chain or change in market demand. Despite fashion retail is receiving increasing researcher’s attention, in partic-ular concerning supply chain management [Ngai et al., 2014, Iannone et al., 2015, Brun et al., 2008], literature does not show relevant studies related to risk assessment and management. Only few works have been proposed in last few years:
- Venkatesh et al. [2015] use the Interpretative Structural Modelling (ISM) to establish the interdependencies between the risks associated to the apparel retail supply chains in India;
- Shen et al. [2014] and Chiu and Choi [2013] only focus on the financial aspect of risk management;
- Khan [2013], through a case study, explores how design is used as a strate-gic tool for managing risks in fashion retail;
- Xiaofen and Wei [2012] identify four main risk areas related to external environment, customer and suppliers cooperation and to the enterprise itself;
- Liljander et al. [2009] relate product quality to functional and financial risks which cause a reduction in store brand value;
- Aghekyan-Simonian et al. [2012] analyse the perceived risks connected to online purchases which are mainly related to brand image and online store image;
- Chen and Xiao [2015] evaluate how the entity of the disruption risk influ-ence outsourcing strategies.
Other research works, then, analyse risks connected to outsourcing [Hon Kam et al., 2011], risks related to social and environmental aspects [Freise and Seuring, 2015] or risks that a company may encounter when implementing green initiatives [Wang et al., 2012b].
It is clear that none of them proposes a detailed and structured analysis of the main risk factors connected to each supply chain process. Then, based on these considerations, this chapter wants to fulfil this gap and try to iden-tify the main risk factors connected to each process and to each objective of a typical Fashion supply chain, by defining a complete and general map. Then, thank to a deep analysis of both current practice and literature, and through the use of the Analytic Network Process (ANP) approach, a prior-ity list is defined. In this list the most crucial area on which to focus the attention for further analysis are identified.
2.2
Risk sources
The term ”risk” refers to the possible occurrence of a negative event, i.e. an adverse deviation from a foreseen situation [Borghesi and Timidei, 1998]. It is clear, then, that risk sources do not exclusively reside in the effects of external events, such as legal restrictions or natural disasters, but also in the impact of internal changes of strategies, business models and interaction with the actors of the supply network [Tang, 2006].
To assess a company’s risk profile, it is useful to highlight the main risk sources within the supply chain. They can be grouped into five categories, as shown in Figure 2.1 [Mason-Jones and Towill, 1998, Christopher and Peck, 2004]:
1. Risk external to the main company and internal to the Supply Chain a) Supply Risk : includes those elements disturbing material and
in-formation flow between main company and upstream enterprises [Zsidin, 2003]. It depends on the structure of the supply network since risks increase if the company is dependent from few key sup-pliers, if it works in a global sourcing perspective, etc.;
b) Demand Risk : includes any possible interference to the material and information flow between central company and the market, across all the other enterprises between them [Svensson, 2002]. Typical risks are connected to the volatility of demand or bull-whip effect.
2. Risk internal to the main company and to the Supply Chain
a) Process Risk : the term ”process” refers to the sequence of manage-rial and value added activities internal to the company. These pro-cesses are directly dependent on company’s assets and on reliability of transports and communications. The risk is then connected to the interruption of these processes;
b) Control Risk : control systems are the set of procedures that rule the processes and the relationships with other network’s actors.
Figure 2.1: Risk sources in the Supply Chain
This risk is internal to the company and related to procurement, production or inventory policies.
3. Risk external to the Supply Chain
a) Environmental Risk : is related to external factors which result from economic, socio-political, technological or natural events.
It is important for managers to understand that the risk profile is di-rectly influenced by strategic decisions. Therefore, rather than catalogue every possible risk, the first step of a proper risk management is the analysis of internal processes in order to isolate most critical and relevant weakness factors. After that, it is possible to monitor external environment in order to detect warning signs and, consequently, develop mitigation plans or al-ternative strategies. Main purpose is to strengthen the ”resilience” of the operational structure, which is the ability to quickly recover after an adverse event which disturbs or interrupts the normal activity of the supply chain.
2.3
Research Methodology
Main purpose of this chapter is to assess and prioritize the main risk factors related to each working phase of a fashion company, in order to the identify the most critical area that will be better analysed later in this thesis. Operational risk is defined as ”the risk of loss resulting from inadequate
or failed internal processes, people and systems or from external events” [on Banking Supervision, 2004]. Then, in this context, the Analytic Net-work Process (ANP) approach [Saaty and Vargas, 2006] was adopted as a tool for risk prioritization based on experts’ decision. The ANP represents a generalization of the Analytic Hierarchy Process (AHP) [Saaty, 2001]. Many decision problems, in fact, can not be hierarchically structured be-cause they involve interactions and interdependencies of several elements at different levels. The applied method, through a network-decision struc-ture and not a simple hierarchy, can handle complex problems providing an easy and accurate way to analyse tangible and intangible factors. This part of the research work was conducted in cooperation with a team of ex-perts composed by 12 managers from 6 different companies operating in the Italian Fashion and Apparel Industry. In particular, the team of experts involves: 3 CEOs, 3 purchasing managers, 3 marketing and sales managers, 1 product development managers, 2 planning and scheduling managers. In addition, the study is supported by a deep literature analysis involving more than 60 papers from the most important journals dealing with the topics of supply chain risk management, retailing and operations management in the Fashion and Apparel Industry (e.g. Int. J. of Production Economics, J. of Retailing and Consumer Service, European J. of Operational Research, Int. J. of Logistics Management, etc.).
The process flow of the adopted methodology is shown in Figure 2.2. In order to better understand the context and the problem, first step of the work was the Process Analysis (ref. section 2.3.1) also including mate-rial and informative flows typical of a fashion retail supply chain.
The second step, where the ANP approach starts, is represented by the Main targets identifications (ref. section 2.3.2), for the selection of the fo-cus and of the overall objectives of the entire supply chain.
Thank to the results coming from these first two steps, we were able to break this complex system into its constituent parts and to perform the Risk factors identification step (ref. section 2.3.3). More than 90 risk fac-tors were identified and classified according to both targets and processes. Given the high number and according to ANP approach, all the risk factors
were grouped into clusters (Clusterization - ref. section 2.3.4) according to similarity criteria. Then, in the Network Definition step (ref. section 2.3.5) interdependencies between factors are defined: they include inner (within the same cluster) and outer (among different clusters) relationships. While a hierarchy is a linear to down structure, a network instead develops in all directions and may show cycle between different clusters and loops within the same cluster. In the end, all the clusters and all the connected risk factors are compared (Pairwise Comparison - ref. section 2.3.6) thank to a questionnaire survey based on experts’ decisions in order to determine relative priorities among elements.
Final goal of the ANP approach is then reached with the Prioritization (ref. section 2.3.7) of the list of potential risk factors based on their relative importance in the organisation.
2.3.1 Process Analysis
First step of the approach was the definition of all the processes, material and informative flows typical of the fashion industry. In this particular study, we are referring to companies that operate with an extended network of retailers composed by:
- wholesalers: they are supply chain actors that directly buy products from the main company during the sales campaign and then sell them to multi-brand stores. They represent an intermediate ring between producers and market;
- franchising stores: they are mono-brand stores not directly managed by the company. They are allowed to use company’s brand and distribute its products by directly buying them. It means that all the risks connected to under- or over-stocks are borne by the store itself;
- direct-operated stores: they are stores directly managed by the main com-pany. It means that all the decisions, and consequently relates risks, on purchasing and distribution are centralized;
- factory outlet stores: in these direct-operated stores, the company sells previous season’s unsold stocks at significantly discounted prices. They allow to absorb the risk of over-stocks.
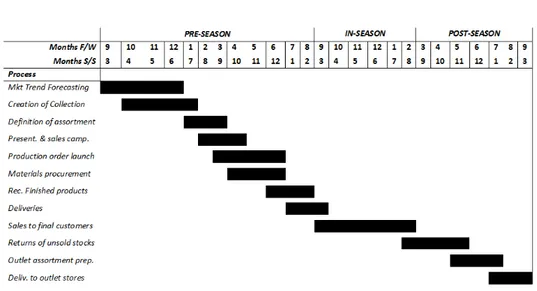
All the main processes performed in a typical Fashion Retail Supply Chain are listed and described in detail in Table 2.1. The table also re-ports the indicative time range during which each of these processes is performed for the two traditional selling seasons: Fall Winter (F/W) and Spring/Summer (S/S). This timetable is graphically represented in the Gantt chart in Figure 2.3.
The processes are then divided into:
1. Pre-Season phase: as the name implies, this phase involves all the activities performed before the beginning of the real sales season, starting from the creation of the collection from the Styling Office and ending with the deliveries of the finished product to clients and stores;
2. In-Season phase: it starts with the first sales recorded in the stores and involves all the sales season, including discounts period until the shipment of unsold goods to the central warehouse;
3. Post-Season phase: it involves all the activities necessary for the cor-rect management of the unsold items and their delivery to factory outlet stores.
Table 2.1: Main processes in a Fashion Retail Supply Chain
Time Range Process Description F/W S/S PRE-SEASON Sept to Dec Mar to Jun Market trend Forecasting
In this step, several professional profiles are involved: fashion de-signers, style consultants, cool-hunters, fashion bloggers and re-porters. Their main task is to analyse and forecast market trends for the following season according to main fabrics fairs, emerging street style and movie or pop star trend.
Oct to Jan Apr to Jul Creation of Sea-sonal collection
It is a highly time-consuming activity and provides as output a wide variety of clothing items, but not all of them will be then produced [Bandinelli et al., 2013]. It is a process that can be hardly ratio-nalised from a management perspective since the company needs to offer a wide variety to customers during the sales campaign. Jan to Mar Jul to Sept Definition of main assortment
It is the stage of selection of the items that mainly express the mood of the seasonal collection. They will be surely recommended to the wholesalers and shown in the most representative stores. This selection is responsibility of the Commercial Department and Styling Office.
Table 2.1: Main processes in a Fashion Retail Supply Chain Time Range Process Description F/W S/S Feb to Apr Aug to Oct Collection presen-tation and begin-ning of sales cam-paign
The collection is presented in the most important sector fairs
(Mi-lano Fashion Week, Premi`ere Vision in Paris, etc.) and after that,
the sales campaign can start. In this period, the company can
record orders from wholesalers. All the clients undergo a financial assessment and then their orders can be approved after the solvency check. Most of these orders may be affected by some changes even after conclusion of this campaign.
Mar to Jun Sep to Dec Production orders launch
This phase is almost contemporary to the previous one. Orders
already forwarded to production for which there is an insolvency problem, are hold as ”suspended orders”. They will be not deliv-ered to the client but will be made available for other clients’ orders even during the selling season.
Apr to Jun Oct to Dec Materials procure-ment and dispatch
to production
plants
In this study we suppose that supply of fabrics and accessories is di-rectly borne by the main company. It may happen that this process is, instead, performed by suppliers according to customer’s specifi-cations. In this phase, material may not pass through the central warehouse but may be directly delivered from fabric’s suppliers to producers. Jun to Aug Dec to Feb Finished products receiving
When receiving finished products in the central warehouse or lo-gistic center, two main checks are performed: (i) quantity check : delivery notes must match with actually received items; (ii) quality check : through a random check warehouse staff is able to iden-tify possible defects on an entire batch of items. Specific defects on a single item, such as a missing button, can only be found in stores, thus increasing the possibility of returned goods. In addi-tion, since loading/unloading processes are not automated in most cases, during this phase warehouse manpower can be overloaded, thus leading to a lengthening in material handling operations and possible delays in deliveries to customers.
Jul to Sep Jan to Mar Deliveries to cus-tomers and stores
The personalized kits of items to send to stores and clients are prepared by warehouse staff or, in some cases, by producers them-selves. From one side, it results in a leaner material handling pro-cess, but on the other, it leads to not optimised transports, since some packages are half-empty.
IN-SEASON Sep to Feb Mar to Aug
Sales to final cus-tomers
It is the actual sales season. During this period no other production orders are launched. In order to meet actual demand, company can ship to stores on-hand inventories, such as those items stuck in the warehouse due to the ”suspended orders”. In addition, movements of clothing items from one store to another are also allowed.
POST-SEASON Feb to May Aug to Nov Returns of unsold stock from stores and clients
At the end of the sales season, the central warehouse receives un-sold stocks both from stores and wholesalers according to specific commercial agreements. This step is similar to the ”Finished prod-ucts receiving” one since both quality and quantity check must be performed and the same overloading problems may arise. May to Jul Nov to Jan Outlet assortment preparation
Returned items must be refurbished and priced with outlet
dis-counts. In some cases, in order to offer a wider assortment and
attract customers, the company launches a specific production of items destined to outlet stores, using left-over fabrics and simple manufacturing. Jul to Sep Jan to Mar Deliveries to out-let stores
This step is similar to the ”Deliveries to customers and stores” one even if quantities to handle are significantly lower.
Figure 2.3: Example of a Gantt Chart for the main processes in the Fashion Retail Industry
2.3.2 Identification of Main Targets
Main critical issue of the fashion industry lies in the ability to promptly capture customers tastes and transfer them into successful products. This implies trying to meet customer requests of a large market share offering a wide variety of products. At the same time, it is necessary to reduce time-to-market and whole logistics costs in order to avoid a strong price markdown at the end of the selling season due to rapid changes in trends. Based on these considerations, we identified 4 main targets, 2 of which have 2 sub-targets, as following reported:
1. Market driven orientation
The primary purpose of a supply chain is to satisfy customer’s demand. According to it, the whole fashion supply chain is driven by real and current market needs [Walters, 2006], releasing from the total dependence from demand forecasts. The attainment of this target depends from two sub-targets:
a) Market sensitivity improvement : it is intended as the ability to recog-nise market needs, thank to reliable demand forecasts, and to quickly respond to demand changes;
b) Brand attractiveness: it is defined as the intrinsic capacity of a brand to attract market interest. In our context, the company experiences this attractiveness through stores and clients network using their abil-ity of attracting customers.
2. Cost reduction
While the previous target mainly focuses on supply chain effectiveness, the cost and waste minimization refers to the efficiency of supply chain activities. The target of profit maximization from a production/logistics perspective results, in fact, in cost reduction of all the activities along the value chain. This is strictly connected to:
a) Time to Market : refers to the correct time management and possible reduction of all supply chain processes. Any delay , in fact, may cause a late launch of the seasonal collection or late deliveries to stores and wholesalers, and the consequent loss of market share;
b) Material and informative flow management : focuses not only to quan-tities and types of items in transit along the chain but also to correct data management and exchange between actors.
3. Brand internationalization and market expansion
It refers to the entry in new foreign market and subsequent expansion, and involves decisions regarding marketing strategy and retail format, product, and service mix appropriate to a foreign country [Picot-Coupey et al., 2014]. The expansion process is pursued in already consolidated markets as well, trying to control a wider market share.
4. Environmental sustainability
Fashion and apparel companies recognized as big source of pollutants, and the growing number of environmental conscious consumers are rais-ing the attention on environmental sustainability and corporate social responsibility aspects. This is leading companies to use recycled fab-rics and to adopt new programs for monitoring environmental impact of production and distribution.
The choice for the above mentioned targets has been confirmed by lit-erature, as shown in Table 2.2, which reports the references for each of the selected supply chain targets.
Table 2.2: Literature confirmation for the selected supply chain targets
Target Reference Market driven
orientation
Market Sensitivity Im-provement
Cillo and Verona [2008]
Carniene and Vienazindiene [2014] Brand attractiveness Heuer and Brettel [2015]
Tajuddin et al. [2014] Cost reduction Time to Market
De Toni and Meneghetti [2000] Heckmann et al. [2015] Material and
Informa-tive Flow Management
Marufuzzaman and Deif [2010] Tang and S.N. [2011]
Brand internationalization and market expansion Guercini and Runfola [2010] Caniato et al. [2014] Environmental sustainability
Li et al. [2014] Caniato et al. [2012] Yonggjian et al. [2014]
2.3.3 Identification of Risk Factors
The core step for the definition of the most critical areas is the identification of the risk factors for all the supply chain processes. They are characterized in reference to each company’s target previously introduced and described in detail as follows. This analysis was conducted in cooperation with a team of experts, as already reported in section 2.3, and is supported by a deep literature study. In the following sections, the risk factors identified by the experts are listed and, when detected, the literature reference is reported.
2.3.3.1 Market driven orientation risk factors
The ability to catch customer’s tastes is expressed by a reliable demand forecasting process and by a reactive approach to sudden changes in demand during the selling season. Given the need to draft forecasts well ahead of the sales season and given the uniqueness of the fashion products whose success depends on cultural and emotional aspects, elements that may lead to errors and risks are several and mainly related to the Pre-Season phase.
These are:
- long-term horizon for the analysis and forecasting process [Forza and Vinelli, 2000], which makes it difficult to predict consumers behaviour; - inefficient item classification: since it is difficult to achieve high
forecast-ing accuracy for sforecast-ingle items, it is necessary to group them into product categories [Thomassey and Hapiette, 2007] (for example ”clothing” or ac-cessories”) in order to better reflect consumers purchasing behaviour; - unstable demand : purchases are impulsive [Park et al., 2012], driven by
emotionality and subjectivity leading to high volatility and unpredictabil-ity of demand;
- market heterogeneity, i.e. high consumer segmentation [Brito et al., 2015] for each sales market, for example based on socio-demographic aspects; - different purchase behaviour in each area: given the breadth of the
inter-national market, cultural differences between different Countries, or even different areas in the same Country [Iannone et al., 2013], may result in a different perception of the brand value;
- competitive initiatives, such as more frequent collection launches or mar-keting campaigns;
- lack of historical data for fashion items, [Thomassey, 2010] which are new products introduced in the seasonal collection. For these items we cannot draft forecasts according to real historical data since they are not available; - Absence of in-store marketing analysis, such as consumers interviews, in order to test customer satisfaction and their potential intention to come back into the store [Soderlund et al., 2014];
- No comparison with fabric suppliers to share information on trends for the new season;
- Many actors between company and market : an extended network of whole-salers and distributors makes it more difficult to have quick and reliable feedbacks on final users’ purchasing behaviour;
- Bullwhip effect, due to poor market visibility, lack of feedback and in-formation sharing between supply chain actors and uncertainties [Mi-ragliotta, 2006]. This leads to high inventory levels to cover demand variability;
- ”on-off” purchases , referring to a situation of total absence of logistics-productive integration or cooperation with suppliers, neither in demand forecasting nor in collection design;
- Different contractual terms for returns from wholesalers, which compli-cates the definition of product assortment to send to outlet stores.
A company reactive to changes in real demand must rely on a flexible suppliers network and must be constantly updated on actual sales status, allowing to promptly identify any possible deviations. These concepts are outlined in the following risk factors:
- lack of information from wholesalers on actual sales status for each item; - few different suppliers: a broader suppliers network may allow to respond
quicker to an order by selecting the appropriate supplier;
- exclusive use of ”up-front” buying, i.e. purchasing and reception of the total product quantity before the beginning of the sales season, by exclu-sively basing orders on forecasts;
- No use of real demand as replenishment driver : retailers do not usually record invisible demand [Bensoussan et al., 2015] and this does not allow to replenish stores with actually requested products;
- No sold/foreseen deviation analysis, which does not allow to adjust orders and replenishments plans according to actual demand;
- Replenishments solely based on stocks: this implies that no other orders are launched during the seales season but the company responds to any possible change in market demand with on-hand inventories, which may represent ”orders suspended” or returned goods.
From Brand Attractiveness perspective, instead, the proper management of the stores network may determine the success of the commercial campaign and define the reputation perceived by clients. Then, crucial factors are:
- Many new product launches failed, i.e. products designed by the Styling Office that do not meet customers taste;
- Excessive focus on continuative items, implying lack of attention in prod-uct innovation [Cillo et al., 2010, Unay and Zehir, 2012] and in following trends. This may lead to always offer similar items over time;
- Customization in international markets, given the important cultural di-versity between Countries, characteristics and practices of each Country must be taken into account [Caniato et al., 2014];
- Design of only two collections a year, without infra-seasonal ”flash” col-lection that may allow to differentiate offer and enlarge product variety [Mehrjoo and Pasek, 2014];
- Poor diversification of sales channels, intended as different kinds of stores, location or purchasing paths (e.g. e-commerce, buy online-pick up in store, buy in store-home delivery, etc.) [Lanzilotto et al., 2015];
- Wholesaler’s reputation inconsistent with brand image and unable to at-tract customers from the target market;
- Deviation between offered and expected product quality, which may lead to customer dissatisfaction;
- Limited On-Shelf Availability, caused by under-estimation of demand, may lead customers to hopefully purchase another product in the same cate-gory [Tan and Karabati, 2013] or may lead to a lost sale ;
- In-store shopping experience, which provides customer with more leisure, interaction with product information and automatic item collocation [Choi et al., 2015] in addition to other additional services that enhance the shopping experience (eg. restaurant and play areas);
- Lack of ”key” sizes in stores: the absence of the size requested by the customer leads to a dissatisfaction even greater that the total absence of the item itself. Generally demand trend for sizes follows a Gaussian curve centred on a particular size which varies according to the customer target and the reference market;
- Low service level, due to delivery lots with missing items or sizes, caused for example by production defects;
- Limited assortment in outlet stores, in terms of inventory depth and va-riety breadth, and the mix between basic and fashion merchandise [Ra-jaram, 2001]. This assortment is strictly connected to returns quantity at the end of the season.
2.3.3.2 Cost reduction risk factors
The Cost Reduction objective can be outlined into two different sub-targets. From a Time perspective, the reduction for the processes of collection de-velopment, transports, orders management and material handling, allows to enter the market with the right product at the right time. This factor is crucial in the fashion industry due to the very short product life cycle. Then, factors that may cause a long time to market are:
- Inefficient interaction styling office/marketing office: the styling office must translate market information into the new collection;
- Inefficient interaction styling office/suppliers, that can simplify the pro-cess of fabrics selection and guarantee higher product quality;
- Delays in closing sales campaign and increase in distributors orders, may cause delays in production orders launch and lead to errors in dimension-ing orders themselves;
- Forecasting error for some items, providing wrong guidelines to the styling office;
- Process misalignment between actors, meaning the difficulty of defining ”no border” connections between supply chain actors, avoiding delays and over-stocks;
- Production and delivery of the whole purchase lot before the selling season and Production of more items by a single supplier, which may lead to overload and delivery delays;
- Poor ”virtual integration” between Supply Chain actors without the use of Internet-based technologies and information sharing systems [Bhimani and Ncube, 2006];
- Orders launch close to the selling season, implying that any possible delay from this stage on will cause delays in deliveries to stores;
- Long production lead time, Delivery delays of raw materials and Sole use of foreign suppliers [Macchion et al., 2015], are all factors that may in-volve an extension in throughput time thus exposing companies to possible disruptions in material flows;
- Wrong delivery scheduling, which may lead either to overload the ware-house or to out-of-stock for deliveries to stores;
- Use of low cost transports mainly for international transports;
- Inefficient item division in warehouse, Limited storage/material handling capacity and No automated warehouse, that may create a bottleneck for product flow causing longer delivery times;
- Short delivery times for foreign clients, which usually require advanced deliveries unlike the national market;
- Urgent deliveries and Frequent replenishments, in order to adapt products availability according to actual demand;
- Long lead time between returns and resending to customers: it is related to defective goods and not to unsold goods. In this case, there is the risk of late resending of refurbished items with a possible rejection by the customer;
![Figure 1.1: Product lifecycle in the fashion industry compared to other markets [Bandinelli et al., 2011]](https://thumb-eu.123doks.com/thumbv2/123dokorg/7218587.77173/25.892.343.714.215.377/figure-product-lifecycle-fashion-industry-compared-markets-bandinelli.webp)