POLITECNICO DI MILANO
School of Industrial and Information EngineeringMaster of Science in Management Engineering Design Management, Innovation and Entrepreneurship
Master of Science Thesis
Big Data Exploitation:
An Analysis on How Different Companies Leverage Data
Supervisor
Prof. Tommaso Buganza
Co-supervisor
Daniel Trabucchi
Submitted by
Oguzhan Dogan 892272
Yigit Selcuk Goc 892720
ii
ACKNOWLEDGEMENT
Coming to Milan for our M.Sc. programme has been a great challenge for the both of us in many ways, but it has been a journey that we will never forget packed with experiences. With many ups and downs, two years flew by and we are at the end of this journey. Without the support of the people around us, it would not be possible to pursue our educational career in Milan and we are forever grateful to them.
Firstly, we would like to thank our professors that changed our perceptions of the world for us in many ways and enabled us to grow as better engineers. Specifically, for this thesis, we would like to thank Prof. Daniel Trabucchi for his valuable guidance throughout this thesis and implacable patience for all of our questions.
Last but not least, we would like to thank our families that always supported us throughout this journey and encouraged us in any circumstances. We are sure it has not been easy for them either. Also, we have met many great people in Milan that stood by us in times of need that come from all around the world and we are grateful to know them.
We hope that our experiences here are only a precursor to a great journey.
Oguzhan Dogan Yigit Selcuk Goc Milan, 2019
iv
TABLE OF CONTENTS
ACKNOWLEDGEMENT ... ii
LIST OF FIGURES ... viii
ABSTRACT ... xii
1. INTRODUCTION ... 1
2. LITERATURE REVIEW ... 4
2.1 Big Data Exploitation Overview ... 4
2.1.1 Definition of Big Data and Data Exploitation ... 5
2.1.2 Main examples of Big Data Usage ... 7
2.1.3 Big Data with Data Driven Technologies ... 11
2.2 Big Data in Two-sided Markets ... 15
2.2.1 Two-sided Markets Definition and Evolution ... 16
2.2.2 Competitiveness of Two-sided Markets ... 22
2.2.3 Policies in Two-sided Markets... 25
2.3 From Two-sided to Multi-sided Markets ... 26
2.3.1 Definition and Examples of Multi-sided Markets ... 26
2.4 Big Data Across Different Industries ... 28
2.4.1 Healthcare ... 29
2.4.2 Education ... 30
2.4.3 Banking and Finance ... 30
2.4.4 Agriculture ... 31
2.4.5 Retail ... 31
2.4.6 Manufacturing ... 32
v
4. RESEARCH METHODOLOGY ... 36
4.1 Empirical Setting ... 36
4.2 Data Gathering and Analysis ... 37
4.3 Variables ... 38
4.3.1 Internal or External Data ... 38
4.3.2 Single or Mixed Data Input ... 39
4.3.3 Active or Passive Data Creation ... 39
4.3.4 One-sided Market or Two-sided Market ... 40
4.3.5 Client-as-a-source or Client-as-a-target ... 40
4.3.6 Enhanced Advertising, E-Ethnography or Data Trading ... 40
4.4 Industries ... 41
4.5 Models and Flows ... 42
5. CASE SUMMARIES ... 43 5.1 Airbnb ... 43 5.2 British Airways ... 45 5.3 Celmatix ... 47 5.4 CVS pharmacy ... 49 5.5 DeepMap ... 51 5.6 Disneyland ... 52 5.7 Duetto ... 54 5.8 Dunkin’ Donuts ... 56 5.9 EasySize ... 58 5.10 Electronic Arts ... 59 5.11 Enel ... 61 5.12 Evolv ... 62 5.13 Food Genius ... 64 5.14 Gamestop ... 66
vi
5.15 Google and US Disease Control ... 67
5.16 Kroger ... 69 5.17 LinkedIn ... 70 5.18 LotaData ... 72 5.19 Macy’s ... 73 5.20 Mint.com ... 75 5.21 Mobike ... 77 5.22 NBCUniversal ... 79 5.23 Nestle ... 80
5.24 Next Big Sound ... 82
5.25 Paypal ... 84
5.26 Penny ... 85
5.27 Pfizer ... 87
5.28 Red Roof Inn ... 89
5.29 Social Bakers ... 90
5.30 Spotify ... 92
5.31 Starbucks ... 94
5.32 Tesla ... 96
5.33 The Weather Company ... 98
5.34 Toyota ... 100 5.35 Uber Movement ... 101 5.36 UniCredit ... 103 5.37 Woebot ... 105 5.38 Xiaomi ... 106 6. FINDINGS ... 108
6.1 Findings on the cases ... 109
vii 6.3 Clusters ... 112 6.3.1 Cluster 1 ... 112 6.3.2 Cluster 2 ... 113 6.3.3 Cluster 3 ... 114 6.3.4 Cluster 4 ... 115 6.3.5 Cluster 5 ... 116 7. DISCUSSION ... 118 7.1 Industry Discussion ... 118 7.1.1 Transportation Industry ... 118
7.1.2 Food and drinks Industry ... 118
7.1.3 Healthcare Industry ... 118
7.1.4 Data Analytics Industry ... 119
7.1.5 Accommodation Industry ... 119
7.1.6 Information Technologies Industry ... 119
7.2 Cross-Combinations of Variables ... 119 7.2.1 Standalone Improvers ... 120 7.2.2 Enhanced Exploiters ... 122 7.2.3 Standalone Exploiters ... 123 7.2.4 Enhanced Improvers ... 124 7.2.5 Failed Combinations ... 127
7.3 The Results and the Literature ... 130
8. CONCLUSION ... 136
viii
LIST OF FIGURES
Figure 1 – Number of Transistors on Integrated Circuit Chips from Roser and Ritchie
(2019) ... 6
Figure 2 – Descriptive, Predictive and Prescriptive Analytics from Baldassarre (2016) .. 7
Figure 3 – The number of complaints submitted to the DPA’s from 25 May 2018 to 1 March 2019 by GDPRToday (2019) ... 13
Figure 4- Two-sided markets: a progress report (2006) ... 16
Figure 5- Business Models: A Discovery Driven Approach (2010) ... 19
Figure 6– Global Data: Mobile, Internet and Social Media Use (2019) ... 34
Figure 7- Cases by industry ... 41
Figure 8– Airbnb E-Ethnography Model ... 45
Figure 9– British Airways E-Ethnography Model ... 47
Figure 10–Celmatix E-Ethnography Model ... 49
Figure 11–CVS Pharmacy E-Ethnography Model... 50
Figure 12–Deep Map E-Ethnography Model ... 52
Figure 13–Disneyland E-Ethnography Model ... 54
Figure 14–Duetto E-Ethnography Model ... 56
Figure 15–Dunkin’ Donuts E-Ethnography Model ... 57
Figure 16–EasySize E-Ethnography Model ... 59
Figure 17 – Electronic Arts E-Ethnography Model ... 61
Figure 18– Enel E-Ethnography Model ... 62
Figure 19– Evolv E-Ethnography Model ... 64
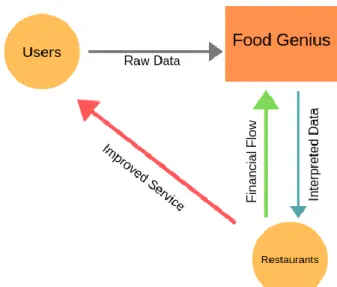
Figure 20 – Food Genius Data Trading Model ... 65
Figure 21 – GameStop E-Ethnography Model ... 67
Figure 22 – Google Data Trading Model ... 68
Figure 23 – Kroger E-Ethnography Model ... 70
Figure 24 – LinkedIn Data Trading Model... 71
Figure 25– LotaData Data Trading Model ... 73
Figure 26 – Macy’s E-Ethnography Model ... 75
Figure 27 – Mint.com E-Ethnography Model ... 77
Figure 28 – Mobike E-Ethnography Model ... 79
ix
Figure 30 – Nestle E-Ethnography Model ... 82
Figure 31 – Next Big Sound Data Trading Model ... 84
Figure 32 – PayPal E-Ethnography Model ... 85
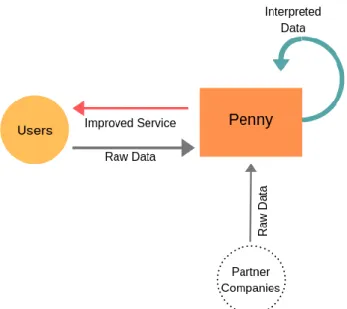
Figure 33 – Penny E-Ethnography Model ... 87
Figure 34 – Pfizer E-Ethnography Model ... 88
Figure 35 – Red Roof Inn E-Ethnography Model ... 90
Figure 36 – Social Bakers Data Trading Model ... 92
Figure 37 – Spotify Data Trading Model ... 94
Figure 38 – Starbucks E-Ethnography Model ... 96
Figure 39 – Tesla E-Ethnography Model ... 98
Figure 40 – The Weather Company Enhanced Advertising Model ... 100
Figure 41 –Toyota Data Trading Model ... 101
Figure 42 – Uber Movement Data Trading Model ... 103
Figure 43 – UniCredit E-Ethnography Model ... 104
Figure 44 – Woebot E-Ethnography Model ... 106
Figure 45 – Xiaomi Enhanced Advertising Model ... 107
Figure 46 – All Findings Regarding Variables ... 108
Figure 47 - Cluster 1 ... 112
Figure 48 – Cluster 2 ... 113
Figure 49 – Cluster 3 ... 114
Figure 50 – Cluster 4 ... 115
Figure 51 - Cluster 5 ... 116
Figure 52 - Types of Companies ... 120
Figure 53 - Standalone Improvers Compared to Rest ... 121
Figure 54 - Standalone Improver Industries ... 122
Figure 55 - Enhanced Exploiters Compared to Rest ... 122
Figure 56 - Enhanced Exploiter Industries ... 123
Figure 57 - Standalone Exploiters Compared to Rest... 124
Figure 58 - Enhanced Improvers Compared to Rest ... 125
Figure 59 - Framework of the Company Types ... 126
Figure 60 - Classifying the Framework of the Company Types ... 127
Figure 61 - Internal/External and Data Input Analysis ... 128
Figure 62 - Active/Passive and Sided Analysis ... 128
x
Figure 64 - Data Input and Sided Analysis ... 129
Figure 65 - Radical and Incremental Innovation Chart (Orcik, A., Tekic, Z., & Anišić, Z. (2013)) ... 130
Figure 66 - Three Models of Innovation (Verganti, 2009) ... 131
Figure 67 - Technology Screening, Substitution and Epiphany (Verganti, 2009) ... 132
Figure 68 - Substitution and Epiphany Company Types ... 133
Figure 69 - Innovation of Meaning and other approaches of innovation (Verganti, 2016) ... 134
xii
ABSTRACT
Today’s world is in the middle of a change with digital technologies that are integrating into people’s lives more such as; artificial intelligence, machine learning, and internet of things. A very significant part and enabler of these technologies is big data and how companies can recognize and use the full potential of it depends on many factors. Big data either generated internally to the company or not, create new pathways for businesses to grow. Mobile devices and the stable connectivity of the internet enable companies to collect all types of data without much conscious effort. Rather than relying on traditional means of obtaining insight via questionnaires and other means, companies can track how people use connected devices and mobile applications easily. With the growing importance of analytics, companies can analyse and predict certain patterns in people that might create opportunities that are not easily seen. The aim of this thesis is to focus on 38 unique cases that are selected based on different industries and analyse their innovative ways of using data. There are many companies that exploit big data in the industries such as transportation and data analytics that are quite similar, and the selected cases reflect various aspects of each industry. After analysing each case and creating models for them based on 6 variables that are created to differentiate the uses of big data, 2 of these variables has created 4 types of big data companies. These 4 types reflect different ways of leveraging big data and 2 of them are named as Standalone Improvers and Enhanced Exploiters. These two types resemble Technology Substitution and Technology Epiphany strategies created by Verganti (2009). This shows that many big data using companies either substitute their current technology with big data applications and not change the current meaning or use them to generate new meanings as well as using new technology. Conceptual frameworks of all the discussions are presented in the thesis and the current limitations of the research are discussed, leaving room for future development in the topic.
xiii
SOMMARIO
Il mondo di oggi è nel bel mezzo di un cambiamento con tecnologie digitali che si stanno integrando maggiormente nella vita delle persone, come l'intelligenza artificiale, l'apprendimento automatico e l'internet delle cose. Una parte molto significativa e abilitatrice di queste tecnologie è costituita da grandi dati e il modo in cui le aziende possono riconoscerne e sfruttarne appieno il potenziale dipende da molti fattori. I grandi dati generati internamente all'azienda o meno, creano nuovi percorsi di crescita per le aziende. I dispositivi mobili e la connettività stabile di Internet consentono alle aziende di raccogliere tutti i tipi di dati senza uno sforzo consapevole. Piuttosto che affidarsi ai mezzi tradizionali per ottenere informazioni tramite questionari e altri mezzi, le aziende possono tenere traccia di come le persone utilizzano facilmente i dispositivi connessi e le applicazioni mobili. Con la crescente importanza dell'analitica, le aziende possono analizzare e prevedere alcuni modelli di persone che potrebbero creare opportunità non facilmente visibili. Lo scopo di questa tesi è quello di focalizzarsi su 38 casi unici selezionati in base ai diversi settori industriali e analizzare le loro innovative modalità di utilizzo dei dati. Ci sono molte aziende che sfruttano i grandi dati in settori come il trasporto e l'analisi dei dati che sono abbastanza simili, e i casi selezionati riflettono vari aspetti di ogni settore. Dopo aver analizzato ogni caso e creato modelli basati su 6 variabili che vengono create per differenziare gli usi dei grandi dati, 2 di queste variabili hanno creato 4 tipi di grandi aziende di dati. Questi 4 tipi riflettono diversi modi di sfruttare i grandi dati e 2 di essi sono denominati Standalone Improvers e Enhanced Exploiters. Questi due tipi assomigliano alle strategie di Technology Substitution e Technology Epiphany create da Verganti (2009). Questo dimostra che molti grandi dati che utilizzano aziende o sostituiscono la loro tecnologia attuale con applicazioni di grandi dati e non cambiano il significato attuale o li usano per generare nuovi significati e utilizzare nuove tecnologie. Le strutture concettuali di tutte le discussioni sono presentate nella tesi e i limiti attuali della ricerca sono discussi, lasciando spazio a futuri sviluppi nell'argomento.
1
1. INTRODUCTION
As the McKinsey Global Institute states in 2011, Big data has become a keyword that many companies from all different industries started paying attention to. Data has become easy to collect with transactions, customers, operations, suppliers and more, and there is a sheer tremendous amount of data that are created as a by-product coming from activities such as social media, smartphones, e-commerce, internet of things, transportation and many more. Big data refers to an amount of data set that are too large to capture, store, and analyse with the current software data management toolsets.
As time goes on, the data sets grow larger with more computing power and lesser data storage costs. Big data is characterized by the Three V’s suggested by Laney (2001), and it describes Big data to have three main characteristics; volume, variety and velocity. Volume refers to the sheer magnitude of data reported in multiple petabytes and terabytes. One petabyte is the same as 1024 terabytes and in one terabyte 16 million photographs can be stored. Facebook alone processes one million photographs a second, hence it shows how big the data generated by Facebook is (Beaver et al., 2010). Variety on the other hand refers to heterogeneity in datasets in structural form and big data is made up of many types of different datasets coming from internal and external sources for the companies. Internal data can be seen as data generated by a company’s internal sources such as sensors, and external data can be seen as data generated by external sources such as social media. The third V is velocity and it refers to the speed that data are created, analysed and used with. The digital services accelerated this greatly with the evolution of smartphones and sensors that allowed to map behaviour of people. The sheer data even allows real-time analytics with the smartphones and it is already a need for companies to manage these data instantly.
2
In addition to these three, there are three other dimensions to big data; veracity, variability and value. Veracity refers to the unreliability in the data set in some forms. Social media data sets can be inherently seen as unreliable, the term is coined by IBM. Variability refers to the data flow rates that measures its consistency and a challenge for companies to overcome, the term is coined by SAS. Value refers to big data as how valuable data are, and usually big data sets contain low value density data. (Gandomi & Haider, 2015). Considering all these aspects of big data, companies need to find ways to exploit them as data allows companies to do what they are doing in a much better way.
According to the OECD report in 2014, big data for many businesses and governments is a driving force for value creation, new product development, and creation of new knowledge. This data-driven innovation approach not only applies to sectors that involve dealing with data analysis such as ICT, but for advanced analytics other non-ICT companies have started to exploit data to create added value. Hence, it is important that firms, regardless of their industries find ways to analyse and capture the value that is inherent in big data.
In this thesis, different industries have been analysed intensively to find specific case studies that involve firms that exploit data sets that can be considered big data. It is important to understand how different companies in different industries make use of big data and see who are benefiting from data driven solutions.
In order to present the theoretical background behind big data exploitation, a literature review was done first on big data exploitation, main use cases of big data, competition led by data enabled technologies, then on two-sided markets that make use of big data and examples with policies related to them, and then on how two-sided markets evolve over time to become multi-sided. Also included in the literature review is the reasons to pursue big data exploitation cases. After that, research objectives were done to explain what are pursued in this thesis with the specific methodology selected and used. Then, 38 companies that make use of big data by exploiting the value within are selected and analysed with the variables defined in methodologies. In methodologies section, variables are selected to specify how to differentiate the companies in different ways. Specificities related to each company are identified and
3
explained. In order to visualize the specific relations and transactions of the companies, figures are created for all of the companies.
In the following section of the cases, results are considered for all of the cases first by understanding the current situation. Then, cases are created based on the variables sorted in various ways and bases of creating types are determined. Purpose of the thesis was to understand different ways companies exploit big data and a discussion is then added based on the models and findings.
4
2. LITERATURE REVIEW
Literature review part starts with what big data is and how it affected current technologies. After a descriptive explanation of big data, main uses of big data in on going market uses. Also expanding technological possibilities are reasoned by the alteration of market competition levels. Two-sided market concept is introduced, and connections related to big data and two-sided markets are clarified. Using examples regarding this connection, affiliation levels of the two concepts are pictured in a realistic scenario. The transformation from two sided to multi sided platforms and values that are created and transferred by multi sided platforms are discussed with focus on the question of “in what manner”. Upon finishing the literature review, the rationale behind analysing big data exploiting cases is made clear.
2.1
Big Data Exploitation Overview
This section consists of how big data is shaped and mentioned through different analyses since the growing interest to data driven logic in different cases, how the concept differentiated within time, distinct typologies emerged and converged into distinct characteristics which led to greater variety of technological opportunities.
The exact starting point of the term “big data” is unknown, as Diebold (2012) mentions that of the earliest appearances of the term does not come from an academic resource but rather from a company called Silicon Graphics (SGI), the Chief Scientist from the company created a slide deck that includes the term “big data” and expresses the concept behind it. Laney (2001) stated first standard characteristics of the term (Velocity, Variety, Volume) and pointed out initial use cases of data collected by enterprises –which he based his assumptions on e-commerce-- that can be harnessed to be used as a competitive advantage. The technological developments such as newer database architectures like SQL and the concept of API’s, lead to ever-growing importance of data in terms of who owns more data and occurrences of new use cases such as
5
Google Maps or Paypal were occurring in the market (O'Reilly,2005). Recently, market size of big data analytics was estimated to be 103 billion dollars in 2027 which is higher than double of 2018 estimations according to Liu (2018). One of the market standard big data tools, Hadoop is an open source framework focusing on leveraging of data sets and computational methods. An analysis on forecasting market size of Hadoop and its distributions states that the global market size is going to reach 9400 million dollars by 2024 from its current state in 2019 which is 1700 million dollars (Mar, 2019).
2.1.1 Definition of Big Data and Data Exploitation
There are several definitions of big data and data exploitation as the terms are used by different studies and how comprehensive the usages are. De Mauro, Grimaldi and Greco(2016) stated that according to most common phrases used with big data leads to four possible divisions of how big data can be defined which are attributes of data, technological needs, threshold and social impact, these divisions converged a comprehensive definition as big data being the information asset characterized by such a high volume, velocity and variety to require a specific technology and analytical methods for its transformation into value.
Another definition which depends more on real uses of big data is stated by Müller et al.(2016) as The proliferation of the web, social media, mobile devices, and sensor networks, along with the falling costs for storage and computing resources which lead to a near ubiquitous and ever-increasing digital record of computer mediated actions and communications. Social media as an example, Fan and Gordon (2014) explain that by social media analytics process (capturing, understanding and presenting the data) combined with analytic techniques such as opinion mining, topic modelling or trend analysis, data can be used to answer critical business questions related to return on investments, customer engagements and creation of effective social media strategies. Mobile devices are also relevant sources of data with 3.3 billion mobile devices in 2019 and forecasted to be 3.8 in next two years (Holst, 2019). He et al. (2016) also support the correlation by stating that mobile data can provide insightful information that ca be extracted by big data practices, user behaviours and preferences to be used for creating a profile for users and possible frequent behaviours which can be used for modelling infrastructures that can take real time and autonomous decisions. Rise of computational power and storage capacity are also catalysts for big data to be an emerging trend. Computational power of microprocessors jumped
6
from having 2,300 transistors in 1971 to more than 10 billion transistors in 2017 such as Apple’s A12X and Kirin 980 series (Hoser and Richie, 2019).
Figure 1 – Number of Transistors on Integrated Circuit Chips from Roser and Ritchie (2019)
Storage capacity on the other hand supported maintaining process of the data, it is possible to correlate to Laney’s (2001) Volume attribute of big data. As there are multiple and increasing ways to acquire data, storage technologies are constantly being challenged for increased volumes and throughput regarding possible limitations such as energy consumptions, capacity footprints and lifetime of technologies (Bhat,2018). In addition, even if data can be acquired properly and mass volumes of data is existent, big data capabilities is more likely to be sensitive to business failure because of the change of decision making systems from intuition and experience to purely data driven approach, leading to the result where data as only basis is risky in terms of creating a competitive advantage (Amankwah-Amoah and Adomako, 2019).
7
Businesses that can successfully implement big data in their infrastructures may lead to various benefits regarding their return on the investments. These benefits can differ, such as cost reductions from implementing cloud-based analytics, improved decision-making process, development of new product and services, product recommendation by customizing value propositions and fraud detection (Balachandran and Prasad, 2017). One study on how big data affects firm performances by Mikalef et al. (2019) suggests that even though big data is a trending concept, not all companies are able to implement full potential of their big data investments and technological capabilities itself is not completely relevant if it is not diffused properly through organization. Colombus (2017) mentioned that big data adoption rates increased to 53 percent with 41 percent mentioning they may use it in the future.
2.1.2 Main examples of Big Data Usage
Different practices of data driven approach leads to different business questions to be answered. While the origin point is unclear regarding different typology terms of data analytics, of the earliest mentions of such categorization is in Lustig et al. ‘s (2010) article where they mention how IBM structured a new for analytics: Descriptive Analytics, Predictive Analytics and Prescriptive Analytics.
8
2.1.2.1 Descriptive Analytics
Descriptive analytics is the first step of business analytics, also supported by Bertolucci’s (2013) article where descriptive analytics is mentioned as “Simplest class of analytics”. Descriptive analytics provides an interpretation that answers the question of “What happened?”, this question may vary according to context such as “Which customers required the most help?”, “Which product had the most detects?” or “How was the sales regarding a specific period of time?” (Vesset, 2018).
RetailFlux is a Norway based company that provides analytic solutions to retailers. The company offers services of software and hardware as a combined service offering. One of the remarkable products is Pheat, a heatmap analytics service that help retailers to see which in shop areas are denser in terms of customers. Using the cameras and embedded software, shop owners are presented with a heatmap that they can understand the “as is” regarding situation of customer locations. It is a possible example for descriptive analytics as supported by IBM’s (2017) report, it mines data to provide a trending information on past or current events, providing context to business owners.
Social Blade is another analytics company focused on social media statistics. They first started with the previously famous website Digg and then focused their attention to YouTube statistics. When YouTube became what they are today Social Blade also leveraged from the growth and today they provide statistics for YouTube, Instagram, Dailymotion, Twitch and Twitter with 56.2 Million accounts in total. Their YouTube dashboard provides detailed statistics such as channel types, uploads, subscriber ranks and even estimated monthly earnings for the users and highly popular among platform users. Social Blade can be considered as descriptive analytics as they use present and past data by compiling and visualizing them in a simple way. Batrinca and Trleaven (2014) states that social media data is considered largest richest and most dynamic evidence base of human behaviour which can be used to understand individuals, groups and society.
9
2.1.2.2 Predictive Analytics
Predictive Analytics focus on forecasting future results where descriptive analytics where focusing on past and present. Prince (2019) states that the logic behind predictive analysis as “that there is some event or outcome (depending on variable) whose realization we do not know but would like to predict using available data”. Predictive analytics can lead to many benefits as it supports how businesses prepare themselves in uncertain risks. A study by Dubey et al. (2017) suggested that predictive analytics is a strong predictor of social and economic performance, also supporting managers who face constant challenges on sustainability in supply chains.
One distinct example can be given for flight data. In 2010-2012, JFK airport used a web hosted predictive analytics tool that supports mitigation of risk caused by different variables such as weather and traffic congestion. It helps with rapid forecast of possible delays and additional problems. Integration of such system improved efficiency of operations significantly such as 11 million dollars in fuel costs savings and more than 14,800 hours of taxi time reduction (PASSUR,2016).
Healthcare is another industry that predictive analytics can adopted for various benefits. Ayasdi is an analytics solution provider that helps with patient management in clinics and health institutions. Their tool can categorize similar patients and create patterns that customer can be least impacted by financial results. Health industry is very data intensive as patents numbers can be massive for handling manually. David et al. (2018) suggests that in healthcare, predictive analytics can lead to improved quality of care and reductions in cost.
Microsoft is also providing predictive analytics solutions that can forecast sales and revenues for their customers. They support sales teams on decision making processes and leverage on their Azure Machine Learning and predictive models when dealing with business challenges of customers. Microsoft (2016) explain the process as aggregating end-to-end sales information and feeding in with models, sale teams get powerful analytics-based insights and recommendations.
10
2.1.2.3 Prescriptive Analytics and Transition to Automated Analytics
Prescriptive analytics can be considered as taking predictive analytics one step further. While descriptive analytics were firstly adopted, predictive and prescriptive analytics started to emerge that utilizes machine learning and fast visualization (Larson and Chang, 2016). Lepenioti et al. (2018) states input that prescriptive analytics takes is the output of predictive analytics algorithms, usually multiple algorithms used as combination, filling the gap for decision making process that predictive models may not be enough to cover. While prescriptive analytics is asking the last question of “What to do?” in terms of business solutions, there is still an additional step: automated analytics. The prescriptive and automated analytics usually are embedded within each other so the distinction can be unclear. One possible statement that differentiates these terms is stated by Davenport (2015) as instead of recommendations and suggestions to a human, as in prescriptive analytics, automated analytics acts on the results of their analysis such as displaying best landing page, determining what e-mail to send to which customer.
Google Maps is a web-based software product that serves many purposes using location data. One of the functionalities of Google Maps is that user can search for places they are willing to visit, and Google Maps shows the optimal roads and transportation options depending on how user wants to travel. Google Maps uses a massive database of GPS data that even includes transportation and road changes (delays, cancellations) in real time. Google Maps is a suiting example for prescriptive analytics as it does not just give results and it suggests users possible actions that can be most efficient in terms of time.
Sniffie is Helsinki based start-up that offers price optimizing solutions to e-commerce businesses. Pricing is very important for online shops as it can directly affect profitability and conversion rate. Sniffie uses data analytics to discover market opportunities through their algorithms and reflect the prices automatically to websites. Sniffie is an automated analytics example as it uses data not to suggest business owners what to do rather, their embedded system takes action without human intervention.
11
2.1.3 Big Data with Data Driven Technologies
Big data and analytics are very common terms nowadays, so while their relevancy today is clear, they are not “emerging” trends. However, they’ve continued to evolve as discussed in the previous section. Automation of decision-making process is still an unfinished concept and big data itself may not be enough.
Artificial intelligence (AI) is one of the relevant terms associated with big data. Duan et al. (2019) states that AI has gained popularity from big data, advanced algorithms and increase of computing power and storage, AI systems are being included in systems and has an undeniable impact on human decision making. There are several uses of the combination of big data and AI. Allam and Dhunny (2019) explain that the processing of data with AI algorithms can ensure improvement of liveability in cities in terms of hygiene, healthcare and conductive environments for citizens to continue daily lives without urban challenges of pollution and congestion. Although AI seems to lessen human need on certain tasks, it is only a change of tasks rather than removing human capital. Jarrahi (2018) states that AI solutions are taking over quantitative tasks with computability, but humans are overtaking AI solutions in evaluation of subjective and qualitative tasks.
Internet of things (IOT) is another term that is crucial on the acquisition of data. Insights team (2017) defines IOT as the interconnection of machines and devices through the internet, enabling the creation of data that can yield analytical insights and support new operations. Ge (2018) explains that fusion of big data and IOT has led to creation of broader possibilities for complex systems with using data generated from smart environments. Same motivation applies for businesses that are willing to use a data driven approach with IOT data. Rehman et al. (2019) supports connection by mentioning that IOT devices generating massive amounts of raw data streams which results in acquisition of big data and leading to improvement by real time analysis such as machine health and defect free products.
2.1.3.1 Big Data and Privacy
Data is getting more valuable each day as enterprises are looking for further ways to improve their value offerings through the information gathered from their customers. However, as type
12
of information acquired from users getting more detailed, privacy concerns are on the rise. In terms of big data and its applications a proper definition of privacy is required. Sætra (2019) states that privacy is the claim of individuals, groups or institutions themselves deciding when, how and to what extent information about them is communicated to others. Corporations using data should anonymize and comply to regulations surrounding how private information can be used.
Although there are different regulations that depends on several factors such as political, social, economic reasons, there are common practices on preserving the sensitive of information without violation. Aliguliyev et al. (2019) states that there is an increase for wide popularity of anonymization methods which mainly protect the identity of the data owner by coarse-graining methods, therefore retaining essential information for analysis while suppressing or generalizing other identity attributes. Kakatkar and Spann (2018) also mention another perspective to anonymization as protecting IP addresses or similar identity revealing data may not serve only for taking government regulations into account but also improve customer perception of the companies unless the data collection and use is expressly permitted by consumer.
Big data generates massive amount of data that needs existence of a protective system within the organization that acquires information. Cyber security is another concern for big data systems as the use of data should not just be legally performed by companies but also needs to be safe from external risks. Symantec Corporation (2019) reported that cyber security attacks are still on the rise, mobile ransomware attacks are increased by 33 percent and one in every thirty-six mobile apps has a certain risk that may cause cyber infections. Tawalbeh and Saydamli (2019) explain that systems for protection of data should have cryptographic attributes that comply with three key objectives of security: “Confidentiality” to keep massive information secure and secret so no unauthorized entity can access to them, “Integrity” that can detect unwanted changes in data while making sure computations related to big data is correct and “Availability” to make big data accessible so that authorized entities can reach data simply.
2.1.3.2 Big Data and Privacy in European Union
In this section, data privacy laws in EU will be discussed. Information privacy regulations vary significantly according to country that they were referring at. Globally, many countries have
13
their own data privacy laws or comply to bigger data privacy regulations such as General Data Protection Regulation (GDPR) which refers to European citizens. On the other hand, laws about data privacy in US are not usually as strict as EU countries and highly differentiates by states. Sullivan (2019) states that EU does not consider the data privacy laws of US provide proper data protection and in order to address this issue, EU and US Privacy Shield was agreed in 2016 in the wake of finding that its predecessor (EU- US Safe Harbour Framework under Data Protection Directive) was not sufficient.
Figure 3 – The number of complaints submitted to the DPA’s from 25 May 2018 to 1 March 2019 by GDPRToday (2019)
Initially implemented in 25 May 2018, GDPR is a comprehensive set of laws that focuses on data protection and privacy for individuals in European Union. GDPR replaced and extended regulations from the former law about data protection which was Data Protection Directive. The extent of covering every aspect of data exposure is very broad in GDPR. For instance, rules regarding children and their use of services that include data sharing is clearly pointed out in GDPR. Information Commissioner’s Office (2017) explains that GDPR states that if consent is your basis for processing the child’s personal information, children under 16 cannot give consent themselves and a proper consent from person holding parental responsibility is required, age lower than 13 is also not acceptable and protection is exceptionally crucial in services that use children’s data for marketing and online profiling. These laws are unusually
14
relevant as online offerings that target children is a very controversial topic. Conick (2019) mentioned that children clicking ads and making faulty purchases are very popular, Federal Trade Commission filed a lawsuit to Apple, Google and Amazon in 2014 regarding same concerns, 19 million dollars from Google, 32.5 million dollars from Apple were refunded to customers while Amazon also lost the case by 70 million dollars.
GDPR can summarized into eight divisions where each division refers to a certain right of an individual. These individual rights are : The right to be informed, the right of access, the right to rectification, the right to erasure, the right to restrict processing, the right to data portability, the right to object and rights in relation to automated decision making and profiling (General Data Protection Regulation, 2016). The right to be informed expresses that the data individuals give to companies should be used in a transparent manner which means the entity that takes the data must ensure that they inform the data owner on how their information to be used (Information Commissioner’s Office, 2017). The right of access is the section that expresses that individuals can validate if their data is being used, access to information they provided and additional information such as privacy notices. This section is important because it grants individuals information about what is happening to their data. The right of rectification section states that the data of the individual can be changed if the data is not accurate or complete. When entrusting data to entities, individuals need to reach for change of information. Fourth section refers to right of reassure where it implies that every individual can demand that their data to be removed or erased. This gives control the existence of personal information completely to individuals as they can request for erasure when they are not incentivized to share anymore. The right to restrict processing is another mechanism that increases control of individuals on their information. It refers to allow individuals to demand their information to be stopped processing and not used anymore by the shared entity. The right to data portability is letting data providers to migrate their data from one entity to another in a digitalized context within the constraints of secure and safe transfer. As similar data is being used within certain digital environments such as financial services and banking, this division can help with individual usability and change cost of those services. The right to object states that individuals can oppose to direct marketing purposes, data usage for possible interests by entities and data usage for scientific research and statistics. Lastly, rights related to automated decision making and profiling is including options for individuals that may be in risk by non-human processes.
15
As automation of data processing increases, unauthorized and unwanted risks may occur within data shared entities.
Perry (2019) explains that it is not logical to ignore GDPR as it needs to be embedded in the business practices if companies want to avoid fines and legal actions, also data types continues to grow more complex, it is difficult to comply to GDPR without an automated approach to fit the regulations.
2.1.3.3 GDPR and Examples of its Implementation
As companies started to change their systems in order to comply with GDPR, Slobozhan (2018) states that only 20% of the companies reported that they are fully ready. Google, one of the biggest tech giants is directly responsible for fitting the GDPR constraints as the company leverages massively on data. Ghosh (2019) reported that Google has been fined for 50 million euros by the French privacy watchdog because they are crossing limitations of GDPR and this fine was one of the earliest applications of GDPR in practice.
Another example was from Facebook as they are called by Austrian supreme court because of several GDPR violations. Rankovic in 2019 stated that one of the previous lawsuits was about Facebook’s possible practice of transferring EU citizens’ personal data to US without any consent from data owners. Currently, Austrian Supreme Court rejected Facebook’s bid to stop GDPR lawsuit against it by privacy activist Max Schrems and the suit is still ongoing (Bhagyashree, 2019).
2.2
Big Data in Two-sided Markets
This section will provide information about Big data in Two-sided Markets, how they are exploited and some examples to define its boundaries. In order to do so, first the definitions and the evolution of Two-sided Markets in the literature has to be examined. Then the main examples of Two-sided Markets need to be detailed to understand deeply the ways they work. Least but not last, the policies regarding the Two-sided Markets need to be examined.
16
2.2.1 Two-sided Markets Definition and Evolution
Two-sided Markets or also known as Platforms are considered as markets in which one or more platforms enable interactions between end-users (or sides) and try to get the sides to act by appropriately charging each side (Rochet and Tirole, 2004). A Two-sided market is explicitly defined as the one with the volume of transactions between end-users that depend on the structure of the platform and not on the overall fees charged by that platform (Rochet and Tirole, 2006). Hence, it does not include just any market that involves transactions between buyers and sellers that applies to any market. In the literature, the concept of the two-sided markets come from network externalities and multi-product pricing laid out by Katz and Shapiro respectively in 1985 and 1986. Accordingly, there are consumption externalities that occur when users use the product or service and there are direct and indirect consequences (or externalities) related. They can be either direct effects such as an increase the number of buyers of a certain product increases the benefit the network and anyone in that network. An example can be a telephone line in which the direct value of the line increases with the amount of people using it. On the other hand, there can be indirect effects with the increase in users in a network such as related software that supports hardware systems increase the overall value of the network and benefits the users, such as video game consoles. Hence, this notion of externalities plays a huge role in the two-side market paradigm.
Figure 4- Two-sided markets: a progress report (2006)
Understanding the externalities requires the examination of the trades between the end-users; buyers and sellers. By facilitating the interaction between them, the platform can benefit both
17
parties. An example can be seen as an operating system that allows software developers and users to internalize their externalities in a cross-user manner (Rochet and Tirole, 2004).
As time went on and physical sets of services and products are replaced by digital services, and two-sided markets continued to be prevalent in the following years as well. With the evolution of the digital services and applications, many customers started expecting services to be free, even if people continued to pay for services away from the digital world. Hence, new models had to be created to capture this trend and newer find ways to generate revenues. For instance, GPS manufacturers Garmin and TomTom that led the navigation services are not left out of the market with the free services coming to mobile applications such as Google Maps, Apple Maps, and Waze (Buganza et al. 2015). After this discontinuity, a new meaning had replaced the then current navigation services that relied on older technologies. Apple by providing this free service, internalized the externalities of supporting a two-sided market by providing users a navigation solution. Even though businesses need to adapt rapidly and effectively, in the long run the users benefit from these positive externalities enabled by technological changes.
With the advance in technology and with uncertainty and fast-moving environments, business models need to be revaluated to make actions that are feasible and in line with current trends. According to McGrath in 2010, the business model concept offers four new or not new but unexplored ideas that provide how some businesses perform better than others. First one is about firms focusing on promoting an outside-in approach, instead of an inside-out approach. It means that rather than focusing and relying on the core competences of a company, the managers are advised to adapt to the values of the customers that are dynamic and subject to change. This relates back to two-sided markets to have better understanding of the customer values with the data gathered to allow a deeper assessment of them in order to be successful in the fierce competition. Second one is about the firms to have a dynamic approach to business models and experiment with new models as they should not be fully anticipated in advance. An example to this can be the case of Airbnb and how they changed their business models to adapt when new solutions emerged coming from their lead users and feedbacks. This concept is later discussed in the case summaries section. The third is about being on the lookout for understanding the difference between a sustainable competitive advantage and temporary competitive advantage and not mistake the sudden exploitation of an idea as a sustainable offer
18
in the long run. The fourth one is similar to the other ones as it encourages business models to evolve and mature over time.
As discussed in the same research, there are many ways to offer ‘free’ services to customers due to the new developments in digital technologies. This ties back to how two-sided markets can be either Client-as-a-source or Client-as-a-target and how to work in a non-transactional way in these markets (Trabucchi et al., 2017). It is argued that the perception of the concept ‘free’ can be made possible with some elements such as; advertising, cross-subsidization, and freemium. Advertising is the most popular version of these and by attracting users with advertisements, the users receive the service for free as the price is subsidized by the advertisers. The second one is cross-subsidization and it refers to some units of business are bundled together with the transactional items and are given away for free. Such as a Nintendo Switch gaming console is bundled up with a free game. The third one is the freemium model which includes a basic version of a service for free and the advanced version is paid for if the user appreciates the free version and buys the advanced version. This is a frequent tactic done by many two-sided markets such as Spotify offering a basic version with advertisement to subsidize the cost of using and a premium version. Hence, it is argued heavily that business models need to be adaptive to change and dynamic in two-sided markets.
The ideas laid out by McGrath in 2010 are also explored as the competition of these two-sided markets by Armstrong in 2006. Armstrong argues that there are three factors that impact the prices in these markets; relative size of cross-group externalities, fixed fees or per-transaction charges and Single-homing or Multi-homing. The first one explains that if a member of a group has great positive externalities on the other members of another group, the first group will be aggressively targeted by platforms as the externalities determine the price structure. An example is about how the prices are lower for women than men in nightclubs, as having more women in nightclubs increase the number of men to go to interact with them. It can also apply to two-sided markets as some new platforms can offer free or reduced rate services to social media influencers as they will attract a lot of people to that platform and the externalities will determine this price structure. Fixed fees or per-transaction fee difference is explained by either a lumpsum payment of fees for the service or paying the service per-transaction of use. Here, the externalities are weakened by each transaction. Single homing characterises people that use
19
one platform and Multi-homing characterises people that use multiple platforms and the differences of incentives to join a new platform is weakened in Multi-homing agents.
Figure 5- Business Models: A Discovery Driven Approach (2010)
It is also possible that pricing strategies are influenced by the cost of using multiple platforms and is a defining factor in the competitiveness of two-sided markets (Rysman, 2009). Using multiple payment methods in merchants in unlikely, hence the users of credit and debit cards usually stick to a single method (Rysman, 2007). However, in the evolution of two-sided markets, it is not the case and users often use multiple platforms that can-do similar things. An example can be people that subscribe to Netflix also subscribe to Hulu, a similar streaming service. Similar situation rises in video games, as many people are growing to prefer multiple gaming consoles (Lee, 2008).
Even though the idea of setting up two-sided market businesses are explained thoroughly, there can be specific challenges attached to these markets and strategies for them need to be managed. Hence it is argued that there are three key issues that need to be managed regarding the strategies of two-sided markets; getting the pricing right, coping with winner-takes-all competition and avoiding envelopment (Eisenman et. al, 2009). Pricing in two-sided markets is difficult as there needs to be different prices for the sides and there needs to be a subsidy side. Pricing is also
20
complicated as there are externalities as the increase in users create positive externalities such as a growing number of users and content creators in YouTube attracts more advertisers. When getting the pricing right, there are two strategies to manage. First one is subsidizing quality sensitive and price sensitive users. For instance, by subsidizing the price sensitive users and charging the users that are not price sensitive, the network’s business can survive with a high volume of users in total. Hence, the companies need to find out how their users are segmented and how they use their product or service. Similarly, companies need to understand their industry and how the users are sensitive to quality. Two-sided markets that have a side that demands high quality outputs, the supplier needs to spend a large amount of fix costs to deliver a proven quality. This way the market is not filled by quality lacking video games and the buyers can assure the high number of users in that video game platform. The second challenge regarding the two-sided markets is the winner-take-all dynamics. What must be considered here is first deciding if a single platform can serve the full market or can there be multiple platform by different companies coexisting. Second decision is accepting the first proposition and deciding whether to fight for that platform or share the benefits together. This also ties back to the network effects of the same sides. Multi-homing costs are about adoption, operation, using and the cost of time to decide for a platform and if they are high, usually users tend to stay on one platform only. An example can be operating systems and most people usually stick to one (Eisenman et. al, 2009). The third strategy explained by Eisenman in 2009 is the threat of envelopment. This threat is explained by a competitor platform that enter the market of a company and if they overlap in user bases with similar functionalities, they can damage the leverages bundle of platforms that can cut prices by colluding. What can companies do to prevent this is to find a bigger company that can protect against these competitors or sue these platforms if they have the funds for infringing on antitrust laws. For example, WhatsApp is bought by Facebook as WhatsApp was not holding onto the market with a strong business model with a constant flow of revenues. Facebook by buying WhatsApp can allow the company to continue its operations with no financial issues due to the protection of a large company.
With the increase in data in digital platforms and two-sided markets, companies begin to realise how to extract the benefit from data sets. As explained previously in the preceding section, big data has great potential to benefit both the users and the companies in various ways. Allowing subsidization, creating a second market and a breeding ground for new ideas to grow, big data is an essential part of the sided markets. In order to realise how big data manifests in
two-21
sided markets, a study was done on the mobile application industry to define new types of business models that are present in two-sided markets and are not transactional by nature (Trabucchi et. al, 2017). It is expected by 2021 that more than 3.8 billion people will have smartphones (Statista, 2019). Therefore, app providers have access to valuable data and realizing the impact of these data sets need to be carefully planned and acted upon. This study showed that in order to capture value from big data in two-sided markets, there are three untraditional models to characterize them. First one is called enhanced advertising, which uses the data to create targeted advertisements. Second one is called data trading, which uses the data of companies as a direct source of income by selling data sets to third parties. Third one is called e-ethnography, which is a way that companies use to support activities that are possible with a better, more impactful relationship between the sides, leveraging on data (Trabucchi et. al, 2017). These models created the inspiration to explore better how companies exploit big data in various ways. Rather than focusing on just two-sided markets, the aim of the research of this thesis was to explore all kinds of markets from all different industries and characterize them based on different variables.
In order to understand how two-sided markets evolved to multi-sided markets, a clear definition of multi-sided markets is needed. Most common approach is defined by the existence of cross-group or indirect network externalities between two or more customer cross-groups existing on the same platform (Hagiu and Wright, 2015). However, at the most fundamental level of understanding there are two key features that characterise multi-sided markets rather than being too inclusive; enabling direct interactions between two or more sides and each side being affiliated by the platform (Hagiu and Wright, 2015). Affiliation can mean different things and in term of users, it means that there are platform-oriented investments that are necessary specifically for that platform. For instance, for the suppliers’ side learning how to program games on the video game console Nintendo Switch is a costly investment and users have a fixed cost of buying the gaming console to play their specific platform games. Sides to Nintendo Switch platform can be users, third party game developers, advertisers, authorities for regulation and more. The specificities of this platform need to be adopted by all sides to gain the indirect network externalities. Examples to multi-sided platforms can be Apple’s IOS, social networks such as Facebook, search engines such as Google, large e-commerce suppliers such as Amazon and Alibaba. According to Evans in 2012, Facebook is a four-sided platform and it provides a communication service between senders and receivers of information. However, it also opens
22
up to advertisers to target people with their advertisements. As another side, there are developers of games that appear on the site as well that targets the users of Facebook. The value generated in that platform is split into different sides if they can capture it in different combinations. Also, as the platform provides an exchange of value that reduce the transaction costs of the services. The way value is generated in multi-sided platforms are often used with a variety of mechanisms (Evans and Schmalensee, 2009). It can be said that big data vastly impacts the evolution of two-sided and multi-sided markets.
2.2.2 Competitiveness of Two-sided Markets
In order to better understand the two-sided markets, certain examples are selected and analysed through literature and observations in terms of competitiveness. By observing the pricing decisions, the distinct externalities, and the revenues streams, the competitive nature of these markets may indicate differences from regular markets.
It is very common to define the payment card industry as two-sided markets, since they act as an intermediary between merchants and customers that use the cards. Merchants chose the payment cards based on their fees, benefits, interest rates and credit. To understand the way these companies, compete, pricing decisions can be investigated (Rochet and Tirole, 2003). Hence, the merchants can use the payment networks as a way of implementing strategy, analysed by Guthrie and Wright in 2003 by modelling the competing payment networks. The way payment networks work with merchants is done with a pay-per transaction system, but the customers pay fixed fees to the system (Chakravorti and Roson, 2006). The variables that impact the competition in this case were network profits, prices to both merchants and customers, and how the competition changes the welfare to both parties. Accordingly, the competition always improves the welfare in both parties and the profits related to the network decrease with increased competition (Chakravorti and Roson, 2006). It can be interpreted that in two-sided markets, the competition can be beneficial for all the sides, at least in the payment industry. The competition in this case is also driven by the fact that for most daily uses, customers prefer to carry more than one payment card just in case where the merchant does not allow a certain network. Hence, even though customers would like to use just one payment card, several are used by both parties for convenience (Roson, 2005).
23
In order to say that in two-sided markets more competition leads to better welfare to both agents, the single network’s benefits should be analysed as even with higher market prices, a wider customer base would be present with unknown utility (Schiff, 2013). Hence, similar to regular markets a typical competition model arises and with more differentiation, a trade-off occurs between economies of scale (Roson, 2005). Also, internal competition may still be present even though the payment network is just one. When networks in payment cards set fees for banks, banks can compete within each other by setting final prices for their services (Roson, 2005). As the platforms compete in the same market, when a platform cuts on costs, it may increase the profits for their competitor platform. This is due to cross-subsidization between the market sides when the price can be below the cost on one side (Fahri and Hagiu, 2004). In this case, the competitor will change their price structure according to the other platform by lowering the price in one side and increasing in the other side. If the competitor can raise the price on the subsidized side, they can increase the profits.
The competition may also come from a bottleneck of customers as well. Even though there may be many advertisers targeting users in two-sided markets, there is only enough time to spare for users in the platforms. Hence, the increased competition in two-sided markets should not indicate the increase in profits for all sides. Customer may choose to use only Airbnb and Booking.com to do research for accommodation when traveling, and the overwhelming amount of time that goes into accommodation research may leave the competitors out as the industry can be considered saturated. Sometimes the hotels may try different platforms if they see the fares on Booking.com are unfair and too strict.
According to Wright in 2004, a high price-cost margin does not indicate market power in two-sided markets and an increase in competition presents more efficient pricing methods. The fallacies of the two-sided markets are explained through the analogy of a night club that serves both women and men. The men in this case prefer to go to nightclubs that include more women, hence the nightclubs have a price structure that is lower for women than men and several nightclubs compete. It is argued that an increased competition will drive the prices down for both women and men, however it does not indicate that the newer pricing structure is more efficient (Wright, 2004). It is then suggested that when entering these two-sided markets, the interdependencies of the sides need to be carefully highlighted and acted upon and the pricing
24
for the sides can be used as a strategic instrument. What may be used to analyse the sides can be big data and big data analytics. It is apparent that for better competition, companies need to analyse their data from all sides and deliver strategies according to the predictive analysis on the data sets.
In the analysis of the network effects of two-sided markets, firms invest rationally in products and services that are essentially given away when there is a lack of competition (Parker and Van Alstyne, 2005). The reason behind this comes from an increased demand in premium complementary goods cover the costs of free-goods market easily. Therefore, the fixed cost of investment can be subsidized. With high externality benefits, consumer benefits are not harmed when firms provide complementary goods while setting prices. This depends on the market and the products that are given away.
What must be taken account into the competition in two-sided markets is the freemium strategy to leverage on by using a combination of services and having a service that is not charged to the user and subsidized by other services (Pujol, 2010). Two-sided markets are often mistaken for freemium models as they have both sides that may look similar. However, in freemium models all the users are considered as one identity as users rather than different sides. The customer loyalty is an essential part of freemium models as the free service offer a standard service that people can try as long as they want, and if they want to have a better service, they can upgrade by joining a premium subscription. Rather than paying in advance, users can experience the offer and decide if they want to pay or not. Some companies such as Spotify and Apple Music offer subscription services that are heavily under-priced for new users to gain customer loyalty and have trust in their platform. In order to compete, companies need to have these types of strategies to survive in harsh competition, especially in two-sided markets that are leveraging on digital technologies. People expect things to be free, rather than pay in advance. The competitive advantage of the two-sided market strategies suggested by Trabucchi in 2017 leverage on this, as the users do not experience a transactional exchange of using a service, therefore they think it is free. Instead, as nothing comes for free, what they are paying the service with is data and they may not even be aware of creating data. This idea of active creation or passive creation data is used as a variable in the research methodology section in order to differentiate the big data exploitation cases.
25
2.2.3 Policies in Two-sided Markets
In this section, policies regarding the two-sided markets will be analysed with the general regulations and anti-trust regulations and how companies behave accordingly. The regular markets and two-sided markets may be different in the policies and regulations, as they are relatively newer concepts. Accordingly, it is suggested that one of the key questions raised by two-sided markets are the price structure and the policies (Rochet and Tirole, 2005). Not very recently, there has been many antitrust cases regarding the payment networks mostly about the interchange fees. One of the most famous cases has been the Visa and MasterCard case in 2003 which ended up in a settlement that cost around $3 billion and both parties accepted to abandon the HAC(Honor All Cards) system that provided different interchange fees to different payment cards from the merchants side. Problem for two-sided markets in this case, which can be common is the price discriminations to a side of the network that may be unfair. This is allowed by the nature of the two-sided markets that allow for this asymmetric information flows. Therefore, suggested by Rochet and Tirole, there is a need to renew the anti-trust regulations for the two-sided markets and higher margins on one side does not mean better market power. Also, price that is set below cost does not create predation.
It is possible that positive externalities and negative externalities can have an impact on the policies as well. According to Caillaud and Jullien in 2003, indirect network effects allow for pricing strategies to be divide and conquer by one side being subsidized or being divided and conquered by the recovery of the cost on the other side, which ties back to two-sided markets. As the pricing and demand with supply decision are taken by coordination with all the sides, a better way of strategy needs to be determined. The problem in these markets is that the intermediary platform does not simply solve the externality problem (Evans, 2003). Policies usually hinder the new two-sided markets that use digital technologies with the prohibitions, especially in the communications industry. With the rise of mobile networks and the ease of using internet everywhere and without interruptions, the telecommunications companies need to adjust to the two-sided markets if they want to be relevant by focusing on other business ideas. For instance, as people grew in the way they interact with social media and different chatting services such as WhatsApp and WeChat, the mobile providers became less relevant in the way they charge people as most people use just a mobile data plan and not pay-per-use messages and per-per-minute calls. In order to regulate these mobile applications just as the