Research Article
Genetic Diversity of
Fusarium oxysporum f. sp. dianthi in
Southern Spain
Raúl Castaño,
1Barbara Scherm,
2and Manuel Avilés
11Department of Agroforestry Sciences, Escuela T´ecnica Superior de Ingenier´ıaa Agron´omica (ETSIA), University of Seville,
Carretera de Utrera Km 1, 41013 Seville, Spain
2Department of Plant Protection, University of Sassari, Via Enrico de Nicola 9, 07100 Sassari, Italy
Correspondence should be addressed to Ra´ul Casta˜no; [email protected] Received 18 February 2014; Accepted 20 May 2014; Published 6 July 2014 Academic Editor: Praveen Rao Juvvadi
Copyright © 2014 Ra´ul Casta˜no et al. This is an open access article distributed under the Creative Commons Attribution License, which permits unrestricted use, distribution, and reproduction in any medium, provided the original work is properly cited. The diversity of races and prevalence of pathogenic populations of Fusarium oxysporum f. sp. dianthi (Fod) were surveyed in an area in southern Spain. From 54 farms, 132 isolates were collected from wilted carnation plants. Isolates were characterized by RAPD-PCR, DNA sequence analysis of the TEF1-𝛼 gene, and race-specific molecular markers. Selected isolates from RAPD groups were phenotypically evaluated by pathogenicity tests. Data analysis showed that Fod race 2 was the most frequent and prevalent race in the study area, followed by race 1/8. Moreover, phylogenetic analyses showed similar results, which were different to those of the race-specific PCR assays. It was concluded that (i) seven isolates were not classified in groups where Fod testers were clustered; even they showed different results when race-specific markers were used, (ii) ten isolates with retarded race 1 or race 8 specific band were characterized as F. proliferatum by TEF1-𝛼 gene sequencing and clustered into an outgroup, and (iii) six isolates failed to generate an amplification signal using race-specific markers. Furthermore, three of them were grouped close to race 2 tester according to the phylogenetic analyses, showing the same differential pathogenicity as race 2. This may indicate a Fod race 2 subgroup in this region.
1. Introduction
Fusarium oxysporum Schlechtend. Emend. W. C. Snyder &
H. N. Hans is a species complex of morphologically similar fungi with multiple phylogenetic origins that fall into three well-supported clades [1]. Pathogenic isolates of F. oxysporum often display a high degree of host specificity and can be subdivided into formae speciales on the basis of the plant species affected. The forma specialis dianthi (Fod) causes Fusarium wilt of carnation (Dianthus caryophyllus L.), a disease that is responsible for severe losses in areas where this flower is grown. The pathogen is widespread in soils worldwide [2–5].
In 2009, Andalusia accounted for 55.4% of the total carnations produced in Spain, and 62.1% of this was from the province of C´adiz [6], which is the greatest producer in Europe [7]. In this area, Fusarium wilt disease appeared five years after the introduction of the first carnation plants in 1975. Since then, it has been reported continuously [8].
Despite this, exhaustive studies on race diversity and pattern of Fod distribution in this area are lacking [5].
Fod can be distinguished into physiological races on the basis of the capacity of the pathogen to attack differential carnation cultivars. To date, ten races have been described worldwide [5]. Races 1 and 8 apparently originated in the Italian Riviera, where they are associated with Mediterranean carnation ecotypes found in Italy, France, and Spain. Race 2 is widespread in all areas of carnation cultivation in the world. Race 4 is found in carnation cultivars in the United States, Italy, Israel, Spain, and Colombia. Race 3 was initially classified as a Fod race, but DNA-based methods recently reclassified it as F. redolens, revealing that F. redolens and F.
oxysporum not only are different species but also lack a sister
group relationship [1]. The other races described have not been found in carnation crops in the Spanish areas studied so far [9].
Race classification of Fod can be established by testing its virulence using differential carnation cultivars [4,5] or PCR Volume 2014, Article ID 582672, 14 pages
2 (6) 3 (6) 4 (5) 18 (3) 13 (2) 6 (3) 25 (1) 24 (2) 1 (5) 11 (7) 17 (7) 5 (8) 15 (6) 10 (13) 7 (20) 16 (1) 21 (5) 14 (1) 20 (1) 19 (3) 9 (7) 12 (4) 23 (6) N C ́adiz NE SE SW NW
Figure 1: Wilted carnation plants collected in the north-west of the province of Cadiz. Top left: map of Andalusia showing the north-west area of the province of Cadiz. Bottom: the locations of some of the areas studied are represented in bold with code numbers and
referenced inTable 1. In parentheses: numbers of isolates recovered
in each zone.
with specific molecular markers to determine Fod races 2, 4, and, jointly, 1 and 8 [10]. Regarding race-specific primers, they were designed on the basis of transposable elements Fot1 and impala, whose restriction profiles show a race-associated polymorphic pattern using Southern hybridization [10]. Fin-gerprinting techniques (such as random amplification of polymorphic DNA polymerase chain reaction, RAPD-PCR) have been applied to evaluate the level of genetic diversity in various F. oxysporum formae speciales, including dianthi [3,4,11]. This technique can also separate Fod races [4,11]. Moreover, previous studies to establish a reliable molecular marker for phylogenetic studies on different Fusarium species have been conducted. The TEF1-𝛼 gene is considered highly informative for differentiating Fusarium spp. and many
formae speciales within the F. oxysporum species complex
[12–15]. These phylogenetic techniques could provide further information and reinforce the separation of Fod races using specific markers.
The determination of race and genetic diversity in pathogen populations in a given region provides relevant information of practical significance [16], which is useful for developing resistance breeding programs aimed at selecting cultivars that can reduce the devastating effects of Fusarium wilt in a given area [17, 18]. The aim of this study was to survey the racial diversity and prevalence of a Fod population in the north-west of the C´adiz province, a region with a long tradition of carnation cultivation, using phenotypic and molecular assays.
2. Materials and Methods
2.1. Sampling Process. Wilted carnation plants were sampled
from 54 randomly selected farms in three municipal areas of Andalucia, Spain (Chipiona, Sanlucar de Barrameda, and Rota) from 2004 to 2006. One isolate was obtained from each disease focus in different greenhouses per farm. The sampling locations are shown inTable 1andFigure 1.
2.2. Pathogen Isolation. Plants were cut at the stem base and
the obtained pieces were surface-sterilized using 10% (v/v) sodium hypochlorite for 2 min. After two wash steps in sterile distilled water (SDW), the stem fragments were air-dried and transferred to Komada’s Fusarium semiselective medium [19]. Plates were incubated at 25∘C and fungi were monitored daily. Later, fungi were transferred to potato dextrose agar (PDA, Merck) plates. A total of 132 isolates displaying Fusarium morphology were recovered. Two monosporic cultures from each isolate were stored in silica gel at 5 to 10∘C [20].
2.3. Total DNA Isolation. Fungi stored on silica gel were
grown on sterile cellophane disk plates on PDA and incubated at 25∘C for 7 to 8 days. Mycelium was recovered and transferred to a sterile Eppendorf tube. Tubes were frozen and then lyophilized (Telstar Cryodos, Telstar, UK) for 24 h. Total genomic DNA was extracted from the lyophilized isolates as described by Cassago et al. [21], with minor modifications. Approximately 0.2 g of lyophilized mycelium was used. DNA was resuspended in 40𝜇L of TE-Rnase (10 𝜇g/mL) at 37∘C for 30 min. Concentration and purity of total DNA were determined by spectrophotometric measurements at 260 nm and 280 nm.
2.4. RAPD-PCR Analysis. Population profiles were created
by RAPD-PCR fingerprinting. Five 10-mer oligonucleotides were chosen on the basis of (i) previous genetic diversity studies with Fod and other F. oxysporum pathogens (OPB-01 [22,23] and OPE-11 and OPE-16 [4]) and (ii) polymorphic band patterns (OPH-19 and OPH-20 (Operon Technologies, Alameda, CA, USA)).
The amplifications were performed in a total volume of 20𝜇L containing 7.5 ng 𝜇L−1 of genomic DNA, 1x Biotools standard reaction buffer, 2.5 mM of MgCl2, 100𝜇M of dNTP (Biotools, Madrid, Spain), 1𝜇M of each primer, and 1 U of Biotools DNA polymerase (Biotools, Madrid, Spain). The amplification conditions were as follows: a denaturation step for 5 min at 94∘C, followed by 45 amplification cycles of 30 s at 94∘C, 1 min at 36∘C, and 2 min at 72∘C. A final extension step was performed for 5 min at 72∘C. Reactions were performed with a thermal cycler (Gene Amp PCR System 2700, Applied Biosystems). Amplified DNA products were run on 1.5% agarose gels and separated by electrophoresis and DNA was visualized and photographed under UV light with a Transilluminator (BioDoc-it System, UVP).
Each band in the RAPD profiles was considered an inde-pendent locus with two alleles and transformed into binary codes on the basis of presence versus absence of amplification products (1 for presence and 0 for absence). The amplification products of different primers recorded on photos were scored
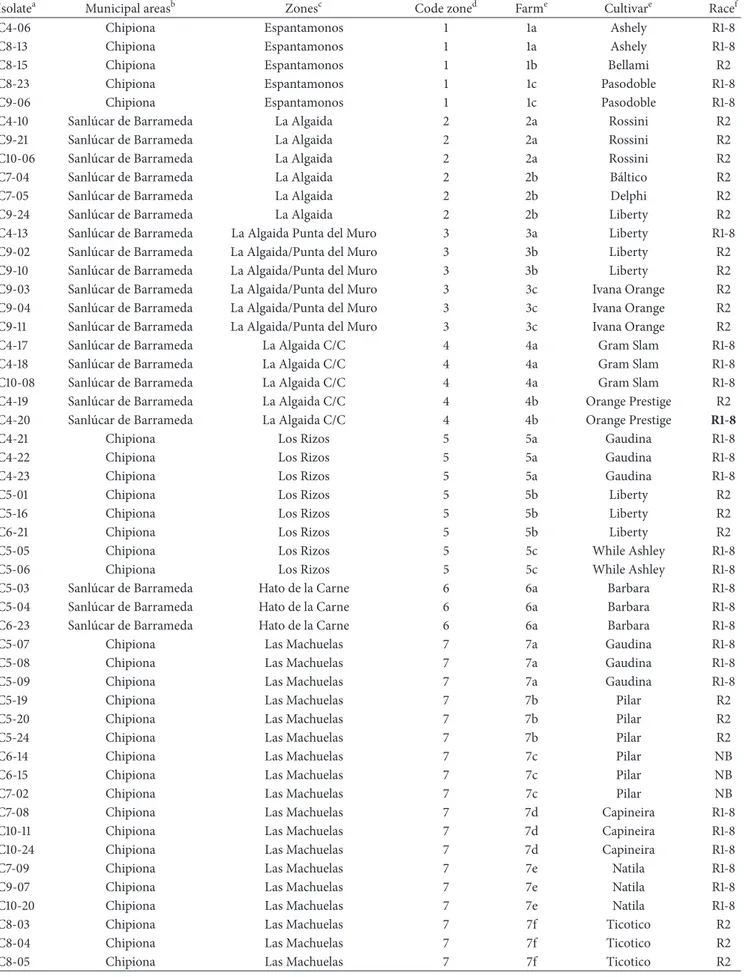
Table 1: Fusarium oxysporum populations from diseased carnation cultivars in the north-west of the province of Cadiz, ordered by farm.
Isolatea Municipal areasb Zonesc Code zoned Farme Cultivare Racef
C4-06 Chipiona Espantamonos 1 1a Ashely R1-8
C8-13 Chipiona Espantamonos 1 1a Ashely R1-8
C8-15 Chipiona Espantamonos 1 1b Bellami R2
C8-23 Chipiona Espantamonos 1 1c Pasodoble R1-8
C9-06 Chipiona Espantamonos 1 1c Pasodoble R1-8
C4-10 Sanl´ucar de Barrameda La Algaida 2 2a Rossini R2
C9-21 Sanl´ucar de Barrameda La Algaida 2 2a Rossini R2
C10-06 Sanl´ucar de Barrameda La Algaida 2 2a Rossini R2
C7-04 Sanl´ucar de Barrameda La Algaida 2 2b B´altico R2
C7-05 Sanl´ucar de Barrameda La Algaida 2 2b Delphi R2
C9-24 Sanl´ucar de Barrameda La Algaida 2 2b Liberty R2
C4-13 Sanl´ucar de Barrameda La Algaida Punta del Muro 3 3a Liberty R1-8
C9-02 Sanl´ucar de Barrameda La Algaida/Punta del Muro 3 3b Liberty R2
C9-10 Sanl´ucar de Barrameda La Algaida/Punta del Muro 3 3b Liberty R2
C9-03 Sanl´ucar de Barrameda La Algaida/Punta del Muro 3 3c Ivana Orange R2
C9-04 Sanl´ucar de Barrameda La Algaida/Punta del Muro 3 3c Ivana Orange R2
C9-11 Sanl´ucar de Barrameda La Algaida/Punta del Muro 3 3c Ivana Orange R2
C4-17 Sanl´ucar de Barrameda La Algaida C/C 4 4a Gram Slam R1-8
C4-18 Sanl´ucar de Barrameda La Algaida C/C 4 4a Gram Slam R1-8
C10-08 Sanl´ucar de Barrameda La Algaida C/C 4 4a Gram Slam R1-8
C4-19 Sanl´ucar de Barrameda La Algaida C/C 4 4b Orange Prestige R2
C4-20 Sanl´ucar de Barrameda La Algaida C/C 4 4b Orange Prestige R1-8
C4-21 Chipiona Los Rizos 5 5a Gaudina R1-8
C4-22 Chipiona Los Rizos 5 5a Gaudina R1-8
C4-23 Chipiona Los Rizos 5 5a Gaudina R1-8
C5-01 Chipiona Los Rizos 5 5b Liberty R2
C5-16 Chipiona Los Rizos 5 5b Liberty R2
C6-21 Chipiona Los Rizos 5 5b Liberty R2
C5-05 Chipiona Los Rizos 5 5c While Ashley R1-8
C5-06 Chipiona Los Rizos 5 5c While Ashley R1-8
C5-03 Sanl´ucar de Barrameda Hato de la Carne 6 6a Barbara R1-8
C5-04 Sanl´ucar de Barrameda Hato de la Carne 6 6a Barbara R1-8
C6-23 Sanl´ucar de Barrameda Hato de la Carne 6 6a Barbara R1-8
C5-07 Chipiona Las Machuelas 7 7a Gaudina R1-8
C5-08 Chipiona Las Machuelas 7 7a Gaudina R1-8
C5-09 Chipiona Las Machuelas 7 7a Gaudina R1-8
C5-19 Chipiona Las Machuelas 7 7b Pilar R2
C5-20 Chipiona Las Machuelas 7 7b Pilar R2
C5-24 Chipiona Las Machuelas 7 7b Pilar R2
C6-14 Chipiona Las Machuelas 7 7c Pilar NB
C6-15 Chipiona Las Machuelas 7 7c Pilar NB
C7-02 Chipiona Las Machuelas 7 7c Pilar NB
C7-08 Chipiona Las Machuelas 7 7d Capineira R1-8
C10-11 Chipiona Las Machuelas 7 7d Capineira R1-8
C10-24 Chipiona Las Machuelas 7 7d Capineira R1-8
C7-09 Chipiona Las Machuelas 7 7e Natila R1-8
C9-07 Chipiona Las Machuelas 7 7e Natila R1-8
C10-20 Chipiona Las Machuelas 7 7e Natila R1-8
C8-03 Chipiona Las Machuelas 7 7f Ticotico R2
C8-04 Chipiona Las Machuelas 7 7f Ticotico R2
Table 1: Continued.
Isolatea Municipal areasb Zonesc Code zoned Farme Cultivare Racef
C10-04 Chipiona Las Machuelas 7 7f Ticotico R1-8
C10-13 Chipiona Las Machuelas 7 7g Star R1-8
C5-21 Chipiona Huerta San Juan 8 8a Eveling R2
C6-24 Chipiona Huerta San Juan 8 8a Eveling R2
C9-20 Chipiona Huerta San Juan 8 8a Eveling R2
C5-22 Chipiona Majada de las vacas 9 9a M´aster NB
C5-23 Chipiona Majada de las vacas 9 9a Master NB
C5-25 Chipiona Majada de las vacas 9 9a Master R1-8
C6-01 Chipiona Majada de las vacas 9 9a Master NB
C6-03 Chipiona Majada de las vacas 9 9b Pilar R2
C6-04 Chipiona Majada de las vacas 9 9b Pilar R2
C6-07 Chipiona Majada de las vacas 9 9b Pilar R2
C6-06 Chipiona Escalereta 10 10a B´altico R2
C6-08 Chipiona Escalereta 10 10a B´altico R2
C10-10 Chipiona Escalereta 10 10a B´altico R2
C6-09 Chipiona Escalereta 10 10b Maestro R2
C6-10 Chipiona Escalereta 10 10b Maestro R2
C6-25 Chipiona Escalereta 10 10b Maestro R2
C7-12 Chipiona Escalereta 10 10c Imagine R1-8
C7-13 Chipiona Escalereta 10 10c Imagine R1-8
C7-14 Chipiona Escalereta 10 10c Imagine R2
C7-17 Chipiona Escalereta 10 10c Imagine R2
C7-20 Chipiona Escalereta 10 10c Imagine R1-8
C9-18 Chipiona Escalereta 10 10c Imagine R2
C10-03 Chipiona Escalereta 10 10c Imagine R2
C6-11 Chipiona Pinar Mart´ın 11 11a Berry R1-8
C7-01 Chipiona Pinar Mart´ın 11 11a Berry R1-8
C6-12 Chipiona Pinar Mart´ın 11 11b Medea R1-8
C6-13 Chipiona Pinar Mart´ın 11 11b Medea R2
C8-10 Chipiona Pinar Mart´ın 11 11c Rayo de Sole R2
C8-11 Chipiona Pinar Mart´ın 11 11c Rayo de Sole R2
C10-05 Chipiona Pinar Mart´ın 11 11c Rayo de Sole R1-8
C6-16 Chipiona El Olivar 12 12a Dover R2
C6-17 Chipiona El Olivar 12 12a Dover R2
C7-03 Chipiona El Olivar 12 12a Dover R2
C11-03 Chipiona El Olivar 12 12b Arena R2
C7-06 Sanl´ucar de Barrameda Madre del Agua 13 13a Firato R2
C10-17 Sanl´ucar de Barrameda Madre del Agua 13 13a Firato R2
C7-11 Chipiona Majadales 14 14a Tempo R2
C7-16 Chipiona Los Llanos 15 15a Lolita R2
C7-18 Chipiona Los Llanos 15 15a Lolita R2
C11-04 Chipiona Los Llanos 15 15a Lolita R2
C10-14 Chipiona Los Llanos/Envidio 15 15b Claudia R1-8
C10-15 Chipiona Los Llanos/Envidio 15 15b Claudia R1-8
C10-16 Chipiona Los Llanos/Envidio 15 15b Claudia R1-8
C8-02 Chipiona Cerro Col´on 16 16a Delfi R2
C8-06 Chipiona Loma Baja 17 17a Splendido R2
C8-07 Chipiona Loma Baja 17 17a Splendido R2
C8-08 Chipiona Loma Baja 17 17a Splendido R1-8
C8-09 Chipiona Loma Baja 17 17a Splendido R1-8
Table 1: Continued.
Isolatea Municipal areasb Zonesc Code zoned Farme Cultivare Racef
C8-20 Chipiona Loma Baja 17 17b Eilat R2
C8-24 Chipiona Loma Baja 17 17b Eilat R2
C8-22 Sanl´ucar de Barrameda Santa Tecla 18 18a Montezuma R2
C8-14 Sanl´ucar de Barrameda Santa Tecla 18 18b Tauroc R1-8
C9-05 Sanl´ucar de Barrameda Santa Tecla 18 18b Tauroc R1-8
C8-21 Chipiona Majadales alto 19 19a Solar Oro R1-8
C9-17 Chipiona Majadales alto 19 19b White Fleurette R1-8
C11-02 Chipiona Majadales alto 19 19c Millenium R2
C9-08 Rota Pe˜na del ´Aguila 20 20a Rebeca R1-8
C4-01 Chipiona Aulagar 21 21a Pink Ashley R2
C4-02 Chipiona Aulagar 21 21a Pink Ashley R2
C4-03 Chipiona Aulagar 21 21a Pink Ashley R2
C4-04 Chipiona Aulagar 21 21b Pink Ashley R2
C7-10 Chipiona Aulagar 21 21b Pink Ashley R2
C4-14 Chipiona Monteruco 22 22a Cerise R. Barb. R1-8
C4-15 Chipiona Monteruco 22 22a Cerise R. Barb. R1-8
C4-16 Chipiona Monteruco 22 22a Cerise R. Barb. R1-8
C10-07 Chipiona Monteruco 22 22a Cerise R. Barb. R1-8
C7-07 Chipiona Monteruco 22 22b Orbit R1-8
C9-14 Chipiona Monteruco 22 22b Orbit R1-8
C9-25 Chipiona Monteruco 22 22b Orbit R1-8
C7-21 Chipiona Lopina 23 23a Nogalte R2
C7-22 Chipiona Lopina 23 23a Nogalte R2
C7-23 Chipiona Lopina 23 23a Nogalte R2
C7-24 Chipiona Lopina 23 23a Nogalte R2
C7-25 Chipiona Lopina 23 23a Nogalte R2
C8-01 Chipiona Lopina 23 23a Nogalte R2
C9-15 Chipiona La Loma 24 24a Spectro R1-8
C9-19 Chipiona La Loma 24 24b Spectro R1-8
C10-02 Chipiona Copina 25 25a Delphi R2
a
Names of population isolates
bMunicipal areas (Chipiona, Sanl´ucar de Barrameda, and Rota) cZones in which farms were studied
dA random code assigned to each zone
eCarnation cultivar finding in the corresponding farm, which isolates were obtained. Code zone with the same number but different letters means same zone
but different farms
fFusarium oxysporum f. sp. dianthi (Fod) determination using specific primers [10]. R1-8: Fod race 1 or race 8; R2: Fod race 2; R1-8 in bold: retarded
electrophoretic mobility band; NB: nonamplified band.
manually and a binary matrix was thus generated [24]. Forty-one markers were analyzed using five operon primers. From the binary data matrix, the distances were estimated using the distance estimation method described by Link et al. [25], using TREECON [26] of the Windows software package. Tree topology was inferred with the UPGMA (unweighted paired group method with arithmetic averages) clustering method to construct an unrooted tree [24]. Amplifications were repeated once with each monosporic culture from each isolate.
2.5. Isolate Determination by DNA Sequencing. A portion
of the translation elongation factor 1-𝛼 gene (TEF1-𝛼) was amplified using EF1 and EF2 primers. Each 50𝜇L of PCR reaction contained 7.5 ng𝜇L−1of genomic DNA, 1x Biotools
standard reaction buffer, 3.75 mM of MgCl2, 100𝜇M of dNTP (Biotools, Madrid, Spain), 0.5𝜇M of each primer, and 1 U of Biotools Pfu DNA polymerase (Biotools, Madrid, Spain). The PCR for both primer pairs was run at 95∘C for 2 min, followed by 10 cycles of 94∘C for 1 min, 54∘C for 2 min, and an elongation phase at 72∘C for 2 min, and 20 cycles of 94∘C for 1 min, 54∘C for 2 min, and an elongation phase at 72∘C for 2 min with an increase of 4 s per cycle, concluded by a final elongation phase at 72∘C for 5 min. Reactions were performed with a thermal cycler (Gene Amp PCR System 2700, Applied Biosystems). Amplified DNA products were run on 1.5% agarose gels and DNA was photographed under UV light, as described previously. The expected amplification product size was 700 bp. PCR products were purified using Speedtools PCR Clean-Up Kit (Biotools, Madrid, Spain). Sequencing was performed by Secugen (Secugen, Madrid, Spain).
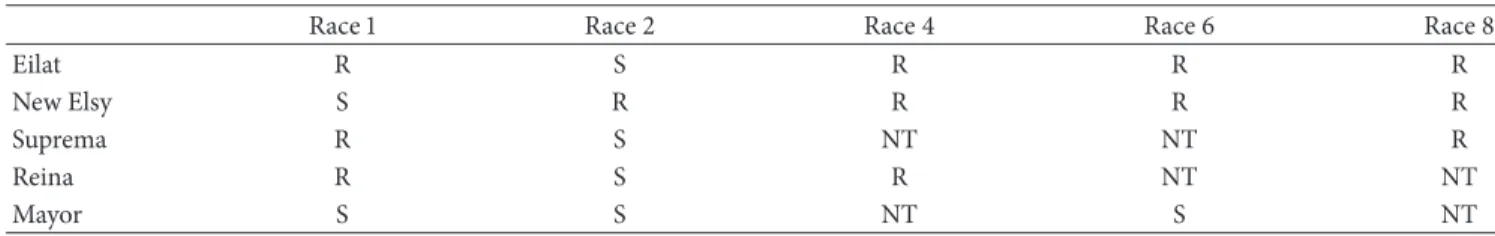
Table 2: Response of five carnation cultivars tested to races 1, 2, 4, 6, and 8 of Fusarium oxysporum f. sp. dianthi.
Race 1 Race 2 Race 4 Race 6 Race 8
Eilat R S R R R
New Elsy S R R R R
Suprema R S NT NT R
Reina R S R NT NT
Mayor S S NT S NT
R: resistant; S: susceptible; NT: not tested.
Table 3: Selected isolates from the RAPD study.
Isolatea Municipal
areab Species name
c Raced RAPD Group TEF Group GenBank accessione
C5-20 Chipiona F. oxysporum 2 I I GU199330
C6-15 Chipiona F. oxysporum NB I I GU199333
C6-25 Chipiona F. oxysporum 2 I I GU226824
C9-10 Sanl´ucar de B. F. oxysporum 2 II I GU226828
C5-23 Chipiona F. oxysporum NB IV IV GU199331
C6-01 Chipiona F. oxysporum NB IV IV GU199332
C10-07 Chipiona F. oxysporum 1-8 V IV GU226826
C8-08 Chipiona F. oxysporum RB VI IV GU226825
C4-17 Sanl´ucar de B. F. oxysporum 1-8 VII III GU199328
C4-22 Chipiona F. oxysporum 1-8 VIII III GU199329
C10-14 Chipiona F. oxysporum 1-8 VIII III GU226827
C4-15 Chipiona F. proliferatum RB IX V GU191842
R1 Marismas de
Lebrija F. oxysporum 1-8 VIII III
R2 Chipiona F. oxysporum 2 I I
R4 Italy F. oxysporum 4 III II
R8 Italy F. oxysporum 1-8 VIII III
Fr South ´Africa F. redolens — — —
aR1 (race 1), R2 (race 2), R4 (race 4), R8 (Race 8), and Fr (Fusarium redolens) bMunicipal area as shown inTable 1
cdetermined by query and comparison with sequence databases using TEF1-𝛼 gene sequences
dRace assignments using specific primers; 2: Race 2; NB: no band amplification; 1-8: race 1 or race 8; RB: retarded race 1 or race 8 band; 4: race 4 eAccession numbers of TEF1-𝛼 gene sequences.
Sequences were edited and then blasted against the GenBank database (http://blast.ncbi.nlm.nih.gov/Blast.cgi). To match the TEF1-𝛼 gene in conjunction with GenBank, the Fusarium-ID database (http://fusarium.cbio.psu.edu) was used. This database is publicly available and contains vouchered and well-characterized sequences of Gibberella
fujikuroi, F. oxysporum, and F. solani species [15]. Accession
numbers of TEF1-𝛼 regions from selected isolates are shown inTable 3.
2.6. Phylogenetic Distance Tree Using TEF1-𝛼 Gene Sequences.
Sequences were edited using Sequence Scanner v1.0 software (Applied Biosystems) and aligned to construct a phyloge-netic tree using the MEGA5 software [27]. Evolutionary history was inferred from the maximum likelihood method based on the Kimura 2-parameter model [28]. The tree with the highest log-likelihood (−1413.6427) is shown. The percentage of trees in which the associated taxa clustered together is shown next to the branches. Initial tree(s) for
the heuristic search (Close-Neighbor-Interchange algorithm) were obtained automatically as follows. When the number of common sites was<100 or less than one fourth of the total number of sites, the maximum parsimony method was used; otherwise, the BIONJ method with a maximum composite likelihood (MCL) distance matrix was used. The tree was drawn to scale, with branch lengths measured in the number of substitutions per site. The analysis involved 137 nucleotide sequences. All positions containing gaps and missing data were eliminated. There were a total of 640 positions in the final dataset.
2.7. Bacterial, F. redolens, and Fod Race-Specific PCR Assays.
Bacterial 16S rDNA was used to control the presence and accessibility of eubacterial DNA, which could amplify false RAPD markers. For this purpose, 704f and 1495r primers [29] were used. Specific Fusarium redolens (Fr) primers, redolens-F, and redolens-R [1], were used to detect the presence of this pathogen in the population. Fod races were determined using
a multiplex PCR with race-specific primers (Ft3f, IMP2f, R8.1r, R2.1r, and R4.2r) designed by Chiocchetti et al. [10]. Primers were obtained from cVIRAL (Alcobendas, Madrid, Spain). Negative and positive controls were included in all experiments. The bacterial isolate 911 (Collection of Dr. M. Aviles, University of Seville, Spain), F. redolens (provided by Dr. E.T. Steenkamp, University of Pretoria, Pretoria, South Africa), and the Fod race testers (provide by Dr. J.M. Melero, CSIC, C´ordoba, Spain) were used as positive controls for each PCR assay.
Twenty microliters of reaction volume containing 7.5 ng𝜇L−1 of genomic DNA, 1x Biotools standard reaction buffer, 2.5 mM of MgCl2, 100𝜇M of dNTP (Biotools, Madrid, Spain), and 1 U of Biotools DNA polymerase (Biotools, Madrid, Spain) were used. Primers were added as follows: 0.5𝜇M each for eubacterial DNA detection [29], 0.5𝜇M each for Fr detection [1], and 2.5𝜇M each for race determination [10]. Reactions were performed with a thermal cycler (Gene Amp PCR System 2700, Applied Biosystems) following the respective authors’ protocols. After amplification, the reaction mixture was loaded onto a 1.5% agarose gel and photographed under UV light as described previously. The expected amplification product sizes were 800 bp for eubacteria, 386 bp for Fr, and 295, 564, and 1315 bp for Fod races 1/8, race 2, and race 4, respectively. Analyses were repeated one with each monosporic culture from each isolate.
2.8. Fusarium Wilt Pathogenicity Test. Determination of race
is based on the response of the different cultivars to a particular isolate. For this phenotypic assay, at least one isolate of each RAPD group was selected on the basis of the similarity index after the fingerprinting study [9,16,23]. Pathogenicity test was performed with five different carnation (D. caryophyllus) cultivars (Reina, New Elsy, Mayor, Suprema, and Eilat; summarized response inTable 2) in a greenhouse in Seville (Seville, Spain) from June to August 2009. Plants were provided by Barberet & Blanc (Murcia, Spain) as bare-root cuttings (8 to 12 true-leaf stages). Fungi were grown for 7 to 10 days on AMAP (10 g L−1agar, 10 g L−1malt extract (Difco, Le Pont de Claix, France), and 2 g L−1 asparagine (Difco, Le Pont de Claix, France)) plates at 25∘C. Five mL of SDW were added to the plates and the surface was scraped with a sterile spatula. Inocula were filtered through two layers of sterile gauze. The concentration of conidia was determined with a hemocytometer and then diluted in SDW to give suspensions of 106 conidia mL−1. These suspensions were used to inoculate carnation cuttings by root dipping for 30 min using 50 to 80 mL per plant. Controls were carried out by dipping plant roots in sterile water. Inoculated cuttings were individually planted in pots containing peat fertilized with 0.5 g L−1of Peter’s Foliar Feed (27 + 15 + 12; N + P2O5+ K2O, and micronutrients; Scotts, Heerlen, the Netherlands) and 0.5 g L−1 of Fertigreen (Bur´es, Barcelona, Spain). The experimental design involved five plants for each isolate and cultivar combination, randomized within each cultivar.
Disease severity was scored using the symptom severity scale described by Baayen and van der Plas [30] as follows:
0 = asymptomatic plant (0% disease); 1 = weakly affected plant (5%); 2 = local base-stem symptoms (20%); 3 = unilateral and well-developed symptoms (50%); 4 = strong disease symptoms throughout the plant (80%); 5 = dead plant (100%). Disease severity was monitored twice a week. At each assessment, the mean disease severity per pot was calculated. The standardized area under the disease progress curve (AUDPC) was calculated by disease severity integrated between symptom onset and the final time of the assay and divided by the total duration (days) of the epidemic in each bioassay. Therefore, AUDPC data can range from 0 to 1. High severity was considered when AUDPC was higher than 0.45. Moderate severity was considered when AUDPC data range between 0.45 and 0.30 and low severity was considered when AUDPC data range between 0.30 and 0.20. Pathogenicity test was repeated twice. Each test lasted three months.
2.9. Statistical Analyses. Data collected from the
pathogenic-ity bioassay were analyzed with the Statgraphics Plus program (version 5.1; Statistical Graphics Corp., Rockville, MD). Data were analyzed using one-way ANOVA. The means were compared using Tukey’s test (𝑃 < 0.05).
3. Results
3.1. Classification of Isolates Using RAPD Analysis. All
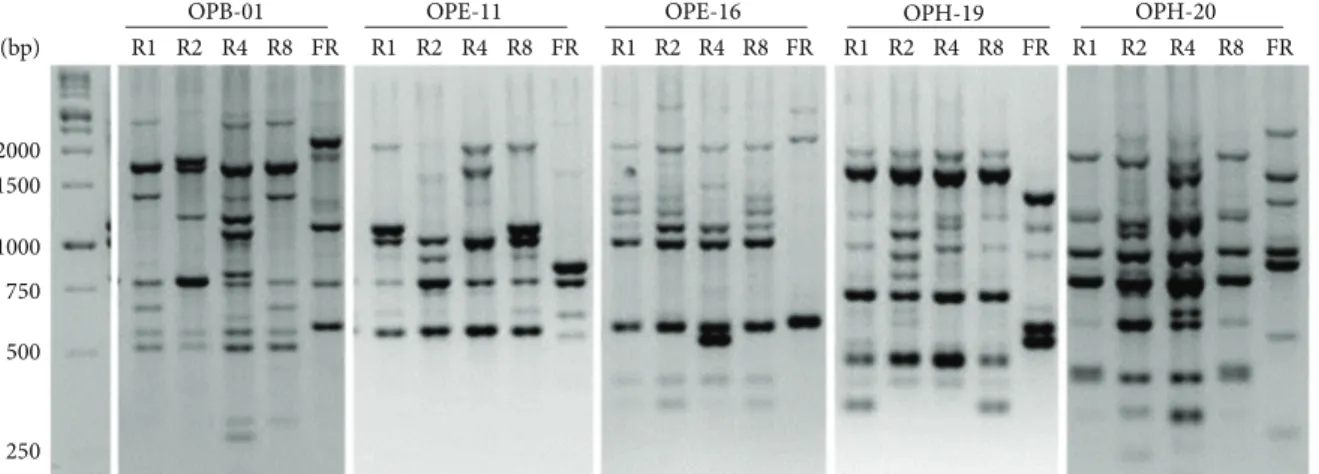
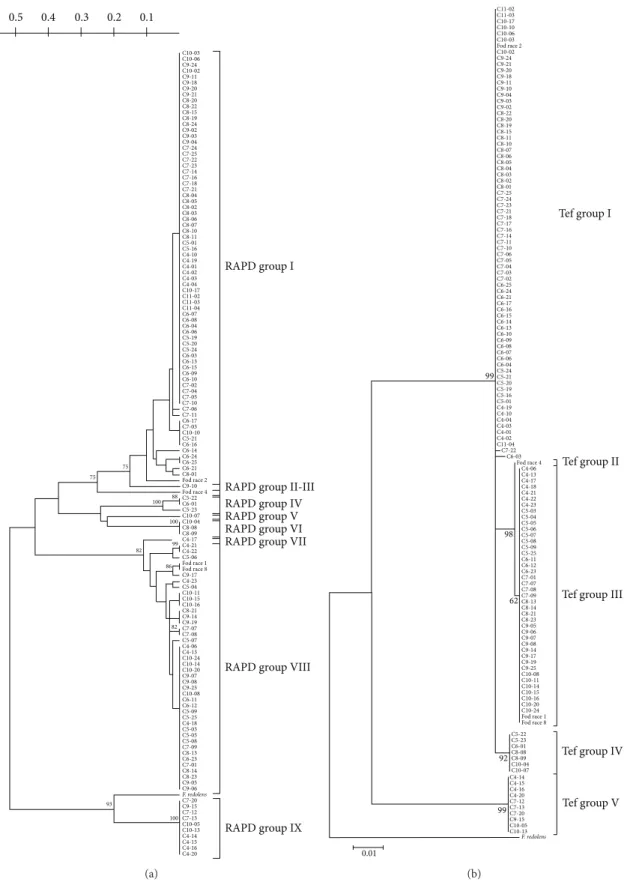
iso-lates were independently subjected to RAPD-PCR analysis employing five random decamer primers. In the preliminary experiments, all the tested primers produced distinct and reproducible band profiles (Figure 2). Reproducible markers were used in cluster analysis. On the basis of a similarity matrix, a dendrogram using the UPGMA was constructed to illustrate the level of similarity among isolates (Figure 3(a)). According to the patterns of all five primers, isolates were classified into nine RAPD groups “haplogroups,” correspond-ing to a similarity of more than 90%. Each RAPD group showed high genetic homogeneity.
Distance-based analyses of the RAPD groups are shown inFigure 3(a). Cluster analysis separated the Fod race testers with an approximately 60% similarity index, with a bootstrap support of 93%. Seventy-three isolates (plus the Fod race 2 tester) were placed in RAPD group I. The RAPD group II showed one isolate (C9-10), while Fod race 4 was clustered in RAPD group III (Figure 3(a)). Between RAPD groups III and VII, seven isolates were clustered in three distinct groups (RAPD groups IV, V, and VI), The RAPD group VII showed only one isolate (C7-14). Forty isolates were clustered in RAPD group VIII, together with the Fod races 1 and 8 testers. Finally, ten isolates were outgroups (Figure 3(a)) and clustered in RAPD group IX; F. redolens was also clustered as an outgroup, closer to RAPD group IX.
3.2. Phylogeny Using the TEF1-𝛼 Sequence. Phylogenetic
anal-ysis of the partial TEF1-𝛼 gene from all isolates (Figure 3(b)) revealed five groups and F. redolens as an outgroup. The Fod race 2 tester was found in TEF group I, along with 74 isolates (the same as RAPD groups I and II). Race 4 tester, as in RAPD analysis, was the only one to cluster in TEF group II. Races 1 and 8 testers and 41 isolates (the same as RAPD groups VII
R1 R2 R4 R8 FR OPB-01 R1 R2 R4 R8 FR OPE-11 R1 R2 R4 R8 FR OPE-16 R1 R2 R4 R8 FR OPH-19 R1 R2 R4 R8 FR OPH-20 1000 750 500 250 2000 1500 (bp)
Figure 2: Random amplified polymorphisms DNA (RAPD) patterns of the different Fod race testers and one F. redolens obtained with five primers. Left: molecular weight marker (1 kb DNA ladder). Races belonging to R1: Fod race 1, R2: Fod race 2, R4: Fod race 4, R8: Fod race 8, and FR: Fusarium redolens.
and VIII) were clustered in TEF group III. Isolates clustered in the RAPD groups IV, V, and VI (Figure 3(a)) were in TEF group IV (Figure 3(b)), while TEF group V comprised the same ten isolates as RAPD group IX. The TEF1-𝛼 gene region from C4-15 (a representative isolate from RAPD group IX) was subjected to a BlastN enquiry in GenBank, which showed that this isolate had high sequence similarity to F. proliferatum (a single mismatch) and had 100% similarity with isolate 165PG/F (Accession no. GU066714).
3.3. Bacterial, F. redolens, and Fod Race-Specific PCR Assays.
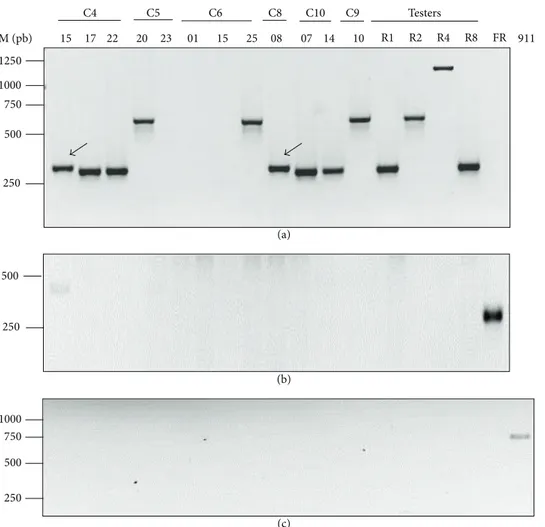
Race-correlated amplifications from 95.45% of the isolates were obtained using race-specific primers, as described by Chiocchetti et al. [10]. For the 132 isolates, Forty-three and seventy of the isolates produced a 295 bp (diagnostic for race 1 or race 8) or a 564 bp (specific for race 2) amplification product, respectively. The 1,315 bp amplification product, corresponding to race 4, was never detected in the sampled isolates. Thirteen isolates produced race 1 or race 8 band with retarded electrophoretic mobility, while six isolates did not show any amplification signal/band. All isolates are classified inTable 1by race using race-specific primers. Neither F. redolens nor eubacteria were detected among the tested isolates. Race characterization and presence of specific amplification bands for F. redolens (Figure 4(b)), eubacteria (Figure 4(c)), and certain isolates (Figure 4(a)) are shown in Figure 4.
Isolates C6-14, C6-15, and C7-02 (from RAPD group I and TEF group I, where Fod race 2 tester is included) did not show a race-specific band. Furthermore, seven isolates were distributed in three RAPD groups (RAPD groups IV, V, and VI) that were clustered in the same TEF group (TEF group IV). RAPD group IV (three isolates) did not produce any race-specific band. RAPD group V (only one isolate) showed a typical race 1- or race 8-specific band. RAPD group VI (three isolates) showed an unusual race 1 or race 8 specific band with retarded electrophoretic mobility. Similarly, isolates from RAPD group IX (all included in the TEF group V) showed race 1 or race 8 band with retarded electrophoretic mobility
(see isolate C4-15). Certain isolates from those RAPD groups are shown inFigure 4(a).
Isolates C10-07 (RAPD group V), C8-08 (RAPD group VI), and C4-15 (RAPD group IX) and the Fod race 8 tester showed an amplification product (race 1 or race 8 band with retarded electrophoretic mobility, ∼295 bp) only with the race-specific primers Ft3/R8.1. As expected, sequencing of this amplicon (Figure 5) showed that it included the 3end of Fot1 transposon and Fot1-flanking genomic region (Fot1-37, GenBank accession X64799), similar to that observed in the Fod race 8 tester. Moreover, the difference in mobility of the amplified bands from isolates C4-15 and C8-08 could be explained by an additional sequence of 17 nucleotides (CAGGGGGGGTCGGTTAC) located downstream to the 3 inverted terminal repeat of the Fot1 transposon, which was not observed in the Fod race 8 tester.
As complementary data, to determine whether the
Fot-1 transposon was moved or the primer target sequences
modified, Southern blot analyses using a Fot1-specific probe were performed with two isolates (C6-14 and C6-15), without specific amplification but clustered near the Fod race 2 tester by both phylogenetic analyses. The restriction pattern confirmed that these two isolates had the same restriction pattern as the Fod race 2 tester, therefore confirming that they indeed belonged to Fod race 2 (data not shown).
3.4. Pathogenicity Assay. Given the high number of isolates,
a pathogenicity test was conducted with a subset of the population (Table 3) using RAPD analysis as the reference. For this purpose, at least one representative isolate from each RAPD group was selected. Cultivars “Suprema,” “Reina,” and “Eilat” were susceptible to isolates C5-20, C6-15, C6-25, and C9-10 and race 2 tester but resistant to others (Table 4). But only “Eilat” showed moderate severity when inoculated with race 4 tester. Moreover, the cultivar “Reina” showed lower severity values than cultivars “Suprema” and “Eilat”. The opposite was found with the cultivar “New Elsy,” which was susceptible to isolates C4-17, C4-22, and C10-14 and to race 1 tester but not race 8 tester. This cultivar could be
C10-03 C10-06 C9-24 C10-02 C9-11 C9-18 C9-20 C9-21 C8-20 C8-22 C8-15 C8-19 C8-24 C9-02 C9-03 C9-04 C7-24 C7-25 C7-22 C7-23 C7-14 C7-16 C7-18 C7-21 C8-04 C8-05 C8-02 C8-03 C8-06 C8-07 C8-10 C8-11 C5-01 C5-16 C4-10 C4-19 C4-01 C4-02 C4-03 C4-04 C10-17 C11-02 C11-03 C11-04 C6-07 C6-08 C6-04 C6-06 C5-19 C5-20 C5-24 C6-03 C6-13 C6-15 C6-09 C6-10 C7-02 C7-04 C7-05 C7-10 C7-06 C7-11 C6-17 C7-03 C10-10 C5-21 C6-16 C6-14 C6-24 C6-25 C6-21 C8-01 Fod race2 C9-10 Fod race4 C5-22 C6-01 C5-23 C10-07 C10-04 C8-08 C8-09 C4-17 C4-21 C4-22 C5-06 Fod race1 Fod race8 C9-17 C4-23 C5-04 C10-11 C10-15 C10-16 C8-21 C9-14 C9-19 C7-07 C7-08 C5-07 C4-06 C4-13 C10-24 C10-14 C10-20 C9-07 C9-08 C9-25 C10-08 C6-11 C6-12 C5-09 C5-25 C4-18 C5-03 C5-05 C5-08 C7-09 C8-13 C6-23 C7-01 C8-14 C8-23 C9-05 C9-06 C7-20 C9-15 C7-12 C7-13 C10-05 C10-13 C4-14 C4-15 C4-16 C4-20 RAPD group I
RAPD group II-III RAPD group IV RAPD group V RAPD group VI RAPD group VII
RAPD group VIII
RAPD group IX 75 75 88 100 100 99 82 86 82 93 100 0.1 0.2 0.3 0.4 0.5 F. redolens (a) C11-02 C11-03 C10-17 C10-10 C10-06 C10-03 Fod race2 C10-02 C9-24 C9-21 C9-20 C9-18 C9-11 C9-10 C9-04 C9-03 C9-02 C8-22 C8-20 C8-19 C8-15 C8-11 C8-10 C8-07 C8-06 C8-05 C8-04 C8-03 C8-02 C8-01 C7-25 C7-24 C7-23 C7-21 C7-18 C7-17 C7-16 C7-14 C7-11 C7-10 C7-06 C7-05 C7-04 C7-03 C7-02 C6-25 C6-24 C6-21 C6-17 C6-16 C6-15 C6-14 C6-13 C6-10 C6-09 C6-08 C6-07 C6-06 C6-04 C5-24 C5-21 C5-20 C5-19 C5-16 C5-01 C4-19 C4-10 C4-04 C4-03 C4-01 C4-02 C11-04 C7-22 C6-03 Fod race4 C4-06 C4-13 C4-17 C4-18 C4-21 C4-22 C4-23 C5-03 C5-04 C5-05 C5-06 C5-07 C5-08 C5-09 C5-25 C6-11 C6-12 C6-23 C7-01 C7-07 C7-08 C7-09 C8-13 C8-14 C8-21 C8-23 C9-05 C9-06 C9-07 C9-08 C9-14 C9-17 C9-19 C9-25 C10-08 C10-11 C10-14 C10-15 C10-16 C10-20 C10-24 Fod race1 Fod race8 C5-22 C5-23 C6-01 C8-08 C8-09 C10-04 C10-07 C4-14 C4-15 C4-16 C4-20 C7-12 C7-13 C7-20 C9-15 C10-05 C10-13 Tef group I Tef group II
Tef group III
Tef group IV Tef group V 99 98 62 92 99 0.01 F. redolens (b)
Figure 3: Phylogenetic analyses using molecular tools: (a) cluster analysis of the RAPD data was performed by the UPGMA method. RAPD groups are shown on the right of the tree. (b) Most likelihood trees were generated by TEF1-𝛼 gene sequencing. Evolutionary history was inferred from the maximum likelihood method based on the Kimura 2-parameter model. The tree with the highest log-likelihood (−1413.6427) is shown. TEF groups are shown on the right of the tree. The numbers on the branches are values from bootstrap analysis, in percentages, with 100 replications for both types of phylogenetic analyses.
1250 1000 750 500 250 500 250 1000 750 500 250 20 23 01 15 25 08 07 14 10 FR 911 15 17 22 M (pb) C4 C5 C6 C8 C10 C9 R1 R2 R4 R8 Testers (a) (b) (c)
Figure 4: Specific Fod-race primers showing different amplification products. Agarose gel electrophoresis (1.5%) of PCR products from the genomic DNA of 12 representative RAPD group isolates, four Fod testers, and one Fusarium redolens isolate. (a) Multiplex PCR in which five primers were mixed in the same reaction tube, where combinations of Ft3/R8.1, Ft3/R2.1, and Ft3/R4.2 resulted in bands of 295 (race 1/8), 564 (race 2), and 1315 bp (race 4), respectively; bands with retarded electrophoretic mobility are shown with an arrow. (b) Multiplex PCR products obtained with the LSU (not shown) and Fusarium redolens-specific primers, with a resulting band of 386 bp. (c) PCR of the eubacterial primers 704f and 1495r where a 900 bp product was not amplified. Fod testers R1 (race 1), R2 (race 2), R4 (race 4), and R8 (race 8); Fr: Fusarium redolens and 911 (bacterial tester). M: molecular size marker (1 kb ladder, Biotools); sizes (base pairs) are indicated on the left.
AAATAGATCGATGGATTTTCTGAGTCTTGCAGATGGGTCGGTTACCAGGGGGGGTCGGTTACATGGGTGCTTGACTT AAATAGATCGATGGATTTTCTGGGTCTTGCAGATGGGTCGGTTACCAGGGGGGGTCGGTTACATGGGTGCTTGACTT AAATAGATCGATGGATTTTCTGGGTCTTACAGATGGGTCGGTTAC ATGGGTGCTTGACTT AAATAGATCGATGGATTTTCTGAGTCTTGCAGATGGGTCGGTTAC ATGGGTGCTTGACTT AAATAGATCGATGGATTTTCTGAGTCTTGCAGGTGGGTCGGTTACCAGGGGGGGTCGGTTACATGGGTGCTTGACT 3 -3 -3 -3 -3 --5 -5 -5 -5 -5 Isolate C4-15 Isolate C8-08 Isolate C10-07 Additional sequence
Isolate Fod race8 tester
Fot1-37 (terminal sequence)
Figure 5: Aligned DNA sequences of the Fot1 final portion and the inverted terminal repeat (ITR) from F. melonis; Fod race 8 (tester) and three isolates from our population, using primers Ft3/R8.1. A sequence complementary to the Fot1 primer in the ITR is displayed in the box. The perfect direct repeats in the ITR are given in bold.
used to differentiate between races 1 and 8. Cultivar “New Elsy,” considered resistant to race 2 in our assay conditions showed a moderate severity for C6-15 and C6-25 isolates and a low severity for C5-20 and C9-10. Isolate C6-15 was confirmed to belong to race 2, as expected from the results of the phylogenetic analyses (Figure 3). The isolates C5-23, C6-01, C8-08, and C10-07 were not pathogenic to any cultivar, although C10-07 isolate showed 0.19 AUDPC value in “New Elsy.” In the cultivar “Mayor,” these four isolates did not show
severity as opposed to the other isolates and Fod races 1 and 2 testers. This last result agrees with data supported inTable 2.
F. proliferatum (isolate C4-15) produced low disease severity
in cultivars “Eilat” and “New Elsy,” although severity was significantly higher than in the control (data not shown).
3.5. Fod Race Frequency and Prevalence. Taking into account
all the data, the frequency and prevalence of each race in the tested area were calculated (Table 5). Regarding frequency,
Table 4: Standardized AUDPC for carnation cultivars. RAPD
Group Isolates/Testers
Carnation cultivars
Suprema Reina New Elsy Eilat Mayor
I C5-20 0.56 (0.02) a 0.34 (0.06) ab 0.23 (0.04) bc 0.67 (0.00) a 0.64 (0.02) a I C6-15 0.61 (0.06) a 0.43 (0.05) a 0.31 (0.02) b 0.75 (0.02) a 0.64 (0.01) a I C6-25 0.64 (0.03) a 0.45 (0.04) a 0.31 (0.07) b 0.74 (0.01) a 0.62 (0.01) a II C9-10 0.54 (0.03) a 0.47 (0.03) a 0.21 (0.03) bc 0.65 (0.02) a 0.61 (0.03) a IV C6-01 0.07 (0.02) bcd 0.04 (0.02) c 0.10 (0.01) cd 0.05 (0.02) c 0.03 (0.01) b V C5-23 0.05 (0.01) cd 0.04 (0.01) c 0.13 (0.02) cd 0.05 (0.05) c 0.02 (0.01) b VI C10-07 0.18 (0.06) b 0.07 (0.01) c 0.19 (0.04) bc 0.10 (0.01) c 0.01 (0.00) b VII C8-08 0.09 (0.02) bc 0.12 (0.04) bc 0.14 (0.02) cd 0.05 (0.01) c 0.08 (0.03) b VIII C4-17 0.00 (0.00) d 0.00 (0.00) c 0.56 (0.04) a 0.02 (0.01) c 0.63 (0.02) a VIII C4-22 0.01 (0.01) cd 0.02 (0.01) c 0.61 (0.02) a 0.02 (0.01) c 0.66 (0.02) a IX C10-14 0.00 (0.00) d 0.02 (0.01) c 0.58 (0.00) a 0.02 (0.01) c 0.55 (0.08) a VIII R1 0.01 (0.01) d 0.03 (0.01) c 0.57 (0.02) a 0.04 (0.01) c 0.54 (0.04) a I R2 0.50 (0.06) a 0.37 (0.04) a 0.13 (0.04) cd 0.63 (0.02) a 0.59 (0.03) a III R4 0.00 (0.00) d 0.13 (0.08) c 0.06 (0.02) d 0.41 (0.11) b 0.06 (0.03) b VIII R8 0.06 (0.01) bcd 0.05 (0.04) c 0.17 (0.01) bc 0.01 (0.01) c 0.07 (0.05) b
Each cultivar was infested using a root-dipping technique in a solution with 106conidia mL−1from each isolate. Testers isolates: R1, Fod race 1; R2, Fod race 2; R4, Fod race 4; and R8, Fod race 8. For each cultivar (columns), numbers with the same letter were not significantly different according to Tukey’s test at 𝑃 < 0.05. In parentheses, SE of the mean (𝑛 = 5).
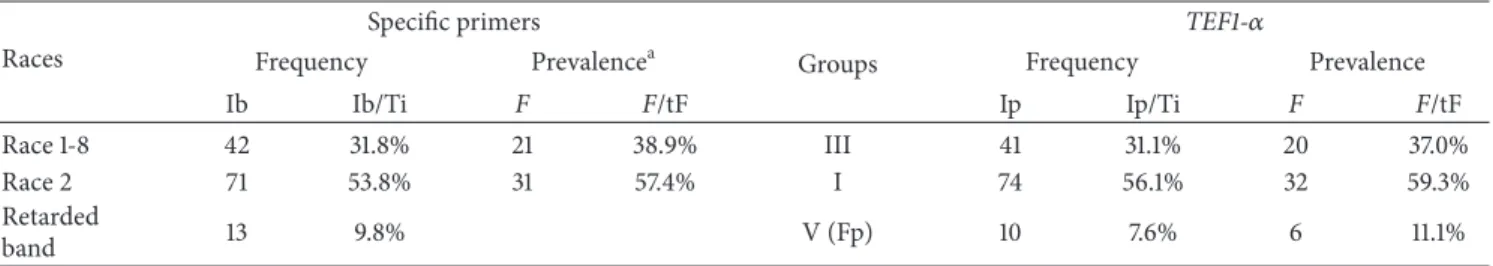
Table 5: Frequency and prevalence of each race by PCR using specific primers and TEF1-𝛼 gene. Races
Specific primers TEF1-𝛼
Frequency Prevalencea Groups Frequency Prevalence
Ib Ib/Ti F F/tF Ip Ip/Ti F F/tF Race 1-8 42 31.8% 21 38.9% III 41 31.1% 20 37.0% Race 2 71 53.8% 31 57.4% I 74 56.1% 32 59.3% Retarded band 13 9.8% V (Fp) 10 7.6% 6 11.1% a
Prevalence was expressed as the ratio “number of farms in which a specific race was found/total farm numbers,” as a percentage. Ib: Isolates with race-specific amplified band
Ip: Isolates using TEF grouping Ti: Total isolates (𝑛 = 132)
F: Numbers of farms in which a specific race F. proliferatum or TEF group was found
tF: Total farms (𝑛 = 54) Fp: Fusarium proliferatum.
using Fod-specific primers, 31.8% (41 isolates plus C10-07) and 53.8% (71 isolates) of the total population belonged to race 1 or race 8 and race 2, respectively. Thirteen of the 132 isolates showed a retarded band, where ten of these could be ascribed to F. proliferatum. RAPD-PCR and TEF1-𝛼 analysis showed similar results. The TEF1-𝛼 analyses identified 31.1% (41 isolates) and 56.1% (71 isolates plus C6-14, C6-15, and C7-02) of the total population to belong to race 1 or race 8 and race 2, respectively.
In this study, 54 farms in 25 zones (Table 1) were sampled. Analysis with specific primers showed a prevalence of 38.9% and 57.4% for race 1 or race 8 and race 2, respectively. Phylogenetic analysis showed a different prevalence, 37.0% and 59.3% for race 1 or race 8 and race 2, respectively.
Fod race 2 and race 1 or race 8 were located together in 10 zones, but their concurrent presence was found on only one farm (11b,Table 1). Moreover, 11 zones displayed only Fod race 2, while 4 zones had only Fod races 1 or 8, indicating
that Fod race 2 was spatially more widespread than Fod race 1 or race 8 in the studied area. The presence of F. proliferatum was independent from that of pathogenic Fod races (farms 4b, 10c, 11c, and 22a). Isolates without specific band amplification grouping in RAPD group IV (C5-22, C5-23, and C6-01) were found on the same farm (9a) together with race 1 or race 8 isolate (C5-25). Isolate C10-07, which showed a specific Fod race 1 or race 8 amplification, was found on a farm, coexisting with F. proliferatum (22a). RAPD group VI was identified on two farms (7f, 17a) coexisting with Fod race 2 isolates. Isolates without the race 2-specific amplicon (C6-14, C6-15, and C7-02) were found on the same farm (7c).
4. Discussion
4.1. Racial Frequency and Prevalence in the Studied Population.
We conclude that Fod race 2 was the most frequent and prevalent in the study area, followed by race 1 or race 8,
which is consistent with another study in the same region [5]. However, the previous report detected a much lower frequency of race 1 than that reported here for 1 or 8. Earlier Fod race diversity reports in other Spanish regions have confirmed frequent and widespread distribution of Fod race 2 in carnation crops [9, 31]. However, race 8 has not been documented in Spain [5,9,31]. Genetic variation studies in this region have previously shown a race structure similar to that encountered worldwide [2,3,32]. Based on these data, carnations cultivars with resistance to race 2 and races 1 and 8 are the most recommended in the studied area.
4.2. Molecular Tools: RAPD-PCR, Sequencing of the TEF1-𝛼
Gene, and Diagnosis of the Fod Race-Specific Primers. Among
the diagnostic protocols for Fusarium species, PCR assays are considered to be one of the most rapid and reliable methods [33]. RAPD fingerprinting and TEF1-𝛼 sequence analyses showed strikingly similar and well-resolved clades for Fod races, both approaches complementing each other. Several studies have applied RAPD fingerprinting to identify all major races of Fod present in other countries [4, 11]. Regarding sequence data, the TEF1-𝛼 gene has been resolved as the most phylogenetically reliable molecular marker of the Fusarium genus, relative to the 𝛽-tubulin gene, ITS regions, and CYP51C gene [14]. Our study demonstrated that TEF1-𝛼 could be used as a molecular marker to group Fod isolates into races, this method taking less time and being more reliable than RAPD-PCR. Indeed, a previous report revealed a higher level of homoplasy shown by RAPD-based phylogeny than the TEF1-𝛼 and mtSSU rDNA gene sequencing data, using F. oxysporum from maize [12]. The high genetic homogeneity within the races found in this population was consistent with that reported in earlier studies [3,32].
We propose that PCR with specific primers, whose ampli-fication is related with the Fot1-transposable element [10], is not sufficient to confirm the presence of Fod in a given area, due to differences in the target genomic sequences. Indeed, these markers showed variable specificity in our population, as described in a previous study [5]. As an example, 13 isolates showed a retarded Fod race 1 or race 8 band when the specific primers were used. Moreover, Fot1 elements exhibit a very low level of polymorphism in the Fusarium oxysporum complex [34]. Our data using race-specific primers showed that Fod race 8 (and probably Fod race 1) has 17 nucleotides less in this region than other Fusarium species. A possible horizontal transfer of Fot1 transposon between Fusarium species [34] could create a deletion in this region, differentiating isolates related to Fod from the others (i.e., Fusarium proliferatum and
F. oxysporum isolate C8-08).
Although molecular techniques were reliable, they must be validated with a phenotypic pathogenicity test. Despite the reasonable degree of disease severity found in the pathogenicity test, the assay showed results that were not expected; for example, susceptible responses in New Elsy and Eilat to race 2 and race 4, respectively. Pathogenicity tests conducted in semicontrolled conditions by Ben-Yephet and Shtienberg [35] indicated that the carnation response to Fod is substantially influenced by environmental conditions
(mainly solar radiation, temperature, and substrate), which could explain the observed results.
4.3. Pathogenicity Test. In our pathogenicity test, the isolate
C6-15 (which did not show a Fod race 2-specific band) behaved like Fod race 2 and was as virulent as other race 2 isolates, such as C6-14 and C7-02. Southern blot analysis (using Fot1 transposon as the probe) showed that two isolates generated the same restriction pattern as the Fod race 2 tester (data not shown [10]), suggesting that the absence of specific amplification was not due to a movement of Fot1 but due to a change in the target sequences of these primers. Thus, we propose that the presence of these isolates (C6-14, C6-15, and C7-02) in the population could form a possible Fod race 2 subgroup. To define subgroups within Fod race 2 an extensive virulence study of isolates would have to be carried out.
Isolates selected from the seven clustered in RAPD groups IV, V, and VI and TEF group IV did not show severity in any of the carnation cultivars tested. These isolates, recovered on different farms from wilted carnations, were characterized as
F. oxysporum by TEF1-𝛼 sequencing. They may be saprophytic
F. oxysporum, possibly associated with the carnation
rhizo-sphere, as found in previous studies [4].
Ten isolates (7.6% of the collection) belonging to F.
pro-liferatum (RAPD group IX and TEF group V) were found to
be nonpathogenic in our phenotypic assay. In a similar study, seven nonpathogenic isolates of F. proliferatum, obtained from carnation crops in Italy, Israel, and the Netherlands were clearly recognized on the basis of their RAPD fingerprint [4]. However, Aloi and Baayen [2] obtained 11 isolates of F.
proliferatum belonging to a distinct vegetative compatibility
groups from Fod, which were associated with the basal rot of carnation. This fungus has also been identified as a pathogen in asparagus [36] and as an opportunistic fungus in wheat [37] and palms [13].
5. Conclusions
In conclusion, population characterization showed that Fod race 2 was widely distributed along the north-west of C´adiz, followed by race 1 or race 8. Molecular techniques, such as TEF1-𝛼 sequencing or RAPD-PCR, allowed (mainly the former) a better identification and clustering of different Fod races than using Fod race-specific primers. Indeed, isolates failing to generate an amplification signal with Fod race-specific primers may indicate the presence of a Fod race 2 subgroup in this area.
Conflict of Interests
The authors declare that there is no conflict of interests regarding the publication of this paper.
Acknowledgments
This research was supported by Grants from the Ministerio de Educaci´on y Ciencia (AGL2005-08137-C03-02), Consejer´ıa de Innovaci´on, Ciencia y Empresa de la Junta de Andaluc´ıa
(P06-AGR-02313), and the Ministerio de Ciencia e Inno-vaci´on (AGL2008-05414-C03-01) of Spain. The authors thank Q. Migheli for critically reading the manuscript and mak-ing valuable suggestions prior to submission and Drs. E.T. Steenkamp and J. M. Melero-Vara for providing F. redolens and reference strains of Fod. The authors also thank M.L. Castillo and S. Castillo for their excellent technical assistance.
References
[1] M. Bogale, B. D. Wingfield, M. J. Wingfield, and E. T. Steen-kamp, “Species-specific primers for Fusarium redolens and a PCR-RFLP technique to distinguish among three clades of Fusarium oxysporum,” FEMS Microbiology Letters, vol. 271, no. 1, pp. 27–32, 2007.
[2] C. Aloi and R. P. Baayen, “Examination of the relationships between vegetative compatibility groups and races in Fusarium oxysporum f. sp. dianthi,” Plant Pathology, vol. 42, no. 6, pp. 839– 850, 1993.
[3] R. P. Baayen, F. van Dreven, M. C. Krijger, and C. Waalwijk, “Genetic diversity in Fusarium oxysporum f. sp. dianthi and Fusarium redolens f. sp. dianthi,” European Journal of Plant Pathology, vol. 103, no. 5, pp. 395–408, 1997.
[4] Q. Migheli, E. Briatore, and A. Garibaldi, “Use of random amp-lified polymorphic DNA (RAPD) to identify races 1, 2, 4 and 8 of Fusarium oxysporum f. sp. dianthi in Italy,” European Journal of Plant Pathology, vol. 104, no. 1, pp. 49–57, 1998.
[5] A. M. Prados-Ligero, M. J. Basallote-Ureba, C. J. L´opez-Herrera, and J. M. Melero-Vara, “Evaluation of susceptibility of carnation cultivars to Fusarium Wilt and determination of Fusarium oxysporum f. sp. dianthi races in Southwest Spain,” HortScience, vol. 42, no. 3, pp. 596–599, 2007.
[6] Anonymous, Anuario de Estad´ıstica Agroalimentaria. Cap. 20:20.7.2.3, Ministerio de Medio Ambiente y Medio Rural y Marino, Madrid, Spain, 2008.
[7] J. A. Navas Becerra, Apuntes sobre el cultivo del clavel. Consejer´ıa de Agricultura y Pesc, Junta de Andaluc´ıa, Sevilla, Spain, 1988. [8] A. Garc´ıa Ruiz, M. de Cara, M. Santos, and J. C. Tello, “Fusarium
wilt of carnation in northwestern coast of C´adiz (Spain),” Bolet´ın de Sanidad Vegetal, vol. 35, pp. 317–328, 2009.
[9] J. L. Andr´es, M. J. Vicente, J. L. Cenis et al., “Genetic and path-ogenic variation of Fusarium oxysporum f. sp. dianthi in Spain,” Bolet´ın de Sanidad Vegetal. Plagas, vol. 27, pp. 249–257, 2001. [10] A. Chiocchetti, I. Bernardo, M. Daboussi et al., “Detection of
Fusarium oxysporum f. sp. dianthi in Carnation tissue by PCR amplification of transposon insertions,” Phytopathology, vol. 89, no. 12, pp. 1169–1175, 1999.
[11] S. Manulis, N. Kogan, M. Reuven, and Y. Ben-Yephet, “Use of the RAPD technique for identification of Fusarium oxysporum f. sp. dianthi from carnation,” Phytopathology, vol. 84, no. 1, pp. 98–101, 1994.
[12] K. O’Donnell, H. C. Kistlerr, E. Cigelnik, and R. C. Ploetz, “Mul-tiple evolutionary origins of the fungus causing panama disease of banana: Concordant evidence from nuclear and mitochon-drial gene genealogies,” Proceedings of the National Academy of Sciences of the United States of America, vol. 95, no. 5, pp. 2044– 2049, 1998.
[13] M. L. Elliott, E. A. Des Jardin, K. O’Donnell, D. M. Geiser, N. A. Harrison, and T. K. Broschat, “Fusarium oxysporum f. sp. pal-marum, a novel forma specialis causing a lethal disease of
syagrus romanzoffiana and Washingtonia robusta in Florida,” Plant Disease, vol. 94, no. 1, pp. 31–38, 2010.
[14] D. Fern´andez-Ortu˜no, E. Loza-Reyes, S. L. Atkins, and B. A. Fraaije, “The CYP51C gene, a reliable marker to resolve inters-pecific phylogenetic relationships within the Fusarium species complex and a novel target for species-specific PCR,” Interna-tional Journal of Food Microbiology, vol. 144, no. 2, pp. 301–309, 2010.
[15] D. M. Geiser, M. D. M. Jim´enez-Gasco, S. Kang et al., “FUSARIUM-ID v. 1.0: a DNA sequence database for identify-ing Fusarium,” European Journal of Plant Pathology, vol. 110, no. 5-6, pp. 473–479, 2004.
[16] N. Shafagh, M. F. Rastegar, and B. Jafarpour, “Physiological race and genetic diversity determination of Fusarium oxysporum f. sp. melonis by differential hosts and molecular marker RAPD in Northern and Razavi Khorasan provinces,” Research Journal of Biological Sciences, vol. 3, pp. 790–793, 2008.
[17] F. M. Alves-Santos, L. Cordeiro-Rodrigues, J. M. Sayagu´es et al., “Pathogenicity and race characterization of Fusarium oxys-porum f. sp. phaseoli isolates from Spain and Greece,” Plant Pathology, vol. 51, no. 5, pp. 605–611, 2002.
[18] A. Garibaldi and M. L. Gullino, “Fusarium wilt of carnation: present situation, problems and perspectives,” Acta Horticul-turae, vol. 216, pp. 45–54, 1987.
[19] O. D. Dhingra and J. B. Sinclair, Basic Plant Pathology Methods, Lewis, Boca Raton, Fla, USA, 2nd edition, 1995.
[20] L. L. Singleton, J. D. Mihail, and C. M. Rush, Methods for Rese-arch on Soil-Borne Phytopathogenic Fungi, American Phytopa-thological Society Press, St Paul, Minn, USA, 1992.
[21] A. Cassago, R. A. Panepucci, A. M. T. Bai˜ao, and F. Henrique-Silva, “Cellophane based mini-prep method for DNA extraction from the filamentous fungus Trichoderma reesei,” BMC Micro-biology, vol. 2, article 1, 2002.
[22] C. Carbonell, D. Cifuentes, J. Tello, and J. L. Ce˜nis, “Differen-tiation of Fusarium oxysporum f. sp. lycopersici and F.o. f. sp. radicis-lycopersici and its detection in plant by RAPD markers,” Bolet´ın de Sanidad Vegetal Plagas, vol. 20, pp. 919–926, 1994. [23] D. J. Vakalounakis and G. A. Fragkiadakis, “Genetic diversity of
Fusarium oxysporum isolates from cucumber: differentiation by pathogenicity, vegetative compatibility, and RAPD fingerprint-ing,” Phytopathology, vol. 89, no. 2, pp. 161–168, 1999.
[24] Z. Q. Zhou and Y. N. Li, “The RAPD evidence for the phylo-genetic relationship of the closely related species of cultivated apple,” Genetic Resources and Crop Evolution, vol. 47, no. 4, pp. 353–357, 2000.
[25] W. Link, C. Dixkens, M. Singh, M. Schwall, and A. E. Melch-inger, “Genetic diversity in European and Mediterranean faba bean germ plasm revealed by RAPD markers,” Theoretical and Applied Genetics, vol. 90, no. 1, pp. 27–32, 1995.
[26] Y. Van De Peer and R. De Wachter, “Treecon for windows: a soft-ware package for the construction and drawing of evolutionary trees for the microsoft windows environment,” Bioinformatics, vol. 10, no. 5, pp. 569–570, 1994.
[27] S. Kumar, J. Dudley, M. Nei, and K. Tamura, “MEGA: a biol-ogist-centric software for evolutionary analysis of DNA and protein sequences,” Briefings in Bioinformatics, vol. 9, no. 4, pp. 299–306, 2008.
[28] M. Kimura, “A simple method for estimating evolutionary rates of base substitutions through comparative studies of nucleotide sequences,” Journal of Molecular Evolution, vol. 16, no. 2, pp. 111– 120, 1980.
[29] V. Bianciotto, C. Bandi, D. Minerdi, M. Sironi, H. V. Tighy, and P. Bonfante, “An obligately endosymbiotic mycorrhizal fungus itself harbors obligately intracellular bacteria,” Applied and Environmental Microbiology, vol. 62, no. 8, pp. 3005–3010, 1996. [30] R. P. Baayen and C. H. van der Plas, “Localization ability, latent period and wilting rate in eleven carnation cultivars with partial resistance to Fusarium wilt,” Euphytica, vol. 59, no. 2-3, pp. 165– 174, 1992.
[31] V. Cebolla, C. Monton, P. Carrasco, and A. Rodr´ıguez, La imp-ortancia de las razas I y II de Fusarium oxysporum fsp. dianthi en los suelos espa˜noles, Jornadas sobre Patolog´ıa Vegetal. Mono-graf´ıa INIA 48, Ministerio de Agricultura, Pesca y Alimentaci´on (ed.), Madrid, Spain, 1983.
[32] G. Lori, V. Edel-Hermann, N. Gautheron, and C. Alabouvette, “Genetic diversity of pathogenic and nonpathogenic popula-tions of Fusarium oxysporum isolated from carnation fields in Argentina,” Phytopathology, vol. 94, no. 6, pp. 661–668, 2004. [33] B. Lievens, M. Rep, and B. P. H. J. Thomma, “Recent
develop-ments in the molecular discrimination of formae speciales of Fusarium oxysporum,” Pest Management Science, vol. 64, no. 8, pp. 781–788, 2008.
[34] M. J. Daboussi, J. Davi`ere, S. Graziani, and T. Langin, “Evolution of the Fot1 transposons in the genus Fusarium: discontinuous distribution and epigenetic inactivation,” Molecular Biology and Evolution, vol. 19, no. 4, pp. 510–520, 2002.
[35] Y. Ben-Yephet and D. Shtienberg, “Effects of the host, the path-ogen, the environment and their interactions, on fusarium wilt in carnation,” Phytoparasitica, vol. 25, no. 3, pp. 207–216, 1997. [36] E. Yergeau, M. Filion, V. Vujanovic, and M. St-Arnaud, “A
PCR-denaturing gradient gel electrophoresis approach to assess Fus-arium diversity in asparagus,” Journal of Microbiological Meth-ods, vol. 60, no. 2, pp. 143–154, 2005.
[37] S.-I. Kwon, C. D. Von Dohlen, and A. J. Anderson, “Gene seq-uence analysis of an opportunistic wheat pathogen, an isolate of Fusarium proliferatum,” Canadian Journal of Botany, vol. 79, no. 9, pp. 1115–1121, 2001.
Submit your manuscripts at
http://www.hindawi.com
Hindawi Publishing Corporation
http://www.hindawi.com Volume 2014
Anatomy
Research International
Peptides
Hindawi Publishing Corporation
http://www.hindawi.com Volume 2014
Hindawi Publishing Corporation http://www.hindawi.com
International Journal of
Volume 2014
Zoology
Hindawi Publishing Corporation
http://www.hindawi.com Volume 2014 Molecular Biology International
Hindawi Publishing Corporation
http://www.hindawi.com Volume 2014
The Scientific
World Journal
Hindawi Publishing Corporation
http://www.hindawi.com Volume 2014
Hindawi Publishing Corporation
http://www.hindawi.com Volume 2014
Bioinformatics
Advances inMarine Biology
Journal ofHindawi Publishing Corporation
http://www.hindawi.com Volume 2014
Hindawi Publishing Corporation
http://www.hindawi.com Volume 2014
Signal Transduction
Journal ofHindawi Publishing Corporation
http://www.hindawi.com Volume 2014
BioMed
Research International
Evolutionary Biology International Journal of
Hindawi Publishing Corporation
http://www.hindawi.com Volume 2014
Hindawi Publishing Corporation
http://www.hindawi.com Volume 2014 Biochemistry Research International
Archaea
Hindawi Publishing Corporation
http://www.hindawi.com Volume 2014
Hindawi Publishing Corporation
http://www.hindawi.com Volume 2014 Genetics
Research International
Hindawi Publishing Corporation
http://www.hindawi.com Volume 2014 Advances in
Virology
Hindawi Publishing Corporation http://www.hindawi.com
Nucleic Acids
Journal ofVolume 2014
Stem Cells
International
Hindawi Publishing Corporation
http://www.hindawi.com Volume 2014
Hindawi Publishing Corporation
http://www.hindawi.com Volume 2014
Enzyme
Research
Hindawi Publishing Corporation
http://www.hindawi.com Volume 2014
International Journal of