Landslides and Engineered Slopes. Experience, Theory and Practice – Aversa et al. (Eds) © 2016 Associazione Geotecnica Italiana, Rome, Italy, ISBN 978-1-138-02988-0
The influence of slope instability processes in demographic
dynamics of landslide-prone rural areas
L. Pisano
CNR-IRPI, Bari, Italy
Department of Biosciences and Territory, University of Molise, Pesche, Italy
V. Dragone
CNR-IRPI, Bari, Italy
C. Vennari
CNR-IRPI, Bari, Italy
Department of Earth, Environmental and Resources Science, University of Naples Federico II, Napoli, Italy
G. Vessia
CNR-IRPI, Bari, Italy
Department of Engineering and Geology, University of Chieti-Pescara, Chieti Scalo, Italy
M. Parise
CNR-IRPI, Bari, Italy
ABSTRACT: To assess the relationships existing between landslide evolution and economical development of a rural, highly prone to landslides, area in southern Italy, a demographic analysis covering the time span from 1861 to 2011 has been performed on about 30 municipalities. The work consisted in a detailed descrip-tion of the demographic features of the studied area, aimed at analysing the growing/decreasing trend in the local populations, as a function of the main historical and hydrological events. The combined analysis of the above elements with data about landslide distribution and their temporal occurrence allowed to evaluate the influence played by slope instability processes in this sector of Apulia region.
the mountainous and hilly sectors, where a large variety of landslides is triggered, causing landscape change and rising issues of social concern. In fact, many rural communities located in geological and geomorphological complex areas, strongly affected by landslide occurrence, appear to be severely hit by development of slope movements, which results in significant parts of the population moving away, with particular regard to young people.
This is the case of the Daunia Apennines, located in the north-western sector of Apulia Region (southern Italy), where several small rural villages are located in highly landslide-prone areas. They are continuously hit by reactivations of slope movements during seasonal rainfalls, with earthquakes as a further possible trigger. Changes in land use have also to be invoked as a further cause of landslide onset (Parise & Wasowski, 2000; Lamanna et al., 2009).
In this study some considerations on the link between slope movements occurrence and demo-graphic problems deriving from de-population are illustrated. They focus in particular on the relation-1 INTRODUCTION
Landslide is one of the most significant natural hazards affecting society and its activities (Crozier, 1986; Guzzetti, 2000). In many countries worldwide, slope movements are the main causes of economic losses and casualties (Schuster & Fleming, 1986).
Landslides are caused by numerous and complex natural processes (e.g. heavy rainfall, earthquake, snow melting), to which others have to be added due to human activities, such as slope excavation, infrastructures construction, changes in land use, deforestation, etc. Their occurrence and frequency in a specific area depend on the interaction of the above processes (Malamud et al., 2004; Guzzetti et al., 2012; Peruccacci et al., 2012).
With respect to the Italian territory, landslides caused at least 1297 deaths, 15 people dispersed and 1731 injured from 1964 to 2013 (Salvati et al., 2010). In addition, in 2014 other 13 people died, 25 were injured and 3368 lost their houses (web source: http://polaris.irpi.cnr.it/). The casualties are distrib-uted throughout the Italian territory, especially along
ship between the decreasing in population size and the occurrence of landslides caused by rainfall. 2 THe STUDY AReA
The Daunia Apennines include the 29 municipali-ties shown in Figure 1. This area is bordered by the Fortore River to the north and the Calaggio stream to the south, ranging in altitudes between 50 and 1,152 m a.s.l.
The geological system of Daunia is characterized by the Daunia and Fortore units (Dazzaro & Rap-isardi, 1996; Patacca & Scandone, 2007), both con-sisting of flyschioid formations with different degree of tectonization and lithological composition, show-ing in general a high content in clay. These geological units have been affected by an intense and prolonged compressional activity with Adriatic vergence, chronologically occurred during the Tortonian, and continued until the lower Pleistocene (Doglioni et al., 1994; Menardi Noguera & Rea, 2000).
As a consequence of the tectonic stresses expe-rienced by the rock masses, the Daunia Apennines, being characterized mainly by hilly and mountain areas, with predominantly clay deposits, are intensely
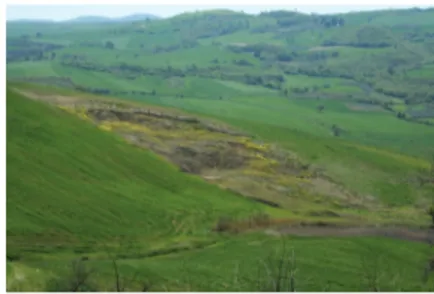
affected by land instability. The main slope move-ments are complex (sensu Cruden & Varnes, 1996), starting typically as planar or rotational landslides, and often evolving as earthflows or debris flows (Parise, 2000, 2003; Cotecchia et al., 2006; Pellicani et al., 2014). Soil slips, typically involving the first 1–2 m of terrain, are extremely common, especially after heavy rainstorms (Figure 2).
In many cases the slope movements affect directly the built-up areas (typically located at the top of the hills, and bounded by landslides on many sides), or the main communication routes (generally developing along the watersheds, or at middle-slopes) (Zezza et al., 1994; Chiocchio et al., 1997; Parise et al., 2012). This latter situation is at the origin of frequent problems for movement of people and freights, with high rehabilitation costs for maintaining the road network in function (Ven-nari et al., 2013).
For the above reasons, namely the difficulties in living and working in an area severely hit by landslides, the Daunia sector shows a high rate of population decrease along the last 60 years (Drag-one and Parise, 2014). This has also to be related to medium and long term socio-economical changes, but is likely fostered by the damages to roads and train by slope movements characterized by sea-sonal reactivations.
3 PReSeNTATION AND DISCUSSION 3.1 Environmental data
The importance of historical research in the cor-rect assessment of geological hazards is nowadays recognized as one of the first actions to be per-formed (Soeters & van Westen, 1996; Calcaterra & Parise, 2001; Glade, 2001; Glade et al., 2001), aimed at reaching the highest possible level of knowledge on the specific processes dealt with, in this case landslides.
The datasets used hereafter are mainly drawn from the archives of the AVI project (Vulnerable Figure 1. Location map, with indication of the Daunia
municipalities: Accadia (Ac), Alberona (Al), Anzano di Puglia (AP), Biccari (Bi), Bovino (Bo), Candela (Can), Carlantino (Car), Casalnuovo Monterotaro (CM), Casalvecchio di Puglia (CP), Castelluccio Valmaggiore (CV), Castelnuovo della Daunia (CND), Celenza Valfor-tore (CeV), Celle di San Vito (CSV), Deliceto (De), Faeto (Fa), Lucera (Lu), Monteleone di Puglia (MP), Motta Montecorvino (MM), Orsara di Puglia (OP), Panni (Pa), Pietramontecorvino (Pi), Rocchetta Sant’Antonio (RSA), Roseto Valfortore (RV), San Marco la Catola (SMC), Sant’Agata di Puglia (SAP), Torremaggiore (To), Troia (Tr), Volturara Appula (VA), Volturino (Vo).
Figure 2. A typical example of slope movement (shal-low soil slip) in the Daunia slopes.
Areas in Italy by landslides and floods; Guzzetti et al., 1994) and the inventory of landslide events collected by CNR-IRPI group with the purpose of reconstructing sub-regional empirical rainfall thresholds in the Daunia Apennines (Vennari et al., 2013; Brunetti et al., 2015; Pisano et al., 2015).
The information collected and used in this work cover a time span from 1950 to 2010. Two-hundred-eighty-three landslides and floods events mainly triggered by exceptional meteorological events were documented in Daunia.
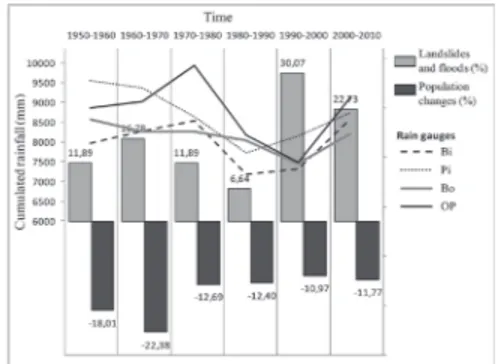
In order to establish a connection between the rainfall and the landslide events, the cumulative rainfalls in the last decades have been calculated, using the data coming from the rain gauges indi-cated in figure 3. These rain gauges were selected on the basis of their locations and of the com-pleteness of the rainfall series as well. The data are extracted from the hydrological records published annually by the Regional Center of the Apulia Civil Protection: http://www.protezionecivile.puglia.it/.
The landslide and flood frequency is in good agreement with the rainfall amount (Fig. 3): it increases and decreases as the rainfall regime, except than during the 1990–2000 decade. In this period, a reduction in rainfall corresponds to the highest landslide frequency. This apparent incongruence could be interpreted, in addition to changes in the main character of rainfall events, as a possible clue of human responsibility in landslide onset. In this same period, the population reduction (black bars in Figure 3) does not follow the peak observed in landslide and flood events. This result can be due to the time-shift of landslide effects on population reduction: if damages and road disruptions are not recovered in due time, they can generate indi-rect socio-economical effects in the long run, forc-ing people to move away in order to look for sites where to live and work, less exposed to hazard.
Moreover, it can be noted that a lower general rain-fall height in a decade could derive from a lower number of rainfall events, that, at the same time, may show extreme values of rainfall, being associ-ated to intense rainstorms, thus possibly causing larger damages and higher economical losses.
Aimed at analyzing at a greater detail the popu-lation structure in Daunia, and its repopu-lationship with hydro-geological instability phenomena, we applied to this area the demographic malaise indi-cator (see section 3.2). This indiindi-cator enables to shed light on the structure of the population and its temporal dynamics. This latter, in turn, affects the variations in the social-economic conditions throughout the considered urban centers.
3.2 Demographic malaise state (SMD indicator) In order to adequately represent the dynamics of the population, the Demographic Malaise State indicator (SMD) proposed by Bottazzi et al. (2006, 2012) is herein considered. It is defined by the following equation:
SMD = svnp1 + ism (1)
The indicator is the sum of two parameters: svnp1 represents the weighted episodes of depopulation whilst ism is the amount (in terms of severity) of inhabitant loss. These episodes have been estimated for 6 censorial intervals considered within the two reference periods of 60 years that are compared in this study: from 1901 to 1961, and from 1951 to 2011. each episode contributes to the final value of svnp1by an increasing weight (pi): from 1 to 6.
The highest (6) is given to the most recent episode (the nearest to 1961 and 2011) and the lowest (1) to the most ancient one. In addition, for each cen-sual episode the value 1 is assigned if a population decrease has occurred; otherwise 0 is multiplied by the weight of the considered episode.
The first term of eq. (1) is:
svnp I pi cgi cg i i 1 1 2 1 6 = ⋅ + + =
∑
( , ,) (2)where pi are the weights of the 6 censorial
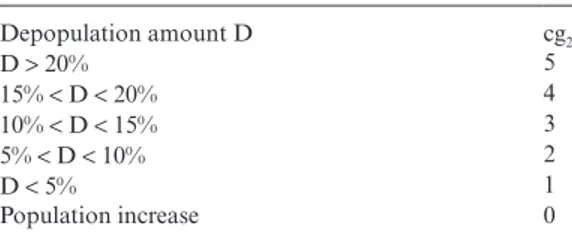
inter-vals I, and cg1 and cg2 are coefficients that attribute
the relevance index to the depopulation occurrence within each censorial interval. The magnitudes of these coefficients are reported in Tables 1 and 2.
The second term in eq. (1) is calculated as the arithmetic mean of six parameters used to estimate the growth or the reduction of population in the first term of the same eq. (1). These six indexes are listed in Table 3 and they refer to the period span 2001–2011.
Figure 3. Graph relating the number of landslides and floods with the population changes per decade in the time span 1950-2010. The lines indicate the cumulate rainfall of the main rain gauges in the study area (labels as in Fig. 1).
These six parameters depict the population struc-ture and its sustainable development. As a matter of fact, although if related to demographic aspects they can also be considered as the bases of the social-economic health of the investigated community. A thorough description of how to calculate the inter-mediate parameters that contribute to SMD indica-tor can be found in Bottazzi et al. (2006, 2012).
As for the Daunia case study, the calculated SMD values are reported in figure 4 divided into five ranges of population health: highly serious, serious, uncertain, moderate and good.
3.3 Demographic data
To highlight the socio-economical evolution of the Daunia territory along the past 50 years, the resi-dent population index was used. The values were extracted from the national census of the popula-tion made by the Napopula-tional Institute of Statistics (ISTAT) starting from 1861 up to 2011 (ISTAT, 1963, 1965, 2012).
The demographic variation was firstly analyzed by means of a simple indicator of the percentage in population change: it consists in the percentage ratio between the net variation (increasing or decreasing) of the resident population in a fixed time interval and the number of the resident population at the beginning of this period. This index suggests that the population in the Daunia Apennine reduced 51% in the second half of the last century, at a rate higher than 1% per year. In 1951 the population in Daunia exceeded 41% of that located in Foggia (the main town in the area, counting at that time 97.386 inhabitants), but in 1981 it was only half than that in Foggia (Dragone & Parise, 2014).
Figure 4 shows the spatial distribution of the SMD indicator in Daunia, calculated in two time intervals: 1901–1961 and 1951–2011. It is clear that after 1962 in the study area the population deple-tion ranges from serious to very serious. To pro-vide with some examples, Table 4 reports examples of the values of the SMD indicator, calculated for the two considered time spans for 9 out of the 29 municipalities under study.
For a certain extent such a process can be related to a possible increase in landslides, although further indicators should be considered to definitely state a cause-effect relationship.
Finally, a recent study performed by Ferrara et al. (2015) suggests a novel perspective in the cause-effect chain established between depopulation and hydrogeological instability: causes and effects play in a circular way with social-environmental factors generating a spiral. Thus, although the rural society economical depletion can be induced by frequent soil failure causing temporal isolation of the com-munity, it is also true that the abandonment of these territories might contribute to worsen their stability and drastically reducing their economical values.
In fact, the progressive depopulation in Daunia heavily affects the social-economic development of the territory. Since 1961 depopulation is high-lighted in two main features of the population Table 1. Values of cg1 coefficients weighting
depopula-tion episodes. Depopulation amount D cg1 D > 60% 5 45% < D < 60% 4 30% < D < 45% 3 15% < D < 30% 2 D < 5% 1 Population increase 0
Table 2. Values of cg2 coefficients weighting
depopula-tion episodes. Depopulation amount D cg2 D > 20% 5 15% < D < 20% 4 10% < D < 15% 3 5% < D < 10% 2 D < 5% 1 Population increase 0
Table 3. Six indexes of depopulation used to calculate the SMD (after Bottazzi et al. 2006).
Variation of population between 2001 and 2011 (%) VP P P P = 2011− 2001⋅ 2001 100
Birth (N) over deaths (M) exceedance index referred to the period 2001–2011 (%)
ESN N M N M = −
+ ⋅100 Aging index: ratio between
number of people older than 65 years and 100 inhabitants ranging between 0–14 years recorded up to 2001. IV P P = − Ω − ⋅ 65 0 14 100
elderly over children index: ratio between the number of people older than 65 years and children younger than 5 years, recorded up to 2001. AB P P = − Ω − 65 0 4
Dependency index: ratio between the sum of people younger than 15 years and older than 65, and people in the range 15–65 years. ID P P P = − + − ⋅ − 0 14 65 15 64 100 Ω Depopulation episodes in intercensorial times (2001–2011) SSI
structure: the prevalence of elderly people, and the decrease in population of the smaller centers.
These characters are related to the emigration of the active portion of people towards larger urban centers, with greater possibilities to find a job. This trend could be considered similar to other depopu-lation phenomena, if we ignore the “rural” nature of this community. Further analyses of economic indexes must be performed to point out the role of the hydrogeological instability in the depopula-tion trend associated to a general impoverishment of the community. Frequent interruption of lines service cannot be attractive for new investment in economic activities as tourism, farming, trans-formation industries etc. Thus, new demographic policies should be associated with an improved capacity of maintenance of these territories in order to start a new social-economic trend: the repopulation of this territory should contribute at establishing a rural economy that should be inte-grated with the safeguard of the cultivated land, aimed at producing a better quality of life.
4 CONCLUSIONS
This study is a contribution to improve the knowl-edge of the demographic effects of landslide occur-rence in rural territories as the Daunia Apennines, in southern Italy. In this area the demographic structure is strictly related to the economic health and well-being, which are in turn affected by hydro-geological instability. The preliminary results drawn from the calculation of the SMD indicator enable to relate the progressive reduction of population to the increase of landslide events, as recorded in the decade 1990–2000. These events cannot be fully explained by the rainfall regime, due to the reduc-tion in cumulated rainfall of this period. Further investigations are needed to understand whether the observed peak in landslides might be related, on the other hand, to the increase in number of extreme pluviometric events, with the rainfall con-centrated in less, but intense, rainstorms.
ReFeReNCeS
Bottazzi, G., Puggioni, G. & Zedda, M. 2006. Dinamiche e tendenze dello spopolamento in Sardegna. Focus sulle aree LEADER. Regione Autonoma della Sardegna, Centro Regionale di Programmazione, Cagliari. Bottazzi, G. & Puggioni, G. 2012. Lo spopolamento in
Sardegna come tendenza di lungo periodo. Dinam-iche demografDinam-iche in Sardegna tra passato e futuro, pp. 73–96.
Brunetti, M.T., Peruccacci, S., Antronico, L., Deganutti, A.M., Gariano, S.L., Iovine, G., Luciani S., Luino F., Melillo M., Palladino M.R., Parise M., Rossi M., Tur-coni L., Vennari C., Vessia G., Viero A., & Guzzetti F. 2015. Catalogue of Rainfall events with Shallow Landslides and New Rainfall Thresholds in Italy. In: G. Lollino, D. Giordan, G.B. Crosta, J. Corominas, R. Azzam, J. Wasowski, & N. Sciarra (eds.), Engineer-ing Geology for Society and Territory, 2, 1575–1579. Springer International Publishing. DOI:10.1007/978-3-319-09057-3_280.
Figure 4. SMD changes in the Daunia municipalities occurred between 1961 and 2011. Table 4. Values of the SMD indicator calculated at 9
municipalities for two time periods: before 1961 and up to 2011. The colors are as in Figure 4.
Calcaterra, D. & Parise, M. 2001. The contribution of historical information in the assessment of the land-slide hazard. In T. Glade, P. Albini & F. Frances (eds.), The use of historical data in natural hazard assessment: 201–217. Adv. in Nat. and Techn. Hazards Res. 17 Kluwer Acad. Publ.
Chiocchio, C., Iovine, G. & Parise M., 1997. A proposal for surveying and classifying landslide damage to buildings in urban areas. Proceedings International Symposium on “engineering geology and the environment”, Ath-ens, 1, 553–558.
Cotecchia, F., Vitone, C., Cafaro, F. & Santaloia, F. 2006. The mechanical behaviour of intensely fissured high plasticity clays from Daunia. Proc. 2nd Int. Workshop on Characterization Engng. Properties Natural Soils, Singapore, 3, 1975–2003.
Crozier, M.J. 1986. Landslides: Causes Consequences and environment. Croom Helm, London. 252 pp. Cruden, D.M. & Varnes, D.J. 1996. Landslide types and
processes. In A.K. Turner & R.L. Schuster (eds.), Land-slides: Investigation and Mitigation: 36–75. Transp. Res. Board Sp. Rep. 247, Nat. Acad. Press, WA.
Dazzaro L. & Rapisardi L. 1996. Schema geologico del margine appenninico tra il F. Fortore e il F. Ofanto. Mem. Soc. Geologica Italiana 51 (1): 143–147. Doglioni, C., Mongelli, F. & Pieri, P. 1994. The Puglia
uplift (Se-Italy): an anomaly in the foreland of the Apenninic subduction due to buckling of a thick con-tinental lithosphere. Tectonics 13 (5): 1309–1321. Dragone V. & Parise M. 2014. Analisi socio-demografica
del Sub-Appennino Dauno (provincia di Foggia). CNR-IRPI, Bari, Internal Report, 20 pp.
Ferrara C., Barone P.M. & Salvati L. 2015. Unravelling landslide risk: soil susceptibility, agro-forest systems and the socio-economic profile of rural communities in Italy. Soil Use and Management 31 (2): 290–298. Glade, T. 2001. Landslide hazard assessment and
histori-cal landslide data an inseparable couple? In T. Glade, P. Albini & F. Frances (eds.), The use of historical data in natural hazards assessment (advances in natural and technological hazard research): 153–168. Kluwer Acad. Publ., Dordrecht, The Netherlands.
Glade, T., Albini, P. & Frances, F. (eds) 2001. The use of historical data in natural hazard assessment. Adv. in Nat. and Techn. Hazards Res. 17 Kluwer Acad. Publ. Guzzetti, F. 2000. Landslide fatalities and the evaluation of
landslide risk in Italy. Engineering Geology 58: 89–107. Guzzetti, F., Cardinali, M. & Reichenbach, P. 1994. The
AVI Project: a bibliographical and archive inventory of landslides and floods in Italy. Environmental Man-agement 18(4): 623–633.
Guzzetti, F., Mondini, A.C., Cardinali, M., Fiorucci, F., Santangelo, M. & Chang, K.T. 2012. Landslide inven-tory maps: New tools for an old problem. Earth-Sci-ence Reviews, 112 (1–2): 42–66.
ISTAT, 1963. 10° Censimento generale della popolazi-one, 15 ottobre 1961. Dati riassuntivi comunali sulla popolazione e sulle abitazioni. National Institute of Statistics, Rome, 1.
ISTAT, 1965. 10° Censimento generale della popolazione, 15 ottobre 1961. Dati sommari per comune, fascicolo 71 provincia di Foggia. National Institute of Statistics, Rome, 3.
ISTAT, 2012. 15° Censimento generale della popolazione e delle abitazioni, 9 ottobre 2011. Struttura
demogra-fica della popolazione. Dati definitivi. National Insti-tute of Statistics, Rome.
Lamanna, C., Casarano, D. & Wasowski, J. 2009. Cam-biamenti dell’uso del suolo e aumenti dell’attività franosa nel territorio di Rocchetta Sant’Antonio (Appennino Dauno). Il Quaternario 22 (2): 139–156. Malamud, B.D., Turcotte, D.L., Guzzetti, F. &
Reichen-bach, P. 2004. Landslide inventories and their statisti-cal properties. Earth Surface Processes and Landforms 29 (6): 687–711.
Menardi Noguera, A. & Rea, G. 2000. Deep structure of the Campanian-Lucanian Arc (Southern Apennine, Italy). Tectonophysics 324: 239–265.
Parise, M. 2000. Risultati preliminari di ricerche sulla fra-nosità storica dell’Appennino Dauno. CNR-CERIST, Bari, Internal Report no. 64, April 2000, 30 pp. Parise, M. 2003. Considerazioni sulla franosità
dell’Appennino Dauno (Puglia) sulla base dell’elaborazione di carte di attività delle frane. Quad. Geol. Applicata 10 (2): 133–145.
Parise, M. & Wasowski, J. 2000. Fenomeni di dissesto nell’Appennino Dauno, ed implicazioni per il patrimonio archeologico e storico-naturale. Proc. Geo-Ben, Torino. Parise M., Federico A. & Palladino G., 2012, Historical
evolution of multi-source mudslides. In: eberhardt e., Froese C., Turner A.K. & Lerouil S. (eds.), Landslides and engineered Slopes. Protecting Society through Improved Understanding. Proceedings 11th Int. Symp. Landslides, Banff (Canada), 3–8 June 2012, vol. 1, p. 401–407.
Patacca, e. & Scandone, P. 2007. Geology of the Southern Apennines. Boll. Soc. Geol. It., Spec. Issue 7: 75–119 Pellicani, R., van Westen, C.J. & Spilotro, G., 2014.
Assessing landslide exposure in areas with limited landslide information. Landslides 11 (3): 463–480. Peruccacci, S., Brunetti, M.T., Luciani, S., Vennari, C. &
Guzzetti, F. 2012. Lithological and seasonal control on rainfall thresholds for the possible initiation of land-slides in Central Italy. Geomorphology 139–140: 79–90. Pisano, L., Vennari, C., Vessia, G., Trabace, M., Amoruso,
G., Loiacono, P. & Parise, M. 2015. Data collection for reconstructing empirical rainfall thresholds for shal-low landslides: challenges and improvements in the Daunia Sub-Apennine (Southern Italy). Rendiconti Online Società Geologica Italiana 35: 236–239. Salvati, P., Bianchi, C., Rossi, M., & Guzzetti, F. 2010.
Societal landslide and flood risk in Italy, Natural Haz-ards earth System Sciences 10: 465–483.
Schuster R.L. & Fleming R.W. 1986. economic losses and fatalities due to landslides. Bull. Int. Ass. Eng. Geol. 23 (1): 11–28.
Soeters, R. & van Westen, C.J. 1996. Slope instability recognition, analysis, and zonation. In A.K. Turner & R.L. Schuster (eds.), Landslides: Investigation and Mitigation: 129–177. Transp. Res. Board sp. rep. 247, Nat. Ac. Press, WA.
Vennari, C., Vessia, G., Parise, M., Rossi, M., Loiacono, P., Amoruso, G., Trabace, M. & Giandonato, P. 2013. Slope movements in Daunia (Apulia): collecting historical events for the definition of rainfall thresholds. Rendiconti Online Società Geologica Italiana 24: 322–324. Zezza, F., Merenda, L., Bruno, G., Crescenzi, e. &
Iovine, G. 1994. Condizioni di rischio da frana nei comuni dell’Appennino Dauno. Geol. Appl. Idrogeol. 29: 77–141.