Abstract
The qualitative assessment of animal behaviour (QBA) is an inte-grative, whole-animal methodology based on the qualitative interpre-tation of the dynamic style in which animals interact with their envi-ronment. In other words, it describes not what the animals do, but how they do what they do. We aimed to verify whether the QBA was able to detect the behavioural fluctuations occurring in animals in response to an environmental challenge. An 8-member panel was used. The panel was briefly trained on the temporal dominance of sensations (TDS) procedure and subsequently asked to observe the behaviour of 4 buffalo heifers in 4 videos lasting 2 min each and score the behav-ioural expression of the animals following the TDS procedure. TDS consists in presenting to the panellist the list of behavioural descrip-tors on a computer screen along with each video. Each video was obtained by assembling two clips concerning the same animal in two different conditions: home indoor pen (1 min) and novel outdoor pad-dock (1 min). Two videos started with the animal in the outdoor envi-ronment and two others in the opposite order. Six behavioural descrip-tors were chosen from a previous work conducted on the same ani-mals: calm, active, curious, nervous, shy and apathetic. Each assessor was asked to select the dominant descriptor, which was considered as
dominant when it gained most of the attention of the observer. Each time the observer felt the behaviour changed, he/she scored the new dominant descriptor until the behaviour ended. Each video was observed 4 times by each observer (4 replications) in a randomised order at 24-h intervals. For each point of time, the proportion of runs (subject × replication) for which a given descriptor was assessed as dominant (dominance rate >30%) was computed. Results showed a satisfactory agreement among observers and replications. The observers clearly discriminated the first from the second half of each video. Calm and apathetic were dominant indoors, nervous and active were dominant outdoors, whereas curious was used in both condi-tions. In addition, the combination QBA-TDS showed how the behav-iour changed in time (e.g. habituation to the novel environment) in outdoor conditions (the dominance of nervous and active at the start switched to calm at the end in 3 out of 4 videos), whereas indoors the animals showed reduced behavioural variations, possibly because they were habituated to those conditions, thus they did not change their way to interact with the environment.
Introduction
The evaluation of animal welfare needs the development of new tools for the collection of additional information to be used for a more accurate interpretation of the quantitative data gathered through the observation of the behaviour of the animals or the clinical signs of dis-ease. A valid system used to approach this issue is the qualitative behaviour assessment (QBA), as described by Wemelsfelder et al. (2001). This method has been previously applied to a number of differ-ent animal species including pigs (Wemelsfelder et al., 2001, 2009) cows (Rousing and Wemelsfelder, 2006), horses (Minero et al., 2009; Napolitano et al., 2008) and buffaloes (Napolitano et al., 2012) and rely on the use of emotional descriptors (calm, curious, shy, etc.) to define the way the animals interact with the environment. These studies were based on the use of the free choice profiling technique (FCP). FCP allows the observers to describe the behaviour using a sponta-neously generated list of descriptors so as preserving the integrity of their own opinion about the animals’ behaviour. In addition, FCP if paired with generalised procrustes analysis allows the evaluation of the agreement among observers in terms of interpretation of the observed behaviour. All these studies showed high levels of inter-observer reliability.
However, following this technique observers perform a post hoc evaluation (i.e. they score the descriptors of animal behaviour after that the animals have been observed). Therefore, an overall evaluation of the behaviour observed in a certain period of time is performed, whereas the fluctuations possibly occurring during that observation are not captured.
Temporal dominance of sensations (TDS) is a sensory analysis methodology recently developed to describe the variations of the pre-vailing sensory attributes while food is tested (Pineau et al., 2009). Correspondence: Maria Serrapica, School of Agricultural, Forest, Food and
Environmental Sciences, University of Basilicata, via dell'Ateneo Lucano 10, 85100 Potenza, Italy.
Tel.: +39.0971205078 - Fax: +39.0971205378. E-mail: [email protected]
Key words: animal behaviour, buffaloes, qualitative behaviour assessment, temporal dominance of sensations.
Acknowledgements: thanks are due to Francoise Wemelsfelder for com-ments on the early draft of the manuscript.
Conference presentation: Meeting on Environmental Sustainability and
Food Security, Potenza, Italy, 2014.
Received for publication: 8 July 2014. Revision received: 14 October 2014. Accepted for publication: 18 October 2014.
©Copyright M. Serrapica et al., 2014 Licensee PAGEPress, Italy
Italian Journal of Agronomy 2014; 9:612 doi:10.4081/ija.2014.612
This article is distributed under the terms of the Creative Commons Attribution Noncommercial License (by-nc 3.0) which permits any noncom-mercial use, distribution, and reproduction in any medium, provided the orig-inal author(s) and source are credited.
Qualitative assessment of temporal fluctuations on buffalo behaviour
Maria Serrapica,
1Ada Braghieri,
1Amelia Maria Riviezzi,
1Andrea Bragaglio,
1Angela Carlucci,
2Fabio Napolitano
11
School of Agricultural, Forest, Food and Environmental Sciences, University of Basilicata,
Potenza;
2Smell and Taste Association, Potenza, Italy
Non
commercial
use
TDS is based on the use of a fixed list of terms, which means that a selected group of panellists has to agree on the meaning of these terms beforehand. Previous experiments described how the sensory domi-nant sensations of different foods and beverages such as fish sticks (Albert et al., 2012), olive oil (Dinnella et al., 2012), dairy products (Pineau et al., 2009), etc. evolved in time.
In this study we paired the qualitative approach to the study of ani-mal behaviour with the TDS methodology in order to verify whether QBA was able to detect the variations of animal behaviour during the observation period. The specific question we aimed to answer was about whether the observers could perceive temporal fluctuations of animal behaviour, thus allowing novel applications of QBA.
Materials and methods
We used eight Mediterranean buffalo heifers aged 16-18 months (see Napolitano et al., 2012 for a comprehensive description of housing conditions). Animals were subjected to two different isolation tests. In the first one individual buffaloes were isolated from the group in the indoor home pen, in the second one buffaloes were individually taken to an outdoor paddock (5.0×4.6 m, with earth floor and open metal fencing) unknown to the animals and located 20 m away from the home pen. During tests animals were isolated from tactile and visual contact with other animals, including humans, but could receive auditory and olfactory stimuli from conspecifics. All procedures were performed by a stockperson who was well known to the animals.
In each testing condition each animal was confined individually for 150 s, and its behaviour video-recorded using a DVL-157 JVC video cam-era equipped with a wide-angle lens, located at a corner of the test area at a distance from the fence of 6 m and operated by remote control. From this material 4 videos (4 animals in two conditions: indoors and out-doors) of 120-s-duration respectively were prepared. Thus the total dura-tion of the video recording presented to observers was about 8 min.
Qualitative behaviour assessment
An 8-member panel with a varied cultural background and experi-ence in animal behaviour and sensory analysis was used. The panel observed the behaviour of 4 buffalo heifers in 4 videos lasting 2 min each, according to the TDS procedure (Pineau et al., 2009). Each video was obtained by assembling two clips portraying the same animal in two different conditions: home indoor pen (1 min) and novel outdoor paddock (1 min). Two videos started with the animal in the outdoor environment (heifers no. 1 and 2, corresponding to Figures 1 and 2) and two others were assembled the other way around (heifers no. 3 and 4, corresponding to Figures 3 and 4). Footages had been previously recorded and used for QBA purposes in a previous work (Napolitano et al., 2012). Six behavioural descriptors were chosen according to the frequency of elicitation performed by three panels in the same work.
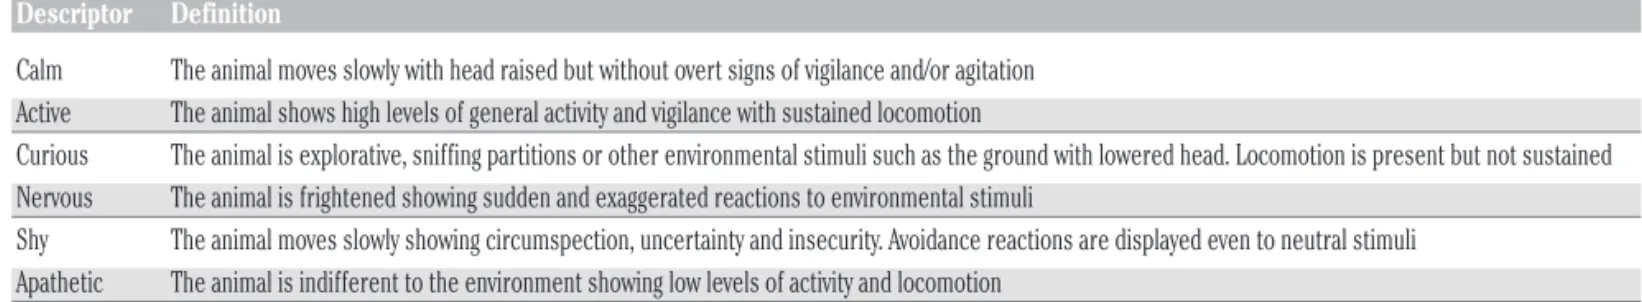
They were: calm, active, curious, nervous, shy and apathetic. The defi-nitions of behavioural descriptors are reported in Table 1. Such defini-tions were used for assessor training and were available during the observations.
Panellists were trained in three preliminary sessions of 30 min each. The first one was used to teach panellists how to use the TDS comput-erised data acquisition system. The second session was used to train the observers on QBA and to memorise each behavioural descriptor based on a behavioural definition reported in a descriptive list with the corresponding descriptor (learning phase). During the last sessions the assessors, with the help of the descriptor list and definitions (Table 1) evaluated the video and were asked to indicate the dominant behav-ioural descriptor.
The observers assessed the videos according to the TDS procedure (Pineau et al., 2009), which consists in presenting to the panellist the entire list of behavioural descriptors on a computer screen along with each video. Briefly, each assessor is asked to select the dominant descriptor and to score its intensity level on an unstructured scale of 100 mm length (0 mm: descriptor absent, 100 mm: descriptor could not be stronger). A behavioural descriptor was considered dominant when it was able to gain most of the attention of the observer (i.e. the most striking impression at a given time). Subsequently, each time the observer feels the behaviour has changed, either in intensity or in quality, he/she scores the new dominant descriptor (or the new descrip-tor level), until the video ends. During the observation of each video the panellists are free to choose a descriptor several times, whereas other descriptors can be completely ignored. Therefore, for each video we were able to obtain the following information: when a descriptor became dominant, the duration of its dominance, its intensity level.
Each video was observed 4 times by each observer (4 replications) in a randomised order at 24-h intervals in 4 sessions of about 8 min each. The order of the descriptors was also randomised across assessors although it did not change within assessors. We performed 4 replica-tions in order to achieve more then 30 evaluareplica-tions for each item (8 observers × 4 replications=32 evaluations) as recommended by Pineau et al. (2012). Each descriptor was analysed separately. For each point of time, the proportion of runs (subject × replication) for which a given descriptor was assessed as dominant was computed. In this study the intensity levels of the descriptors were not included in the analysis.
Statistical analysis
Data were acquired and processed through the software FIZZ (Biosystemes, Couternon, France), version 2.31G. For each video, each observer, each replication and each descriptor the total dominance duration in s was computed. For each point of time (recorded at 2 s intervals), the proportion of runs (observer × replication) for which a given descriptor was selected (i.e. assessed as dominant), was comput-ed and callcomput-ed dominance rate (%). These calculations allowcomput-ed the con-struction of the TDS curves for each animal. The chance level and sig-nificance level were reported along with TDS curves. The chance level
Table 1. Descriptors used for observer training. Descriptor Definition
Calm The animal moves slowly with head raised but without overt signs of vigilance and/or agitation Active The animal shows high levels of general activity and vigilance with sustained locomotion
Curious The animal is explorative, sniffing partitions or other environmental stimuli such as the ground with lowered head. Locomotion is present but not sustained Nervous The animal is frightened showing sudden and exaggerated reactions to environmental stimuli
Shy The animal moves slowly showing circumspection, uncertainty and insecurity. Avoidance reactions are displayed even to neutral stimuli Apathetic The animal is indifferent to the environment showing low levels of activity and locomotion
Non
commercial
use
(P0) is the dominance rate that a descriptor can obtain by chance
(P0=1/p, where p is the number of descriptors). Descriptors with
dom-inant rates below the chance level are negligible. The significance level is the minimum value that a descriptor should reach to be deemed sig-nificantly higher than the chance level. Therefore, TDS curves above the significance level can be considered consistent across the observers. The significance level (Ps) was calculated according the
following formula: Ps=P0+1.645, where
n=number of observers × replications (Pineau et al., 2009).
Results
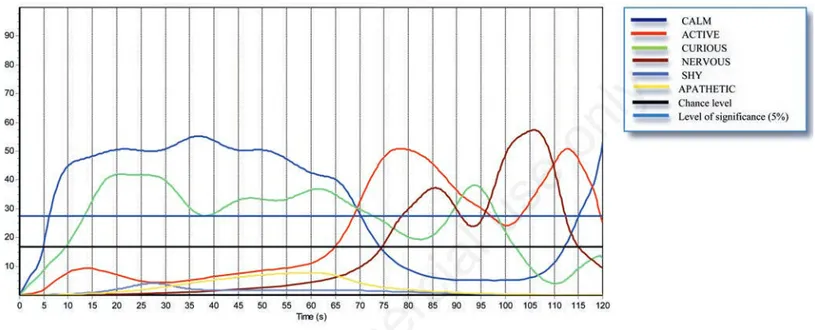
Figures 1 to 4 display the TDS curves of the four buffalo heifers. For each figure, dominance rate is the proportion of citations of dominant sensations performed by the panel. Two additional lines are included in each figure. The first one shows the chance level, which is the domi-nance rate that a descriptor can obtain by chance. The second one is the significance level, expressing the smallest value of the proportion that is significantly (P=0.05) higher than the chance level (see Pineau et al., 2009 for more details).
Figure 1. Temporal dominance of sensations curves of buffalo heifer no. 1. The dominance rate is the proportion of citations of the dominant descriptors performed by the panel. Two additional lines are included: the first one shows the chance level (i.e. the dominance rate that a descriptor can obtain by chance), the second one is the significance level (i.e. the smallest value of the proportion that is sig-nificantly higher than the chance level).
Figure 2. Temporal dominance of sensations curves of buffalo heifer no. 2. The dominance rate is the proportion of citations of the dominant descriptors performed by the panel. Two additional lines are included: the first one shows the chance level (i.e. the dominance rate that a descriptor can obtain by chance), the second one is the significance level (i.e. the smallest value of the proportion that is sig-nificantly higher than the chance level).
Non
commercial
use
Figure 1 shows the curves concerning the evolution of the behaviour of buffalo heifer no. 1. In the first part of the video the significant behavioural descriptors were nervous and active. Nervous was domi-nant from 15 to 55 s, with the highest dominance rate at s 45 (70%). Active was scored as dominant only during the first 15 s of the video and at 55-60 s, but maintained a steady dominance rate, which was never below 40% in the first half of the video (apart from 35 to 45 s, when nervous peaked). Apathetic is the main descriptor of the second half of the video. It is dominant for 25 s with the highest dominance rate at 75 s, when it reached a value of 70.5%. Calm was dominant only for 19.2 s with a dominance rate of 40.5% between 90 and 93 s and again at 112 s. Therefore, the descriptors nervous and active were the
most dominant in the first half of the video when the animal was in the outdoor environment, whereas apathetic and calm dominated the sec-ond half, while the buffalo was indoors.
Figure 2 shows the curves concerning the evolution of the behaviour of buffalo heifer no. 2. The descriptor curious is dominant for most of the first half of the video (about 45 s) with the highest dominance rate recorded at 45 s (80.5%). In the first half it is not dominant only from 19.5 s to 26 s when the descriptor nervous prevails (highest dominance rate of 30.6% at 23 s). Interestingly, at the end of the first half of the video curious shows a downward trend while the descriptor calm shows a corresponding increasing trend, although it is significant for only few seconds, as a possible consequence of habituation to the novel
environ-Figure 3. Temporal dominance of sensations curves of buffalo heifer no. 3. The dominance rate is the proportion of citations of the dominant descriptors performed by the panel. Two additional lines are included: the first one shows the chance level (i.e. the dominance rate that a descriptor can obtain by chance), the second one is the significance level (i.e. the smallest value of the proportion that is sig-nificantly higher than the chance level).
Figure 4. Temporal dominance of sensations curves of buffalo heifer no. 4. The dominance rate is the proportion of citations of the dominant descriptors performed by the panel. Two additional lines are included: the first one shows the chance level (i.e. the dominance rate that a descriptor can obtain by chance), the second one is the significance level (i.e. the smallest value of the proportion that is sig-nificantly higher than the chance level).
Non
commercial
use
ment. In the second half of the video calm is dominant from 70 s to 96.5 s and from 117 to 120 s with the highest dominance rate at 75 s (60.0%), whereas from 97 s to 114 s curious is dominant again with the highest dominance rate at 103 s (50%).
Figure 3 shows the curves concerning the evolution of the behaviour of buffalo heifer no. 3. Calm descriptor is dominant from 8 s to 67 s, when the animal is indoors. The dominance rate reaches the highest value at 36-38 s (52.0%). In the second half of the video active is dom-inant from 70 s to 90 s (highest dominance rate=50.0% at 76.5 s), curi-ous becomes dominant from 90.5 to 97.5 (highest dominance rate=40.0% at 94 s), whereas from 97 s to 109 s the dominant descrip-tor is nervous (highest dominance rate=50.75% at 106 s). At 111-118 s active is again dominant (highest dominance rate=50.5%), whereas at the end of the video (118-120) calm becomes dominant (the highest dominance rate is over 50%), possibly due to the gradual habituation of the animal to the novel environment.
Figure 4 shows the curves concerning the evolution of the behaviour of buffalo heifer no. 4. In this video the descriptor calm is dominant for most of the first indoor part (50 s, from 7 s to 57 s) with the highest dominance rate (60.75%) at about 30 s. From 57 s to 64 s curious is dominant with 40.75% as highest dominance rate. During the second half of the video the descriptors active and curious are alternately dom-inant: the first one dominates for 18 s between 65 s and 83 s, with the highest dominance rate (60.5%) at 73 s, and again from 100 s to 105 s; the second one is dominant from 84 s to 100 s, where it reaches the highest rate (50.75%), and again at 105-115 s. At the end of the outdoor clip (115-120 s) calm becomes dominant (dominance rate=40%), as also observed in other previously described videos.
Discussion
Based on the present results, it seems that observers were able to discern the variations of animal behaviour occurring between clips (indoor vs outdoor) and also within clips, particularly in those recorded outdoors, even in a rather short time lapse (60 s).
The most selected descriptors were active and nervous (which were
dominant in 3 out of 4 clips) in the outdoor novel environment, where-as calm and curious were dominant only once. Conversely, in the indoor familiar environment calm was always dominant, curious in 3 occasions and apathetic only once. These results are in agreement with our previous work conducted on the same footage showing calm and curious animals indoors and active and nervous animals outdoors (Napolitano et al., 2012). However, in addition to the previous findings, the combination of QBA with TDS showed how the behaviour changed in time (e.g. how the animals habituated to the novel environment) in outdoor conditions, whereas the animals showed no particular behav-ioural trends when observed indoors, possibly because they were already habituated to those conditions thus they did not have to adapt their way of interaction with the environment.
All descriptors were dominant at least once, apart from shy, which never dominated. This can be due either to lack of training, or to the fact that shyness was not expressed in the footage, as only a limited part of the available video recordings was used in this study as com-pared with the previous study where this descriptor was elicited (Napolitano et al., 2012).
As an example, in Figure 5 is reported the assessment given by all observers (8) in all replications (4) to buffalo heifer no. 2. Results show a satisfactory agreement among observers and replications, although a more accurate training based on video reference standards showing the 6 behavioural expressions corresponding to the 6 selected descrip-tors, may improve the panel performance. In fact, a lack of agreement can be detected when colours (i.e. descriptors) do not match across either observers or replications.
Conclusions
The results obtained in this preliminary study suggest that QBA, if combined with the appropriate tools, may be able to follow the variation of animal behaviour in time, as no other method does. In a previous work QBA associated with FCP was able to detect higher levels of activ-ity and nervousness in the animals recorded in the outdoor novel envi-ronment, as compared with buffaloes observed in indoor familiar con-Figure 5. Temporal dominance of sensations assessment given by all observers (8) in all replications (4) to buffalo heifer no. 2. The colours matching among bars show the agreement among observers and replications.
Non
commercial
use
ditions. However, the combination of QBA with TDS allowed to monitor the variation of the dominant behavioural expressions in time, such as the habituation of buffaloes to the novel environmental conditions experienced outdoors, thus opening new avenue of research in the field of applied animal behaviour science. Further studies are needed to verify these results in a more comprehensive experiment involving a higher number of observers (10-12) and a more robust training based on video reference standards for each behavioural descriptor.
References
Albert A, Salvador A, Schlich P, Fiszman S, 2012. Comparison between temporal dominance of sensations (TDS) and key-attribute senso-ry profiling for evaluating solid food with contrasting textural lay-ers: fish sticks. Food Qual. Pref. 24:111-8.
Dinnella C, Masi C, Zoboli G, Monteleone E, 2012. Sensory functionality of extra-virgin olive oil in vegetable foods assessed by temporal dominance of sensations and descriptive analysis. Food Qual. Pref. 26:141-50.
Minero M, Tosi MA, Canali E, Wemelsfelder F, 2009. Quantitative and qualitative assessment of the response of foals to the presence of an unfamiliar human. Appl. Anim. Behav. Sci. 116:74-81.
Napolitano F, De Rosa G, Braghieri A, Grasso F, Bordi A, Wemelsfelder F, 2008. The qualitative assessment of responsiveness to environ-mental challenge in horses and ponies. Appl. Anim. Behav. Sci. 109:342-54.
Napolitano F, De Rosa G, Braghieri A, Grasso F, Wemelsfelder F, 2012. Qualitative behaviour assessment of dairy buffaloes (Bubalus bubalis). Appl. Anim. Behav. Sci. 141:91-100.
Pineau N, Goupil de Bouillé A, Lepage M, Lenfant F, Schlich P, Martin N, Rytz A, 2012. Temporal dominance of sensations: What is a good attribute list? Food Qual. Pref. 26:159-65.
Pineau N, Schlich P, Cordelle S, Mathonnière C, Issanchou S, Imbert A, Rougeaux M, Etièvant P, Koster E, 2009. Temporal dominance of sensations: construction of the TDS curves and comparison with TI. Food Qual. Pref. 20:450-5.
Rousing T, Wemelsfelder F, 2006. Social behaviour as a welfare indica-tor in loose housing system for dairy cows: a qualitative approach. Appl. Anim. Behav. Sci. 101:40-53.
Wemelsfelder F, Hunter TEA, Mendl MT, Lawrance AB, 2001. Assessing the whole animal: a free choice profiling approach. Anim. Behav. 62:209-20.
Wemelsfelder F, Millard F, De Rosa G, Napolitano F, 2009. Qualitative behaviour assessment. In: B. Forkman and L. Keeling (Eds.), Welfare Quality® Report No. 11 - Assessment of Animal welfare measures for dairy cattle, beef bulls and veal calves. Cardiff University, Cardiff, UK, pp 215-224.