Università degli Studi di Ferrara
DOTTORATO DI RICERCA IN
SCIENZE DELLA TERRA
CICLO XXVII
COORDINATORE Prof. Massimo Coltorti
GEOCHEMICAL*AND*ISOTOPIC*INVESTIGATION*ON*THE*PO*RIVER*
WATERS*FROM*MONVISO*SOURCES*TO*ITS*DELTA:*NATURAL*
AND*ANTHROPOGENIC*COMPONENTS*
Settore Scientifico Disciplinare GEO/09
Dottorando Tutore
Dott. Marchina Chiara Prof. Bianchini Gianluca
_______________________________ _____________________________
(firma) (firma)
Table of contents
Abstract
1 Preface……….……….1
2 Overview on the Po river and its basin ……….……….……….3
! 3 Preliminary geochemical investigation on the Po river in the surroundings of Ferrara (years 2010 - 2011)…………..……...7
! 4 Activity of the first year, based on the sampling campaigns 2012……….14
4.1 Sampling strategies and analytical method ……….14
4.2 Results and discussion………16
5 Activity of the second year, based on the sampling campaign 2013……….39
5.1 Sampling strategies and analytical method ……….40
5.2 Hydrochemistry……….45
5.3 Oxygen and Hydrogen isotopes in the Po river waters…………..……...……….50
5.4 Carbon, Sulphur and Nitrogen isotopic composition of dissolved components 55 5.5 Carbon, Sulphur and Nitrogen isotopic composition of the suspended matter 65 5.6 Synthesis and consideration on the geochemical and isotopic data………69
6 Activity of the third year, based on the sampling campaigns 2013- 2014………....72
7 Insights on the more sensitive Po river ecosystem: a focus on the geochemistry of Po delta waters………..………..……..89
8 Comparison between analyses carried out in different years and comparison with other riverine systems………...………..83
Abstract
The Po river cross east-west the whole Northern Italy and flows within a densely populated area characterized by intense agriculture and industrial activities. In spite of its importance, systematic geochemical and isotopic investigations of its water are rare and never reported for the whole basin scale. The aim of this study was to fill this knowledge gap investigating the Po river water through a chemical and multi-isotopic approach that includes oxygen, hydrogen, carbon, nitrogen sulphur and strontium isotope data.
The Po river flows within the Padanian plain, which is a sedimentary basin bound to the N by the Alpine mountains, to the SW by the Apennine hills and to the E by the Adriatic Sea
and cover an area of more than 71,000 km2 (a quarter of the national territory). From the
geological point of view the basin was characterized by a marine sedimentation in the Pliocene to Early Pleistocene, followed by fluvial sedimentation that enhanced during the glaciation periods. Within the plain the most important fluvial system is represented by the Po river which is progressively fed by many tributaries (and groundwater flows) from both the Alps and the Apennines. The Alpine streams are mainly fed by snow melting and show a seasonal peak flow during the spring-early summer period, while the Apennines streams have a rainy, and therefore intermittent, influence showing a minimum seasonal flow (drought) during the summer. These tributaries account for the annual regime of the Po river which is characterized by two low-level hydrometric periods (winter and summer) and two flood periods (late fall and spring). The first flood period reflects the intense late fall rains, while the second is due to snow melt from the higher sectors of the. The average
discharge rate is 1,500 m3/s and maximum peak flows of 10,300 m3/s at section of
Occhiobello, which is located in the lower reach of the river (close to the city of Ferrara),
right upstream of the deltaic system.
The isotopic compositions (δ18O - δD ) demonstrate that the predominant part of the runoff
derives from the Alpine sector of the catchment through important tributaries such as Dora Baltea, Ticino, Adda and Tanaro rivers, whereas the contribution of the Apennines tributaries is less important. Geochemical and isotopic data show that the Po river water attains a homogeneous composition at ca. 100 km from the spring. The average
composition measured at Occhiobello is characterized by δ18O 9.6‰, δD 64.0‰, TDS
content (up to 8,000 mg/L and 4,000 mg/L, respectively). The comparison of the data presented in this thesis with historical chemical analyses of Po river (available for the past
fifty years) indicates that the major components (i.e. Ca2+, Mg2+, Na+, K+, HCO3, Cl, SO4)
of the runoff water remained constant over the last decades suggesting that they reflect natural compositions unaffected by anthropogenic activities; in contrast, nitrate drastically increases from less than 1 mg/L to an average value of 9 mg/L as result of diffuse
contamination. Coherently, δ13C (between -11.4‰ and -4.4‰) and δ34S (between 4.2‰
and 8.0‰) and also the 87Sr/86Sr (between 0.70896 and 0.70974) are compatible with the
weathering and dissolution processes that involve the lithologies outcropping in the basin,
while extremely variable δ15N (between -4.1‰ and 18.0‰) indicates contribution from
pollutants of urban origin as well as components released by the agricultural and zootechnical activities. These observations confirm that although the origin of the main constituents of the Po river water is geogenic, anthropogenic contributions are also effective. The data also highlight an evolution of the dissolved nitrogen species that appear extremely reactive, especially in the deltaic part of the river, which is characterized by denitrification processes.
Geochemical and isotopic maps have been drawn to visualize spatial gradients, which reflect the evolution of the river water composition at progressive distance from the source; more detailed maps were focused on the deltaic part in order to visualize the processes occurring in the transitional zone toward the Adriatic Sea. It has to be noted that the presented data represent a snapshot of the nowadays river condition, and that future monitoring will be useful to highlight a) progressive involvement of further anthropogenic components and b) on-going environmental (climatic) changes. For these reasons this research contribute to integrate the GLObal River Chemistry (GLORICH) database (Hartmann et al. 2014, Proc Earth Plan Sci ) which is a useful tool to monitor earth surface processes at extensive scales and high resolution, and also to implement existing isotopic hydro-archives that provide additional information that cannot routinely be recovered from elementary chemistry alone (Bowen et al. 2009, Earth Plan Sc).
1 PREFACE
The current PhD project is the follow up of my undergraduated thesis that was focused on the geochemical study of Po River waters in the surrounding of Ferrara (Marchina, 2011). Developing this thesis I familiarized with the analytical facilities (ion chromatography, ICP-MS) available at the University of Ferrara (Department of Physics and Earth Sciences) in order to obtain information on major and trace elements of the riverine waters. In this framework, I also spent a period at the IGG-CNR of Pisa under the supervision of Dr. Luigi
Dallai to analyze stable isotopes (δ18O – δD) in water samples by IRMS (isotope ratio
mass spectrometry). In the PhD project I decided to extend the geochemical study to the whole river that was sampled in different seasons during the three year of the project (April 2012, August 2012, March 2013, May 2013, May 2014) in several sites located between the Monviso sources to the delta, where the river flows toward the Adriatic Sea. Note that PhD project was greatly favoured by the acquisition (just in the initial period of my PhD project) of a new instrument (CRDS Los Gatos LWIA 24-d isotopic analyser) for the analyses of the water stable isotopes that became essential for the development of the current research. My geochemical background was subsequently enriched by another stage at the CNR of Pisa (June 2012, November-December 2013) devoted to the analyses of the strontium isotopes of Po River water in collaboration with Dr. Maddalena Pennisi, and by a 4 months research period in the framework of a “Erasmus Placement program” (from March 2013 to July 2013) at the Helmholtz-Zentrum für Umweltforschung (UFZ) of Leipzig/Halle (Germany), where I developed a fruitful collaboration with Prof. Kay Knöller in order to investigate the carbon-nitrogen-sulphur isotopes of the dissolved components of Po river water. In the third year I implemented the geochemical and isotopic analyses of the dissolved components investigating the suspended matter in the Po river waters using an additional new IRMS instrument acquired by the Department of Physics and Earth Sciences of the University of Ferrara. Finally, thanks to an additional scholarship (specifically dedicated to youth researchers), provided by the University of Ferrara, I spent a three months visiting period in the USA at the New Hampshire University, where the Po River water were investigated by MC-ICP-MS, under the supervision of Professor Julie
english language. In the following sections I report the outcome of these distinct research periods, in order to provide new insights on the processes and dynamics occurring in this important river.
2 OVERVIEW ON THE PO RIVER AND ITS BASIN
Bacino Fiume Po Area: 70027,19 Km2
Superficie reale: 73939,26 Km2
Figure 1: Po River catchment area (Northern Italy). The Po river course is represented in light blue.
The Po plain (Figs 1 and 2 Ch. 2) is a sedimentary basin bound to the N by the Alpine mountains, to the SW by the Apennine hills and to the E by the Adriatic Sea . From the geological point of view the basin was characterized by a marine sedimentation in the Pliocene to Early Pleistocene, followed by fluvial sedimentation that was enhanced during the glaciation periods (Garzanti et al. 2011). Within the plain, the most important fluvial system is represented by the Po river, which becomes more important with the addition of many tributaries (and groundwater flows) from both the Alps and the Apennines. The Alpine streams are mainly fed by snow melting and show a seasonal peak flow during the spring-early summer period, while the Apennines streams have a rainy, and therefore intermittent, influence showing a minimum seasonal flow (drought) during the summer.
two low-level hydrometric periods (winter and summer) and two flood periods (late fall and spring). The first flood period reflects the intense late fall rains, while the second is due to snow melt from the higher sectors of the catchment (Zanchettin et al. 2008; Coppola et al., 2014; Fatichi et al., 2014).
Figure 2: Schematic lithological map of the Po River drainage basin and relative elevation map from Canali
With regard to the water budget, the main Alpine tributaries (left bank) often display
discharge higher than 100 m3/s (Dora Baltea, 110 m3/s, Ticino 290 m3/s, Adda up to 160
m3/s), whereas the Apennine tributaries (right bank) usually show discharge lower than 50
m3/s. The Tanaro river draining the Maritime Alps (Liguria) is the only right bank tributary
with high average discharge (up to 130 m3/s). These tributaries transfer their water budget
to the Po river, which progressively increases its average discharge from the upper to the
lower part of the basin: 1.1 m3/s after 5 km from the spring, 50 m3/s after ca. 90 km from
the source, 958 m3/s at Piacenza (300 km from the spring), 1115 m3/s at Cremona (350
km from the spring), 1,500 m3/s at Pontelagoscuro (Montanari 2012; Tarpanelli et al. 2013;
integrated with data provided by the Basin Authority of the Pedimont Region). Downstream of Pontelagoscuro, the Po river approaches a delta consisting of six major distributaries; from the main course the first diversion (southward) is represented by Po di Goro which drains ca. 15 % of the original flow. A second diversion (northward) is represented by Po di Levante, which is artificially regulated and separated from the main course which is known as Po di Venezia. The latter progressively distributes water to Po di Gnocca (southward; 13% of the flow) and Po di Maistra (northward; 2% of the flow) finally subdividing in Po di Tolle (15% of the flow) and Po di Pila (55% of the flow).
The current hydrographic network has been variably constrained by anthropogenic activities that: a) embanked the river to avoid the recurrent avulsions and diversions (Castellarin et al. 2011); b) constructed dams to store water reservoirs (Zampieri et al., 2014); c) organized a widespread network of artificial canals that are used to regulate the hydrological flow as well as to irrigate agricultural fields (Bozzola and Swanson 2014). According to the hydrological balance provided by Montanari (2012) the annual River
recharge consists of ∼ 78 km3 of water, 25 of which are lost by evapotranspiration while
6.5 are consumed by civil, agricultural and industrial uses, leading to a discharge of ∼ 47
km3 of river water within the Adriatic Sea, roughly in agreement with the previous estimation of Artina et al. (1990) which proposed an annual flow of 42.6 km3 of river water toward the sea.
crystalline (metamorphic and granitoid) basement rocks that pertain to the Alpine and Hercynian orogenic cycles and by Jurassic ophiolites (serpentinized peridotites, gabbros and basalts), with only subordinate limestone compositions of Triassic and Jurassic age. The northern Apennines is mainly made of Tertiary flysh (alternation of sandstone and pelite rocks) and Jurassic ophiolites (Garzanti et al. 2011; 2012). The Padanian plain is obviously made of alluvial sediments representing the weathering products of the rocks mentioned above (Amorosi 2012; Bianchini et al. 2012; 2013; 2014).
3 PRELIMINARY GEOCHEMICAL INVESTIGATION ON THE PO RIVER IN
THE SURROUNDINGS OF FERRARA (years 2010 - 2011)
Figure 1: a) Location of the Po River watershed (investigated area) in Northern Italy and relatively sampling
station (red dots) of the sampling campaigns in the years 2010 – 2011; b) Average monthly precipitation at Pontelagoscuro station (Ferrara) during the year 2010; c) Discharge of the Po river in the section of Pontelagoscuro (Ferrara) during the year 2010.
This chapter briefly reports the data carried out in the period August 2010, November 2010 and February 2011, available for the restricted zone in the surrounding of Ferrara (Fig. 1a, Ch. 3). This represents the incipit of the current PhD project on the geochemistry of Po river water. This sampling and the relative data were carried out under the supervision of Dr. Claudio Natali in a phase in which I wasn’t independent yet. Therefore a more detailed description of the analytical methods will be reported in the next chapters for the subsequent sampling campaigns in which my operative role has been predominant. Table 1, Ch. 3 reports some parameters measured in the field (temperature, pH and water conductivity) as well as major and trace elements (reported in mg/L and µg/L respectively).
variation. As concerns dissolved heavy metals V, Cr, Mn, Fe, Ni never exceed the drinking water tolerance threshold. Anomalous concentration of iron (1,200 µg/L), aluminium (650 µg/L) and manganese (89 mg/L) is recorded only in Crespino site during the flood of
November 2010 (Q= 6050 m3/s), whereas arsenic is generally high (15-21 µg/L)
throughout the whole sample population. Note that in Fig. 2 a) and b), Ch. 3 a significant Fe-Al correlation is observed among the samples collected in the summer season, and the sample collected at Crespino during the flood of November 2010 has the highest value registered.
9 : a) Ph ys ic o-che m ic al p aram ete rs of s ur fac e wate rs of th e P o ri ver m ea sured in the f ie ld in the d iff erent loc a lit y a nd c he m ic al c om po si tion . Ma jor are r ep res e nt in m g/L b) tr ac e e lem en ts ( in µg/L). “na ” for s am pl es no t an a ly ze d, “nd ” for th e e lem en ts no t d e tec ted .
1 10 100 1 10 100 1,000 10,000 Mn (µg/L) Fe(tot) (µg/L) + 10 100 1 10 100 1,000 10,000 + Fe(tot) (µg/L) Al(µg/L) 1,000
Figure 2: Po river waters in the terminal part of the river a) binary diagram Fe vs Al; b) binary diagram
Fe vs Mn.
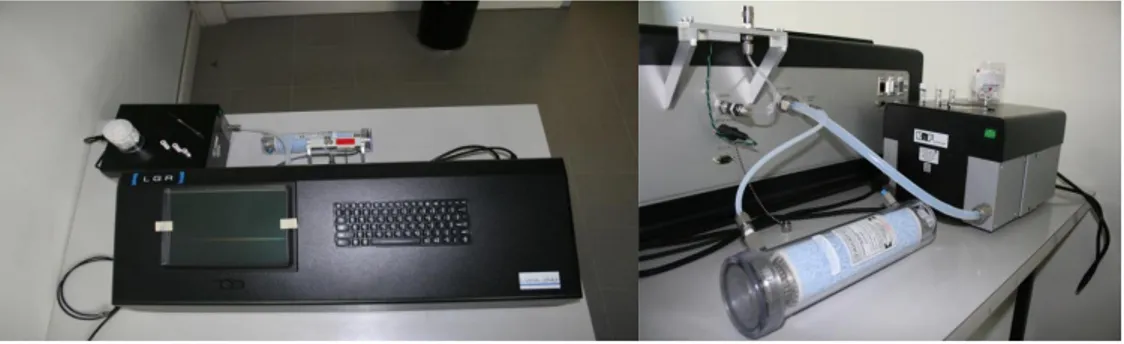
These waters have been also analysed by IRMS at the IGG-CNR of Pisa, under the supervision of Dr. Luigi Dallai to measure the isotopic composition oxygen and hydrogen. The data have been also useful to calibrate a new instrument that was acquired in that period at the Department of Physics and Earth Sciences of the University of Ferrara. This instrument is a Los Gatos, CRDS LWIA 24-d (Fig 3 a and b. Ch. 3).
Figure 3: a) The Los Gatos CRDS LWIA 24-d liquid-water stable isotope instrument; b) vacuum pump,
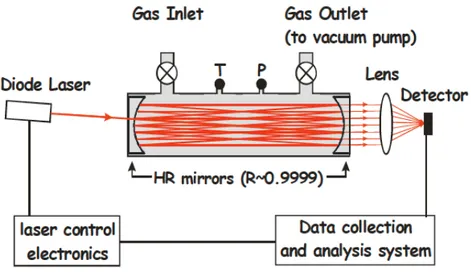
Fig. 4: Technical Overview Off-Axis Integrated Cavity Output Spectroscopy
I actively contributed to the set up of this instrument that allows an innovative quick and cost effective method to analyse isotopic composition of waters alternative to the more established IRMS technique.
The Off-axis integrated cavity output spectroscopy (OA-ICOS) exploits Beer- Lambert’s law (Ricci et al., 1994) to relate the absorption of a laser light passing through a vaporized water sample to the isotopic composition of the sample (Fig. 4,
Ch.3). Another important feature of this instrument is the simultaneous analysis of 2H
and 18O for each injection of water, reducing time and operational expenses per
measured sample. In addition, simultaneous measurements exclude the potential relative error of two separate measurements of hydrogen and oxygen isotopes at different times.
A certificate attesting my experience and competence on this analytical technique is reported in the appendix A.
It has to be noted that the cross-check between the oxygen and hydrogen isotopic composition obtained by IRMS and those obtained by CRDS Los Gatos LWIA-24d
δD, respectively. The data, reported in Table 2 and Fig. 3, represent the preliminary results of an hydro-archive on the Po river waters, that has been greatly improved in the subsequent years of the PhD project.
Tabella 2: Hydrogen and oxygen isotope ratios in the Po river waters in the terminal part of the river.
Data are expressed in ‰ respect to the SMOW standard.
The recorded δ 18O values ranging between -10.8‰ and -8.6‰, and δ D values
ranging between -69.4‰ and -62.5‰ are compared with the local groundwaters (Rapti Caputo and Martinelli, 2008), the Northern Italy Meteoric Water Line (Longinelli and Selmo, 2003) and the Global Meteoric Water Line (GMWL) from Craig (1961) in Fig. 5 Ch. 5. In spite of the sampling area is located in lower part of the river course (close to the Adriatic sea), the surface waters mainly reflect isotopic composition of precipitation in the Upper Part of the basin located in Piedmont region and reported in Longinelli and Selmo (2003; 2006).
Figure 5: δ18O - δD isotopic composition of Po river water for the sampling campaign of August 2010. Po river waters are represent with white circles, Meteoric water lines are also reported for comparison: the dotted line represents the global meteoric water line (GMWL; Craig 1961); the dashed line represents the local meteoric water line (LMWL), defined for Northern Italy (Longinelli and Selmo 2003). The black cross represents sample collected in the Adige river in November 2011.
4 ACTIVITY OF THE FIRST YEAR, BASED ON THE SAMPLING
CAMPAIGNS 2012
In this period I carried out the first systematic sampling of the whole river that was thoroughly investigated using the analytical facilities available at the University of Ferrara. The outcome of the activity of this year has been synthetized in a paper titled “The Po river water from the Alps to the Adriatic Sea (Italy): new insights from geochemical and isotopic
(δ18O-δD) data” that is currently in press on “Environmental Sciences an Pollution
Research” (Marchina et al., in press).
4.1 Sampling strategies and analytical methods
50 100
Precipitation (mm) Air temperature (°C)
0 5 10 15 a) b)
Jan Feb Mar Apr May Jun Jul Aug Sep Oct Nov Dec
-4 -5 -6 -3 -2 -1 2,000 1,500 500 1,000 c) Discharge 2012 (m3/s) Hydr.height (m)
Figure 1: a) Hillshade map of the Po river catchment (based on NASA SRTM data) reporting the sampling
locations where Po river water samples have been collected. Distinct symbols have been used for water sampled at increasing distance from the source in the upper part (UP, black squares), middle part (MP, grey triangles), terminal part (TP, light grey circles) that typically display significant compositional changes. b) Average (2002-2010) monthly precipitation (grey histograms) and air temperature (black line) of the UP sector of the Po river basin (Fatichi et al., 2014); c) discharge (Q, m3/sec; black line) and water level height (grey line) of Po River in the section of Pontelagoscuro which is located at the boundary between the MP and UP sector delineated in this study. The values are specifically referred to the year 2012, and black
In the first year two sampling campaigns were plan in order to investigate the runoff water of the Po river at basin scale. For this purpose 54 water samples were collected along the whole stream of the Po river, from its source (Pian del Re spring) to the deltaic area in distinct seasonal periods, mainly in April and August 2012 (Tab. 1, Ch. 4 and Fig.1 Ch. 4). The rationale behind the selection of sampling locations was to monitor the water geochemistry along the river profile, before/after the confluence of important tributaries, settlements and/or zones of important productive activities, but logistical criteria (i.e. easy site accessibility) were also taken into consideration. Each sampling location was geo-referenced by a portable global positioning system (GPS), to locate the points and to set up future field surveys. Surface water was collected at 40-50 cm depth using a bucket, possibly far from the shore (using boats, piers, or sampling above bridges). Electrical conductivity (EC), pH and temperature were directly measured in the field (Tab. 1, Ch. 4), then water samples were filtered by 0.45 µm filters (Minisart® NML syringe cellulose acetate filters) and stored in two distinct 100 ml bottles, one for the analysis of anions and oxygen/hydrogen isotopes and a second (acidified with 0.5 mL of concentrated Suprapur
HNO3) for the determination of cations and trace elements.
Laboratory analyses were carried out at the Department of Physics and Earth Sciences of the University of Ferrara. Hydrogen and oxygen isotope ratios were determined using the CRDS LOS GATOS LWIA 24-d isotopic analyzer and reported in Tab. 2, Ch. 4. The
isotopic ratios of 2H/1H and 18O/16O are expressed as δ notation [δ = (Rsample/Rstandard −
1)*1000] with respect to the V-SMOW (Vienna Standard Mean Ocean Water) international standard. Four bracketing standards that cover the whole range of isotopic values of the Po river water were run throughout the analytical sessions. These standards, obtained from the Los Gatos Research Company, were calibrated with international standard such as V-SMOW and SLAP (Standard Light Antarctic Precipitation). Analytical precision and
accuracy were better than 0.3‰ and 1.0‰ for δ18O and δD respectively.
Major cations and trace elements were detected by inductively coupled plasma mass spectrometry (ICP-MS) using a Thermo-Scientific X Series instrument on samples previously diluted 1:10 by deionized Milli-Q water (resistivity of ca. 18.2 MΩ x cm), also introducing known amount of Re and Rh as internal standard; in each analytical session
provided by SCP-Science (www.scpscience.com). The major anions were determined by ion chromatography using a DIONEX ICS-1000 calibrated using solutions obtained by different dilutions of the DIONEX “7-ion standard”. Accuracy and precision, based on the repeated analyses of samples and standards, were better than 10% for all the considered parameters. The mentioned analyses are reported in Tab. 3, Ch. 4. The coherence of chemical data has been verified checking the ionic balance, as the sum cations (expressed in meq/L) approaches that of anions with relative error, [(Σcations−Σanions)/ (Σcations+Σanions)]*100, which is generally minor than 5%.
Geostatistical modelling has been carried out in order to visualize the spatial variation of the obtained geochemical data. Interpolated maps along the Po river geographical extension were produced in ArcGIS 9.3 (Geostatistical Analyst extension) at a resolution of 170 m by generalized linear regression technique (ordinary kriging), using a spherical semivariogram model with nugget on log10 transformed data. Considering that I was interested in the reflection of large‐scale features (>10 km) of the river water composition, I chose to conduct the interpolation without the use of ancillary variables such as elevation (Bowen and Wilkinson 2002) that would introduce high amplitude variability in the interpolated surface over short length scales.
4.2 Results and discussion
pH, temperature and conductivity of Po river waters
Parameters measured in-situ such as pH, temperature and conductivity of Po river water have been reported in Tab. 1, Ch. 4. To appreciate (physico-chemical) changes along the flow path the sample population has been geographically subdivided in three subsets corresponding to increasing distance from the river source, defined as UP (upper part), MP (middle part), TP (terminal part), and the related variability has been also evaluated in order to delineate spatial-temporal changes.
pH was rather homogeneous, i.e. 7.8-8.9 in UP, 7.7-8.7 in MP, 7.5-8.5 in TP, without systematic trends in the distinct sampling periods. On the other hand, the water temperature shows significant spatial-temporal variation; in UP it varied between 6 °C
(locality Pian del Re, April 2012) to 21 °C (locality Carignano, August 2012); in MP it varied between 16 °C (April 2012) to 28 °C (August 2012); in TP it varied between 16 °C (in April 2012) to 31°C (in August 2012).
Water conductivity was also variable, increasing from UP (average 200 µS/cm) through MP (average 370 µS/cm), up to TP where samples were more heterogeneous (average 410 µS/cm). Higher conductivity (up to 8,500 µS/cm) has been sporadically observed in some samples from the deltaic part of the river. This indicates progressively higher amounts of dissolved components moving from the UP, to the MP, and to the TP catchment areas.
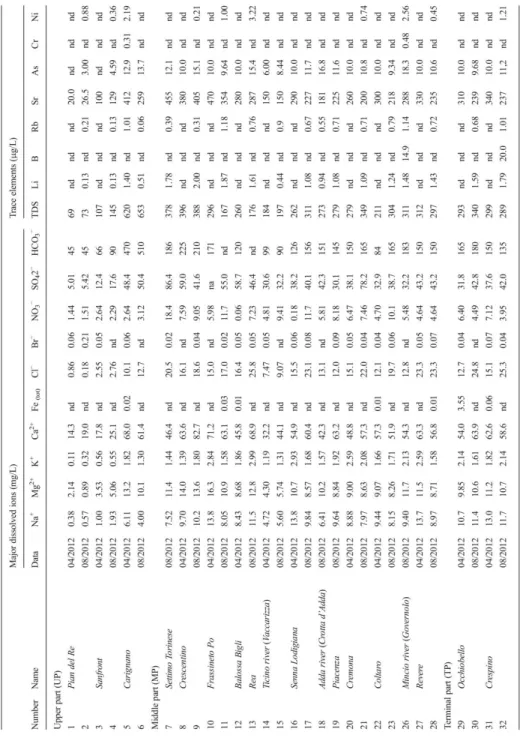
Table 1: Physico-chemical
parameters measured in the field. According to the geographical distribution, the investigated samples have been subdivided in three distinct groups, representative of the UP (upper part), MP (middle part) and TP (terminal part) of the Po river course. This subdivision is reflected in distinct parameters, as emphasized by electrical conductivity progressively increasing from UP, to MP and TP water. Some important tributaries (Ticino, Adda, Mincio), sampled close to the confluence with Po river have been also taken into account.
n. Name Data Latitude Longitude pH T (°C) EC (µS/cm )
Upper Part (UP)
1 Pian del Re 04/2012 44°42' 04.00" 07° 05' 42.00" 8.9 6 80 2 08/2012 8.8 6 110 3 Sanfront 04/2012 44° 39' 03.89" 07° 19' 58.90" 8.2 9 120 4 08/2012 8.8 16 190 5 Carignano 04/2012 44° 54' 31.37" 07° 41' 29.93" 8.0 16 470 6 08/2012 7.8 21 510 Middle Part (MP) 7 Settimo Torinese 08/2012 45° 07' 29.63" 07° 46' 15.37" 8.6 24 540 8 Crescentino 04/2012 45° 10' 32.96" 08° 05' 55.61" 8.2 17 470 9 08/2012 8.2 23 566 10 Frassineto Po 04/2012 45° 08' 39.77" 08° 32' 27.29" 8.6 19 490 11 08/2012 8.5 28 450 12 Balossa Bigli 04/2012 45° 03' 58.00" 08° 54' 48.80" 8.0 18 380 13 08/2012 7.7 25 310 14 Rea 08/2012 45° 07' 27.90" 09° 09' 31.96" 8.0 26 200
15 Ticino river (Vaccarizza) 04/2012 45° 08' 40.88" 09° 13' 48.62" 8.2 16 230
16 08/2012 8.4 26 450
17 Senna Lodigiana 04/2012 45° 07' 46.41" 09° 38' 07.16" 8.0 18 370
18 08/2012 8.6 26 440
19 Adda river (Crotta d'Adda) 08/2012 45° 09' 18.97" 09° 51' 13.62" 8.0 25 500 20 Piacenza 08/2012 45° 03' 41.76" 09° 41' 53.51" 8.7 25 430 21 Cremona 04/2012 45° 07' 43.34" 09° 59' 45.93" 8.0 18 350
22 08/2012 8.7 26 430
23 Coltaro 04/2012 44° 59' 03.67" 10° 18' 27.70" 8.2 17 360
24 08/2012 7.8 27 420
25 Mincio river (Governolo) 08/2012 45° 05' 11.58" 10° 57' 43.99" 8.6 24 310 26 Revere 04/2012 45° 03' 27.46" 11° 07' 52.80'' 8.0 16 370 27 08/2012 7.8 27 420 Terminal Part (TP) 28 Occhiobello 04/2012 44° 55' 04.78" 11° 34' 46.10" 8.5 16 360 29 08/2012 8.0 27 480 30 Crespino 04/2012 44° 58' 37.64" 11° 52' 53.06" 8.2 17 400 31 08/2012 8.0 28 480 32 Bottrighe 04/2012 45° 01' 15.17" 12° 04' 44.24" 8.4 17 400 33 08/2012 7.6 29 460 34 Taglio di Po 04/2012 45° 00' 36.12" 12° 13' 09.12" 8.2 17 410 35 08/2012 7.5 30 450
36 Po di Levante (Porto Levante) 04/2012 45° 02' 43.00" 12° 19' 27.52" 8.0 19 1,010
37 08/2012 7.5 31 450
38 Po di Goro (mouth) 08/2012 44° 47' 36.80" 12° 23' 44.80" 7.9 28 8,500 39 Po di Goro (Gorino Veneto) 08/2012 44° 50' 15.54" 12° 20' 42.18" 7.8 29 5,700 40 Po di Gnocca (Santa Giulia) 08/2012 44° 50' 18.30'' 12° 22' 30.08'' 7.8 29 3,600 41 Po di Gnocca (Polesinino) 08/2012 44° 52' 28.70'' 12° 20' 27.60'' 7.7 29 1,780 42 Po di Gnocca (Donzella) 08/2012 44° 55' 54.10'' 12° 19' 31.40'' 7.7 30 450 43 Po di Venezia (Villa Regia) 08/2012 44° 57' 14.30'' 12° 17' 56.00'' 7.7 31 430 44 Po della Pila (Cà Zuliani) 08/2012 44° 57' 25.90'' 12° 25' 14.30'' 7.8 30 810 45 Po della Pila (near Pila) 08/2012 44° 57' 25.00'' 12° 27' 05.00'' 7.7 30 1,127 46 Busa Dritta (mouth) 08/2012 44° 58' 00.00'' 12° 31' 47.00'' 7.8 30 5,500 47 Po di Goro (Serravalle) 12/2011 44° 58' 09.85" 12° 03' 27.05" 7.9 6 470 48 08/2012 7.7 28 440 49 Po di Goro (Ariano) 12/2011 44° 56' 35.07" 12° 07' 23.17" 8.1 6 480 50 08/2012 7.7 28 440 51 Po di Goro (Mesola) 12/2011 44° 55' 27.29" 12° 13' 17.96" 8.4 6 460 52 08/2012 7.6 28 440 53 Po di Goro (S. Giustina) 12/2011 44° 53' 36.51" 12° 17' 03.35" 8.2 6 470 54 08/2012 7.6 28 1,160
Isotopic composition of Po river waters
The δD‰ and δ18O‰ isotopic ratios have been measured for Po river water sampled in
distinct hydrological periods of the year 2012. δD‰ ranges from -92.0‰ to -48.0‰ in
winter-spring and from -94.7‰ to -55.1‰ in summer, whereas δ18O‰ ranges from -13.1‰
to -7.0‰ in winter-spring and from -13.4‰ to -6.9‰ in summer. These data are plotted in Fig. 2a, Ch.4 together with the global (GMWL; Craig 1961) and local meteoric water lines (northern Italy; Longinelli and Selmo 2003; Longinelli et al. 2006); the presented data were also compared with the compositions of meteoric precipitation of prevalent Atlantic provenance (e.g. rain in Germany; Stumpp et al., 2014) and meteoric precipitation of prevalent Mediterranean provenance (e.g. rain in Greece; Dotsika et al., 2010) which can provide the isotopic fingerprint of vapour mass end-members potentially interesting in this study-area. The recorded isotopic compositions of hydrogen and oxygen in the Po river water mainly reflects the isotopic composition of the meteoric precipitations (rain, snow, glacier ice melting) in the drainage area which is in turn related to altitude and continental effects. Most Po river isotopic compositions conform to those of precipitations occurring at high altitudes in the north/northwestern-most part of the basin (UP), i.e. from high Alpine zones (Fig. 2b, Ch. 4 modified after Longinelli and Selmo 2003). Coherently, Montanari (2012) shows that the prevalent meteoric contribution (up to 1,600 mm/yr of precipitation) in the Po river basin is confined within the mountainous Alpine sectors, which collect most of the catchment precipitations. In particular:
1) Samples from the upper part of the river (UP), located from the spring of Pian del Re
downward to the locality of Carignano (before the town of Torino), display δ18O varying
from -13.4‰ to -11.1‰ and δD varying from -94.7‰ to -75.3‰. The average δ18O
recorded in April (-12.5‰) is slightly more negative than the average value observed in August (-12.2‰) whereas the average δD value are nearly constant in the two seasons. 2) Samples from the middle part of the river (MP), located between the localities of
Frassineto Po and Revere, display δ18O varying from -12.5‰ to -8.4‰ and δD varying
from -84.7‰ to -60.1‰. The average δ18O recorded in April (-9.8‰) is analogous to the
average value observed in August (-9.8‰), and also the average δD values are nearly constant in the two seasons.
δ18O recorded in winter-spring (-9.1‰) is slightly more negative than the average value observed in summer (-8.1‰) whereas the average δD values are nearly constant in the two seasons
Table 2: Hydrogen and oxygen isotope
ratios in the Po river waters. Some important tributaries (Ticino, Adda, Mincio), sampled close to the confluence with Po river have been also taken into account. Data are expressed in ‰ respect to the SMOW standard. na = not analyzed.
n. Name Data δ18O (‰) δD (‰) d-exc (‰)
Upper Part (UP)
1 Pian del Re 04/2012 -13.1 -92.0 14.4 2 08/2012 -13.4 -94.7 13.7 3 Sanfront 04/2012 -12.7 -82.9 19.8 4 08/2012 -12.1 -84.2 13.9 5 Carignano 04/2012 -11.6 -78.9 15.0 6 08/2012 -11.1 -75.3 14.6 Middle Part (MP) 7 Settimo Torinese 08/2012 -10.7 -74.9 11.9 8 Crescentino 04/2012 -11.0 -71.6 17.8 9 08/2012 -10.6 -74.0 11.9 10 Frassineto Po 04/2012 -11.0 -75.4 14.0 11 08/2012 -10.4 -72.2 11.6 12 Balossa Bigli 04/2012 -9.7 -67.4 11.1 13 08/2012 -9.8 -69.4 10.3 14 Rea 08/2012 -9.8 -69.4 10.3
15 Ticino river (Vaccarizza) 04/2012 -9.1 -64.5 9.0
16 08/2012 -8.9 -62.8 9.6
17 Senna Lodigiana 04/2012 -9.5 -62.7 14.4
18 08/2012 -9.6 -60.4 17.6
19 Adda river (Crotta d'Adda) 08/2012 -9.2 -62.3 12.6
20 Piacenza 08/2012 -9.2 -62.8 11.9
21 Cremona 04/2012 -9.4 -63.8 12.4
22 08/2012 -9.2 -62.4 12.4
23 Coltaro 04/2012 -9.3 -61.1 14.0
24 08/2012 -9.3 -62.0 13.5
25 Mincio river (Governolo) 08/2012 -9.1 -62.3 11.3
26 Revere 04/2012 -8.9 -63.5 8.2 27 08/2012 -9.2 -60.6 14.3 Terminal Part (TP) 28 Occhiobello 04/2012 -8.8 -58.0 12.9 29 08/2012 -8.7 -60.1 13.2 30 Crespino 04/2012 -9.6 -61.2 16.2 31 08/2012 -8.9 -60.9 12.8 32 Bottrighe 04/2012 -9.9 -59.4 21.0 33 08/2012 -9.1 -58.8 14.7 34 Taglio di Po 04/2012 -9.8 -59.6 19.8 35 08/2012 -9.0 -58.8 14.1
36 Po di Levante (Porto Levante) 04/2012 -7.0 -48.0 8.7
37 08/2012 -6.9 -55.1 0.6
38 Po di Goro (mouth) 08/2012 -7.8 -57.2 5.7
39 Po di Goro (Gorino Veneto) 08/2012 na na -40 Po di Gnocca (Santa Giulia) 08/2012 na na -41 Po di Gnocca (Polesinino) 08/2012 -7.3 -59.4 0.0 42 Po di Gnocca (Donzella) 08/2012 -7.4 -60.4 -0.4 43 Po di Venezia (Villa Regia) 08/2012 -7.5 -60.8 0.0 44 Po della Pila (Cà Zuliani) 08/2012 -7.3 -60.2 -1.0 45 Po della Pila (near Pila) 08/2012 na na -46 Busa Dritta (mouth) 08/2012 -8.1 -58.6 6.9 47 Po di Goro (Serravalle) 12/2012 -9.3 -64.0 11.6
48 08/2012 -8.6 -61.7 7.9
49 Po di Goro (Ariano) 12/2012 -9.6 -62.1 15.7
50 08/2012 -8.7 -61.2 9.4
-100 -90 -80 -70 -60 -50 -15 -13 -11 -9 -7 δD ‰ (V-SMOW) PRECIPITATION IN GERMANY PRECIPITATION IN GREECE δ18O ‰ (V-SMOW) a) -5‰ b) NORT HERN ITAL Y METE ORIC LIN E GMW L
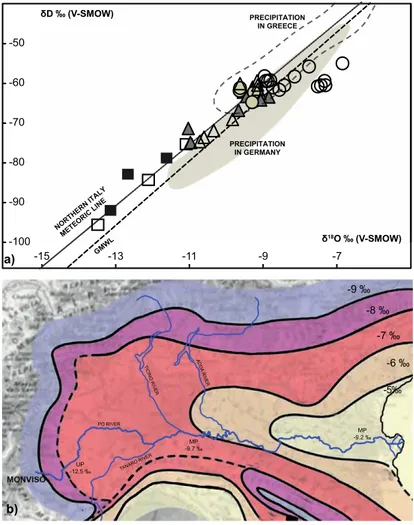
Figure 2: a) 18O- D isotopic composition of Po river water. Meteoric water lines are also reported for
comparison: the dotted line represents the Global Meteoric Water Line (GMWL; Craig 1961); the dashed line represents the Local Meteoric Water Line, defined for Northern Italy (LMWL; Longinelli and Selmo 2003), together with compositional fields relative to meteoric precipitation of prevalent Atlantic provenance (e.g. rain in Germany; Stumpp et al., 2014) and meteoric precipitation of prevalent Mediterranean provenance (e.g. rain in Greece; Dotsika et al., 2010). Filled symbols (black square for UP, grey triangle for MP, light grey circle for TP) represent samples collected in winter-spring; open symbols (square for UP, triangle for MP, circle for TP) represent samples collected in summer. b) Contour lines reporting the geographical distribution of the oxygen isotopic composition of precipitation in Italy and the Po river course together with the more significant fluvial elements (modified after Longinelli and Selmo 2003; for interpretation refer to the colored web version of the paper). In this map the average isotopic composition of UP, MP, TP Po river water is also reported. See text for further explanation.
The isotopic variability observed along the river profile is presented in Fig. 3, Ch. 4 which
reports the δ18O value as a function of the distance from the river source, also
emphasizing relationships with the discharge of the main course and the principal tributaries. If we take into account the seasonal sampling of August in the UP and MP parts, a remarkable correlation can be observed between the distance (d) from the source
(expressed in km) and both δ18O and δD (r2 better than 0.9). Distinctive d – δ‰ linear
relationships characterize the UP and MP water, the former giving higher regression
slopes (e.g. 3.5 and 0.5 respectively for δ18O). The mean UP-MP gradient observed from
the source is 0.2‰ δ18O and 1.7‰ δD per 10 km. The trends recorded in Figs. 2 and 3
can be referred to altitude variation of the meteoric recharge along the river course, as the water budget along the profile progressively integrate meteoric contributions related to lower altitudes. In particular, in the UP part the elevation of the sampling sites is negatively
correlated with δ18O by a logarithmic relationship (r2 = 0.98), while in the MP a linear
regression better describes the relations between these parameters (r2 = 0.90). The mean
altitude gradient recorded along the UP and MP is -0.5‰ δ18O per 100 m rise, slightly
higher than that defined for meteoric water of the area (-0.3‰ δ18O) by Zuppi and
Bortolami (1982). The δ18O /100 m gradient defined in this study is also higher than the
global gradient defined by Bowen and Wilkinson (2002), but it is comparable with that defined by precipitations occurring in Germany (Stumpp et al., 2014), possibly suggesting an origin from similar vapor masses of prevalent Atlantic provenance. These notable correlations describing the morphoclimatic effects in the UP and MP parts of the river do not characterize the TP part, which is plausibly influenced by local effects that disturb the original isotopic fingerprint of the meteoric water that feed the river. The relative isotopic
consistency of Po river MP water samples irrespective to seasonal variability (δ18O ∼ -9.5
‰) suggests that the associated riverine system integrate multiple contributions, which are mixed and homogenized. This indicates that significant water volumes, which buffer further variations, already characterize the MP sector of the river. Changes observed at the most important tributary confluence (Ticino river), progressively disappear after few kilometres being homogenized within the riverine water mass, whereas isotopic variations due to the
confluence of Apennine tributaries (having δ18O ∼ -8.0 and -8.9 ‰; Iacumin et al. 2009)
Figure 3: Variation of the 18O signature in function of the distance from the source of the Po river. The relation with the discharge of the main course and the principal tributaries is also reported. Filled symbols (black square for UP, grey triangle for MP, light grey circle for TP) for samples collected in April 2012; open symbols (square for UP, triangle for MP, circle for TP) for the samples collected in August 2012; represents additional analyses of Po river water available in the literature, whereas + and x represent the right bank and left bank tributaries, respectively; (Zuppi and Bortolami 1982; Delconte et al. 2014; Iacumin et al. 2009; Rapti Caputo and Martinelli 2009). As concerns the TP deltaic sector, open circles are divided in two different size: big circles represent samples taken in Po di Venezia (the main distributary) whereas the small circles represent Po di Goro and Po di Gocca (minor/secondary branches).
The presented data, including isotopic composition of river water sampled in distinct periods (April and August 2012) allow us to evaluate relationships between the δ‰ values and the temperature. From the data presented in Fig. 1b Ch. 4 (air temperature), Tab. 1, Ch. 4 (water temperature), and Tab. 2, Ch. 4 (isotopic values) it can be noted that limited isotopic variation is coupled with significant temperature changes of both water and air (in
the order of 10 °C). This is reflected in a Δδ18O/T°C gradient of ∼ 0.1‰, which is scarcely
significant. The lack of significant variation for water samples collected in distinct hydrological phases (peak discharge in April, drought in August) along the whole stream path is possibly due to: a) delayed effect of winter meteoric contributions caused by snow melt (and alpine glacier melting) that are slowly released in the summer period b) by
sub-surface inflow which variously delay the meteoric contributions; c) by man-made dams which create reservoirs in which meteoric contribution of different seasons mix together.
Noteworthy, the UP-MP Po river water displays remarkable δ18O-δD similarity to the
groundwater from the first confined aquifer (depth of 20 to 50 m, in the Ferrara surroundings) of the alluvial plain, suggesting a common Alpine origin and/or repeated river-aquifers exchanges; on the contrary water of the shallow phreatic aquifers displays less depleted isotopic compositions more influenced by local precipitations, and is scarcely influenced by interaction with the Po river (Rapti-Caputo and Martinelli, 2009). Particular emphasis has to be given to the isotopic composition of the TP, where the river develops a complex deltaic system. In this sector, the isotopic composition evolve toward less
negative values, with δ18O up to -9.0‰ and δD up to -6.9‰, in relation to a more effective
evaporation due to the reduction of the water flow velocity, and mixing with saline water. In Tab. 2, Ch. 4 it is also report the values of the deuterium excess calculated as: d-exc =
δD-8*δ18O on the basis of the world meteorological water line as defined by Dansgaard
(1964). This variable provides additional information on the prevailing moisture conditions at the source region but is also related to the temperature recorded at the precipitation site and to the evaporation effects, thus providing a further criterion in the distinction of waters having different origins. The UP samples are characterized by averages d-exc of 16.8‰ and 14.3‰ for April and August, respectively. This parameter is very constant in the MP samples with averages of 12.6‰ and 12.8‰, respectively. These d-exc values recorded in the UP and MP river sectors are intermediate between those recorded in north-European precipitations (e.g. in Germany, 6-12 ‰; Stumpp et al., 2014) and those of south-Mediterranean precipitations (e.g. in Greece12.9-20‰; Dotsika et al., 2010). The d-exc is significantly lower in TP samples that are characterized by extremely heterogeneous values (down to negative values in the August period). This observation confirms the occurrence of a high evaporation rate only in the terminal part of the river.
Summarizing, the compositions of the water from the first two groups (UP and MP) are roughly aligned along the above mentioned meteoric water lines, whereas water belonging
to the third group (TP) shows a δ18O shift toward less negative compositions (Fig. 2a, Ch.
4). The observed isotopic differences along the trunk of the Po river are emphasized in the Fig. 3, Ch. 4 where isotopic values are plotted along the riverine profile at increasing
middle part is characterized by slight, but systematic, variation. The isotopic fingerprint of the central part of the river, compared with the dataset of the meteoric compositions in northern Italy (Longinelli and Selmo 2003; Longinelli et al. 2006) indicates that most of the river recharge occurs in the north-western part of the basin, i.e. conveyed mainly from the Alpine highlands. It has to be noted that the isotopic composition of the river remained
constant in the last years, as the δ18O value reported by Iacumin et al. (2009) for Po river
close to Cremona is nearly identical to the values recorded by my survey in the same site.
Dissolved components
A detailed understanding of the processes controlling the water chemistry of a river is crucial to define geochemical cycles within a given catchment. Although natural studies of riverine chemistry at the global scale have been widely discussed (Gibbs 1970; Meybeck 1987; Gaillardet et al. 1999; Gaillardet 2014; Viers et al. 2014), specific regional researches performed on the Po river catchment are rare. The amount of the dissolved species are related to the nature of lithologies outcropping in the catchment and the weathering processes typically occurring in the region (Voss et al. 2014 and references therein). Moreover, the anthropogenic contribution related to human activities cannot be neglected. The investigation has been refined taking into consideration the chemical analyses of the major cations and anions (Tab. 3, Ch. 4).
Table 3: Chemical composition of Po river waters. Some important tributaries (Ticino, Adda, Mincio),
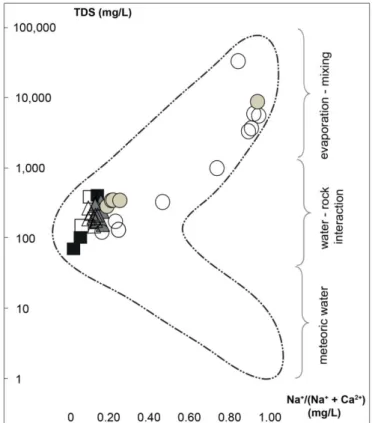
The Total Dissolved Solids (TDS), calculated as a sum of the major chemical species, coherently increases from the upper part of the catchment where the UP samples have TDS < 100 mg/l, to the central part where the MP samples have a TDS between 250 and 300 mg/l. Higher TDS values are generally observed in the deltaic samples (> 500 mg/l), with localized high saline samples (TDS up to 5,864 mg/l) which possibly result from effective mixing with sea water during momentary high tide influence. It is extremely interesting to note that the chemical variations along the river course, starting from the sources of Pian del Re, synthetized in the notional Gibbs diagram where TDS values
(y-axis) are plotted against the [Na+/(Na++Ca2+)] ratio (x-axis, Fig. 4, Ch. 4).
Figure 4: Gibbs diagram: TDS vs Na/(Na+Ca) reported in mg/L for the Po river water. Filled symbols (black
square for UP, grey triangle for MP, light grey circle for TP) for samples collected in winter-spring; open symbols (square for UP, triangle for MP, circle for TP) for the samples collected in summer.
It can be observed that the UP water, and in particular that from Pian del Re, already displays a significant degree of water-rock interaction. According to the Langelier Saturation Index the initial Po river water (close to the Pian del Re source) is calcite under-saturated, but it quickly reached calcite saturation, being buffered from further interaction with the scarce carbonate lithologies outcropping in the basin. Conversely, reactions with silicate-rocks and their constituent minerals continue all along the river course explaining
the comparatively higher TDS and [Na+/(Na++Ca2+)] ratios observed in the MP samples.
More extreme [Na+/(Na++Ca2+)] ratios characterize the TP samples from the deltaic area,
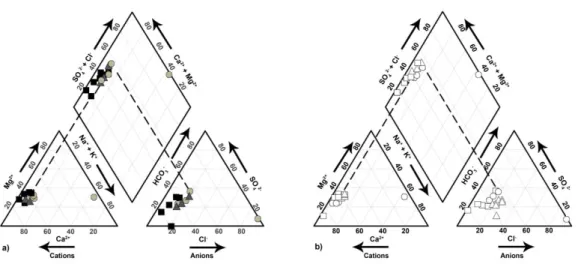
confirming the mixing with saline sea (and lagoon) water, as also evidenced by the isotopic signature of these samples. A more comprehensive examination is given by the Piper classification diagram of Fig. 5, Ch. 4 where it can be observed that Po river water mainly exhibits a bicarbonate-alkaline earth hydrochemical
Figure 5: Piper classification diagram reporting composition of River Po water a) samples collected in
winter-spring, b) samples collected in summer.
facies, with slight but significant differences between the delineated UP, MP, TP groups of samples. Very few TP samples show a chloride-alkaline hydrochemical facies that indicate effective mixing with saline water. The calculation of a correlation matrix highlights
coherent elemental relationships along the whole sample suite; in particular, Cl- positively
element such as Li and Rb (r2 is better than 0.9 for all the mentioned elements ), whereas
Ca2+ mainly correlates with Sr (r2=0.72). Elemental ratios have been also taken into
account because they can highlight the different lithologies that have been weathered releasing chemical component in the interacting water (Viers et al. 2014; Voss et al. 2014).
In the Po river water: Ca2+/Na+ (molar) is 21.6-6.4 and 3.8-2.3 for UP and MP,
respectively; Mg2+/Na+ (molar) is 5.3-2 and 1.4-0.7 for UP and MP, respectively. These
values have been compared with those provided by Meybeck (2003) for water of mono-lithological basins which interacted with distinct carbonate and plutonic/metamorphic silicate rocks; the comparison reveals that the UP water preferentially dissolves carbonate components, whereas the MP water is progressively influenced by silicate rocks (igneous and metamorphic) components, which are particularly abundant in the catchment. The trace element ratio could provide further useful information; according to the findings provided by Natale et al (2013), who analysed little mono-lithological alpine catchments, the rubidium/strontium ratio can highlight if the weathered rocks are mainly composed by carbonates (low Rb/Sr) or silicates (high Rb/Sr). It has to be noted that the Po river water is usually characterized by Rb/Sr between 0.004 and 0.009, values suggesting prevalent interaction with silicate rocks that predominate in the highlands of the catchment, and only a subordinate interaction with carbonate lithologies. In general, the more extreme variations are observed in the terminal part of the river, where evident mixing trends can be observed in the bi-variate diagrams of Fig. 6, Ch. 4 which are based on the more
conservative elements (Cl- vs Br-, SO42-, Na+, Li, B). In these diagrams, the real TP
compositions compared with theoretical mixing lines with seawater indicate that up to 20 % of marine influence could affect the river waters. Other less conservative elements, if plotted and compared with the theoretical sea water mixing lines, show that the mixing process is largely not ideal and not conservative, possibly as result of ion-exchange processes with suspended solid particles (Bianchini et al. 2005).
!
Figure 6: Scatter diagrams reporting compositions of
the more conservative ions (Cl, Na, Li, Br, SO4).
Emphasis is given to the TP water of Po river collected in August (circles), which are variously affected by mixing with seawater and salinization, whereas the remaining UP and MP samples are grouped within a compositional field. Note that real TP compositions are compared with theoretical seawater mixing trends, showing that the more saline TP samples correspond to ≈ 20% of mixing with seawater.
0.01 0.10 1 10 1 10 100 1,000 10,000 100,000 20%SW 10%SW 5%SW 1%SW Br - (mg/L) Cl - (mg/L) c) 1 10 100 1,000 1 10 100 1,000 10,000 100,000 1%SW 5%SW 10%SW 20%SW SO42- (mg/L) Cl- (mg/L) b) 1 10 100 1,000 10,000 1 10 100 1,000 10,000 100,000 Cl- (mg/L) Na+ (mg/L) 1%SW 5%SW 10%SW 20%SW a) 0.01 0.10 1 1 10 100 1,000 10,000 100,000 20%SW 10%SW 5%SW 1%SW Cl - (mg/L) B (mg/L) e) 1%SW 10-4 10-3 10-2 10-1 1 10 100 1,000 10,000 100,000 5%SW 10%SW 20%SW d) Cl - (mg/L) Li (mg/L)
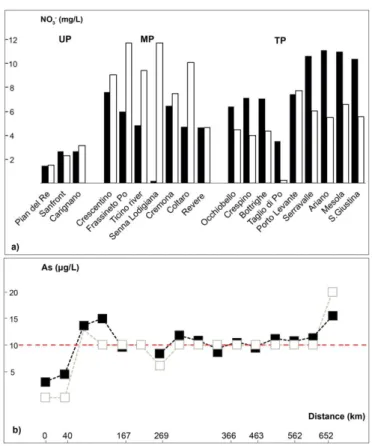
Anthropogenic contributions are superimposed on the geochemical fingerprint, as indicated by the concentration of nitrate (Fig. 7a, Ch. 4) that reaches the highest values in the MP
samples (12 mg/L). It is interesting to note that in the MP of the river the dissolved NO3- is
systematically higher in winter-spring than in summer, whereas in the TP of the river NO3
-becomes preponderant in the summer period, possibly suggesting a diverse origin in the two
zones. The precise origin of NO3- in water from the Po plain was recently investigated by
Sacchi et al. (2013) that evidenced: a) diffuse contamination related to the agricultural activities that use abundant nitrogen-bearing fertilizers, b) punctual (direct) pollution from (zootechnical) activities that produce nitrogen rich manure, c) sewers from densely inhabited lower Po plain settlements. In particular, the higher nitrate concentration has been detected close to the city of Parma and Piacenza where agricultural breeding practices are widely developed. The obtained results also complement the studies of the Po river solid load (Cozzi and Giani 2011), suggesting the first order role of Po river in regulating the nitrogen budget of the Adriatic Sea.
Figure 7: a) Histograms representing the NO3- dissolved in different Po river sites in distinct hydrological
periods (expressed in mg/L; white color, winter-spring; black color, summer). b) arsenic concentration (expressed in μg/L) along the Po river profile (white squares, winter-spring; black squares, summer).
Emphasis is also given to elements that are potentially toxic and hazardous in water for drinking purposes (e.g.: As, Ni, Cr; Tab. 3, Ch. 4). For example, arsenic (Fig. 7b, Ch. 4) is generally high throughout the whole sample population and often exceeds the tolerance limits for drinkable water defined by the European Council Directive 98/83/EC (on the quality of water for human consumption) and by the World Health Organization (10 μg/L). Attention also has to be paid to nickel and chromium that are known to be enriched in the alluvial sediments of the area due to widespread outcrop of ophiolite ultramafic rocks in the Po river catchment (Bianchini et al. 2012; 2013; 2014). The analyses (Tab. 3, Ch. 4) reveal that the mobility of chromium is limited (probably due to the Eh and pH conditions of the studied waters), as indicated by concentration <10 μg/l in the natural water of the area, i.e. significantly lower than the European drinking standards (20 and 50 μg/l for Ni and Cr, respectively). Nickel displays a higher mobility, possibly because it is associated with serpentine that is a metastable mineral phase (Kierczak et al. 2007). Coherently the Cr/Ni is always higher than one in the Po river sediments, whereas it is always lower than one in the studied waters; therefore, the high bio-accessibility of nickel represents a potential geochemical risk for the area and has to be carefully monitored (Cempel and Nikel 2005).
Spatial variability of water isotopes and chloride
Geochemical maps are a useful tool to describe the state of environmental resources of a territory. In this light, interpolation of point measurements using geostatistical techniques can be used to estimate values in the neighbours, i.e. to extend predictions to non-sampled locations. The geostatistic approach is based on the spatial autocorrelation concept defining that nearby objects are more related than distant objects. It has been traditionally applied to emphasize geochemical backgrounds and anomalies of soils (Goovaerts 1998) but is also useful, and progressively more used, for hydrological applications (Dutton et al. 2005; Bowen 2010; Timsic and Patterson 2014).
Figure 8: Geochemical map showing the D (‰) spatial variation along the geographical extent of Po river. For
interpretation refer to the colored web version of the paper.
In this study, spatial interpolation techniques have been used to define the geochemical variability of Po river waters along its main channel, also considering the potential contribution of some alpine and apennine tributaries (additional data from Iacumin et al. 2009; Delconte et al. 2014). The goal is to visualize geochemical changes within the riverine system, providing a spatial snapshot of the summer conditions, which may represent a tool to understand ongoing processes. The most appropriate method of spatial interpolation to map the isotopic and geochemical variability of the Po river is the “kriging” algorithm in which the weights assigned to nearby data during the interpolation process are determined by a model of the covariance structure of the observational data (Isaaks and Srivastava 1990). A spherical semivariogram model has been fitted by automatic calculation of its parameter by the Geostatistical Analysis
tool (ArcGis 9.3) in which anisotropy has been also considered evaluating its significant directional differences.
Figure 9: Geochemical maps focused on the deltaic part of the Po river showing a) the D (‰) and b) the
chloride (mg/l) spatial variation, respectively. For interpretation refer to the colored web version of the paper.
Interpolation models reveal that the Po riverine distribution of both δ18O and δD delineates a
rough but systematic isotopic gradient, with values that become less negative as the water reaches the lowlands along the river course. This “weighting” trend is particularly evident for hydrogen isotopes and is depicted by the thematic map of Fig. 8, Ch. 4 which allows the definition of a precise δD gradient obtained by an interpolation algorithm relating the geographical distance with the considered parameter. This is particularly evident in the UP and MP parts, reflecting the mean elevation of the relative sub basins and the isotopic composition of the associated meteoric waters (Dutton et al. 2005; Kendall and Coplen 2001). The δD spatial distribution indicates that the Po river isotopic fingerprint acquired in the MP is buffered and maintained irrespective to the confluence of the tributaries having distinct compositions, only varying with the distance from the source.
In particular, the geostatistical approach is extremely useful in the deltaic sector where the river is subdivided in several branches. Accordingly, emphasis is given to the TP of the river in order to highlight geochemical variation related to mixing processes with marine water; in
Fig. 9a, Ch. 4 it can be observed that the main deltaic branch (Po di Venezia) nearly preserves the unaltered original composition, whereas waters of the second order (outer) branches such as Po di Levante, Po di Maistra, Po di Gnocca, Po di Tolle, Po di Goro) display a more marked δD “positivization”; this observation is plausibly due to their lower discharge and flow velocity which make them more sensitive to seawater intrusion. This hypothesis is supported by the geochemical map of Fig. 9b, Ch. 4 which reports the chloride spatial variation in the same TP sector. Further constraints would require the preparation of analogous geochemical maps taking also into consideration the tidal characteristics, which could influence the mixing between river and marine water. The spatial correlation of the
d-excess, which amplifies small differences between the observed δD and δ18O parameters,
has been also taken into consideration in order to identify the ultimate origin of the vapour air masses circulating within and around the Po river basin. The ordinary kriging interpolation of this parameter along with the Po river highlights an initial d-exc composition around +14‰ which conforms with the fingerprint of precipitations of Atlantic provenance; d-exc gradually decreases to ca. +10 ‰ down flow to the confluence of Ticino River and is followed by a re-increase up to +17,6 ‰ in the, MP, which plausibly reflects meteoric contribution from both Atlantic and Mediterranean (d-exc up to +27‰; Cruz-San Julian et al. 1992; Lambs et al. 2013) provenance. The prediction map finally exhibits a sharp d-exc decrease (down to negative values) in the deltaic portion of TP, where evaporation and mixing processes have been described above.
5 ACTIVITY OF THE SECOND YEAR, BASED ON THE SAMPLING
CAMPAIGNS 2013
The activity of the second year started with other two sampling campaigns (March 2013, May 2013) in which samples have been collected in the same sites delineate in the previous chapter. The related samples have been investigated to carry out major ions as well as oxygen and hydrogen isotopes. In addition, this chapter presents the analyses of other isotopic tracers such as carbon, sulphur
and nitrogen (δ13C, δ34S, δ15N) that provide further information to understand the
river geochemical cycles and its dynamics. Furthermore, the current chapter reports the analyses of suspended matter collected during the same year in the Po river water. The presented data implement the discussion of the previous chapters in order to discriminate natural compositions and superimposed anthropogenic components. In fact, as widely described in the literature (Mook, 2005; Garrels et al, 1973; Schulte et al. 2011) the riverine geochemistry gives first-order constraints on the processes affecting the continental surface (weathering of rocks, erosion and dissolution as well as human pollution) in turn resulting on the amount and nature of geochemical components transferred to the sea. A manuscript containing the outcome of this chapter has been already submitted to the Journal “Environmental Monitoring and assessment”.
5.1 Sampling strategies and analytical methods
Figure 1: a) Po river catchment area (based on NASA SRTM data) and relative sampling stations
Distinct symbols have been used for water sampled at increasing distance from the source in the upper part (UP, black squares), middle part (MP, grey triangles), and terminal part (TP, light grey circles); b) Monthly precipitation (2013) in the Upper Part of the Po river catchment (data provided by ARPA PIEMONTE); c) Po river discharge (Q, m3/s) in the section of Pontelagoscuro which is located at the boundary between the MP and UP sector delineated in this study; the values are specifically referred to the year 2013 (data provided by ARPA EMILIA ROMAGNA).
In this year 36 water samples were collected along the whole stream of the Po river (Fig. 1, Ch. 5) from its source (Pian del Re spring) to the deltaic area in March and May 2013. As described before, the rationale behind the selection of sampling locations was to monitor the water geochemistry along the river profile, before/after the confluence of important tributaries, settlements and/or zones of important productive activities, but logistical criteria (i.e. easy site accessibility) were also taken into consideration. Each sampling location was geo-referenced by a portable global positioning system (GPS), to locate the points and to set up future field surveys.
Surface water was collected at 40-50 cm depth using a bucket, possibly far from the shore (using boats, piers, or sampling from bridges). Electrical conductivity
(EC), pH and temperature were directly measured in the field, then water samples were filtered by 0.45 µm filters (Minisart® NML syringe cellulose acetate filters) and stored in distinct 100 ml bottles; one for the analysis of anions and oxygen/hydrogen isotopes, one acidified with 0.5 mL of concentrated Suprapur
HNO3 for the determination of cations, and additional two bottles for the
measurement of carbon, nitrogen and sulphur isotopes (δ13C-δ18O; δ15N- δ18O;
δ34S- δ18O).
Analyses were carried out at the Department of Physics and Earth Sciences of the University of Ferrara (Italy). As described above cations were measured by inductively coupled plasma mass spectrometry (ICP-MS) using a Thermo-Scientific X Series instrument on samples previously diluted 1:10 by deionized Milli-Q water (resistivity of ca. 18.2 MΩ x cm), introducing known amount of Re and Rh as internal standard; in each analytical session the analysis of samples was verified with that of the reference materials EU-L-1 and ES-L1 provided by SCP-Science (www.scpscience.com). The anions were determined by ion chromatography using a DIONEX ICS-1000 calibrated using solutions obtained by different dilutions of the DIONEX “7-ion standard”. Accuracy and precision, based on the repeated analyses of samples and standards, were better than 10% for all the considered parameters.
Hydrogen and oxygen isotope ratios were determined using the CRDS LOS
GATOS LWIA 24-d isotopic analyzer and reported in Table 2, Ch. 5. The isotopic
ratios of 2H/1H and 18O/16O are expressed as δ notation [δ = (R
sample/Rstandard − 1)*1000] with respect to the V-SMOW (Vienna Standard Mean Ocean Water) international standard. Four bracketing standards covering the whole range of isotopic values of the Po river water were run throughout the analytical sessions. These standards, obtained from the Los Gatos Research company, were calibrated with international standards such as V-SMOW and SLAP (Standard Light Antarctic Precipitation). Analytical precision and accuracy were better than
0.3‰ and 1.0‰ for 18O and D respectively. A cross check of the obtained δ18O -
δD values have been done re-analysing a data subset with a PICARRO L2120-i water isotope analyser (Fig. 2, Ch. 5) at Helmholtz Centre for Environmental