Facoltà di Scienze Matematiche, Fisiche e Naturali
Dottorato di Ricerca in Scienze Chimiche
XXXI Ciclo
Design of Li-O
2
cells
and study of the electrodes reactivity
by means of a multi-technique approach
Anno Accademico 2017/2018
Candidato: Daniela Giacco
Relatore: Dott. Andrea Giacomo Marrani
2
Index
1. Introduction ... 5
1.1. Li-air cells - an emerging technology ... 5
1.2. Aprotic Li-O2 cell – structure and reactions ... 6
1.3. A focus on cathode materials for aprotic Li-O2 cells……….19
1.4. The possible use of a co-catalyst ... 12
2. The PhD activity ... 13
2.1. Aims and surrounds of the PhD project ... 13
2.2. An overview of the PhD activity through the three years ... 14
3. Instrumentation and techniques ... 16
3.1. Electrochemical characterization ... 16
3.2. Materials characterization ... 17
3.2.1. SEM and EDS ... 17
3.2.2. TEM ... 18
3.2.3. FTIR spectroscopy ... 18
3.2.4. XRD ... 19
3.2.5. XPS ... 19
3.2.6. XPS measurements with synchrotron radiation ... 20
4. Study on a carbon-based cathode ... 23
4.1. Aims ... 23
4.2. Samples preparation and cells assembly ... 23
4.3. Electrochemical tests ... 24
4.3.1. Voltage limited performance on one cycle ... 24
4.3.2. Long-term performance ... 25 4.4. Chemical characterization ... 27 4.4.1. TEM ... 27 4.4.2. FTIR spectroscopy ... 29 4.4.3. XPS ... 31 4.5. Conclusions ... 38
3
5. Study on novel carbon-free cobaltite-based cathode
and corresponding powders……….40
5.1. Aims ... 40
5.2. Samples preparation ... 40
5.2.1. Attempts to modify the synthesis procedure and results ... 42
5.2.2. Attempts to doping and results... 42
5.3. Electrochemical tests on NC@Ni, NCCr@Ni and NCZn@Ni electrodes ... 44
5.3.1. Voltage limited performance on one cycle ... 45
5.3.2. Long-term performance ... 46
5.3.3. Pseudo-Tafel plots... 47
5.4. Chemical characterization of NC@Ni, NCCr@Ni and NCZn@Ni ... 50
5.4.1. XRD ... 50
5.4.2. SEM and EDS ... 52
5.4.3. TEM ... 56
5.4.4. XPS ... 56
5.5. Conclusions and open questions ... 68
6. XPS study on cobaltite-based samples by means
of synchrotron radiation……… 69
6.1. Aims ... 69
6.2. Summary of the samples and experimental details ... 70
6.3. Results ... 71
6.3.1. Pristine electrodes ... 71
6.3.2. Powders ... 75
6.3.3. Post-mortem cathodes ... 80
6.4. Conclusions ... 85
7. Study on the use of Pd as co-catalyst ... 86
7.1. Aims ... 86
7.2. Samples preparation ... 86
7.3. Electrochemical tests ... 87
7.3.1. Voltage limited performance on one cycle ... 87
7.3.2. Long-term performance ... 88
4 7.4.1. Pristine materials ... 90 7.4.2. Post-mortem cathodes ... 94 7.5. Conclusions ... 97
Final remarks ... 98
Bibliography ... 100
5
CHAPTER 1
Introduction
1.1. Li-air cells - an emerging technology
Lithium-air cells are a promising system for energy storage thanks to their high theoretical energy density (i.e. about 3500 Wh kg-1).1–3 If some operating issues were overcome, they would be applied in various sectors where other common batteries show at the present time limited performance. Particularly, lithium-air is one of the most promising technology to replace the lithium-ion one, whose energy storage is limited (i.e. 2000 Wh kg-1) by the thermodynamics of its characteristic reactions.1,4
Besides the electronic devices, lithium-air batteries could also find application in the electric transportation making possible the assembly and diffusion of full electric vehicles with high round trip efficiency and long time interval between a recharge and the next one.
The structure of a lithium-air cell usually includes a lithium anode, a porous cathode and a liquid, semi-solid or solid state electrolyte solution. On discharge, oxygen gas from the air is the active material, whose reduction leads to products that are different on the basis of the cell structure and used components.
A careful choice of the materials enables to realize an eco-friendly technology with lower costs respect to other storage devices.
At present, despite the theoretical good electrochemical response, lithium-air cells are quite far from being really operative because they cannot work in an “open” configuration due to some unwanted reactions at the electrodes/electrolyte interface mediated by the air gases different from oxygen such as carbon dioxide, nitrogen and moisture. Cell components degradation and the accumulation of by-products on the electrodes surfaces caused a fast loss of reversibility and the cell death after few cycles of discharge and charge.1,2,5–8 Therefore, two lines of research actually exist concerning the lithium-air technology.
On one hand, scientific efforts are aimed at making possible the exposition of the battery to air. This field of research is “engineering-related” and focus on the construction of protective membranes with a selective permeability to oxygen for both the anode and the cathode.2,5,9
On the other hand, the optimization of the “inner” electrochemistry and chemistry is mandatory to overcome the limits in the reversibility, the high overpotentials on discharge and charge, the energy loss and the low
6 long-term life. This research is realized on model devices in a closed configuration, filled with pure oxygen, called Li-O2 cells. The goal is the evaluation of a good combination of electrode materials and electrolyte
solutions demonstrating a limited degradation upon cycling. In a Li-O2 cell, protected from the action of gas
different from oxygen, the accumulation of insulating by-products derives from the chemical decomposition of the used electrode materials and electrolyte and has to be considered the major factor for the rise of the overpotentials and the cell death after few cycles.
1.2. Aprotic Li-O2 cell – structure and reactions
The anode of a Li-O2 battery is usually made of metallic lithium. Despite various operational issues related
to its use, its unmatched lightness ensures high discharge capacity and energy density. Although an increase in the total weight of the anodic compartment must be taken into account, to protect lithium and prevent dendrites growth on its surface, various strategies have been proposed.4,10,11
Referring to the electrolyte solution, Li-O2 cells can be identified as aqueous, non-aqueous or aprotic, mixed
and solid-state. The solvent (i.e. water, organic, a mixture of them or a polymer-based material) influences the cell reactions and causes different working issues. Aqueous devices performance is limited by the incompatibility between the lithium anode and the aqueous medium. Mixed and solid-state batteries have a complicated and heavy structure. So, in the last years the research has focused almost totally on the non-aqueous Li-O2 cells, whose aprotic electrolyte solution is composed by a lithium salt dissolved in an organic
solvent.
The discharge electrochemistry of an aprotic Li-O2 battery involves the oxygen reduction and combination
with Li+ cations to form lithium oxides (Oxygen Reduction Reaction - ORR). Lithium peroxide (Li2O2) is the
major discharge product. Instead, lithium oxide (Li2O) is quite undesired because its formation is only
partially reversible. By means of various experimental and theoretical studies the reactions mechanisms have been investigated.12–14 It is generally accepted that the ORR involves the following processes:
𝐿𝑖++ 𝑂2+ 𝑒−→ 𝐿𝑖𝑂2 (1)
𝐿𝑖𝑂2+ 3𝐿𝑖++ 𝑂2+ 3𝑒−→ 2𝐿𝑖2𝑂2 (2)
2𝐿𝑖𝑂2→ 𝐿𝑖2𝑂2+ 𝑂2 (3)
2𝐿𝑖++ 𝑂2+ 2𝑒−→ 𝐿𝑖2𝑂2 (4)
After a first oxygen monoelectronic reduction (1), a lithium superoxide (LiO2) intermediate converts in Li2O2
by means of a second fast monoelectronic reduction (2) or a slow chemical disproportionation (3). However, a direct oxygen two-electrons reduction is also possible (4). Li2O growth is more difficult because of the
7 only at high overvoltage, so it could be limited stopping the discharge process limiting the discharge capacity and/or the working potential to certain values.
Lithium oxides are insoluble in the organic electrolyte, so they accumulate on the cathode. The cell open circuit voltage (OCV) is similar to the Li2O2 formation theoretical E° (i.e. about 3.10 V, see the dashed blue
line in Figure 1, Uo is the cell OCV) 1
. On discharge the voltage usually shows a sudden decrease becoming lower respect to the E° due to the partial or total lithium oxides insulating character. The unavoidable rise of the discharge overvoltage implies that the cathodic part of a typical Li-O2 cell galvanostatic curve has the
shape shown in Figure 1 (see the dashed black line, Udis is the ORR operative potential). 1
Theoretically, on charge the reverse reactions of (1), (2) and (4) take place (Oxygen Evolution Reaction - OER). However, it has been demonstrated that the reverse process of (1) and (2) can be viewed as reactions at the upper and the inner parts of Li2O2 particles, being their external layers oxygen-enriched (i.e. with Li
+
vacancies) respect to their bulk.14,15 On charge overpotential is also usually registered. So, the anodic part of the galvanostatic curve fast rises respect to the OCV, as shown in Figure 1 (Uchg is the charge operative
potential).
Figure 1. Typical shape of a Li-O2 cell galvanostatic curve for one cycle of discharge and
charge. In this case, the galvanostatic discharge–charge cycle was performed at a current density of 200 mA g-1, adopting a solution of LiTFSI/DME as electrolyte and a Vulcan XC72 carbon black material as cathode (see Ref. [1]).
8 On summary, as portrayed in Figure 2,16 in an aprotic Li-O2 cell the ORR and OER take place at the
cathode/electrolyte interface and are three-phase reactions because they involve Li+ cations from the liquid electrolyte, the oxygen gas and the electrons flow moving through the cathode.
Various research efforts have been devoted to test different combinations of inorganic lithium salts and organic solvents for Li-O2 cells. Despite the overall effect has to be influenced by the interaction with other
cell components, lithium triflate (LiTFO) or lithium bis(trifluoromethanesulfonyl)imide (LiTFSI) dissolved in a polyether such as tetraethyleneglycol dimethyl ether (TEGDME) have been reported to ensure good performance. This is due to the stability of the salt anion17–19 and to an appreciable resistance to oxidative attacks of the solvent.20
The use of high donor number (DN) species to prepare the electrolyte, small discharge rates and cathode materials with low binding energy (BE) respect to LiO2, facilitates the growth of lithium peroxide in large
particles by means of a solution-based process (i.e. slow disproportionation (3) favored respect to fast second electron reduction (2)). Instead, low DN species, high rates and cathode materials with an high binding energy respect to the superoxide, cause the fast nucleation of Li2O2 layers by means of a surface-mediated
mechanism (i.e. second electron reduction prevails upon disproportionation). In the first case, higher discharge capacity can be registered. Nevertheless, in the second case, the OER is favored thanks to an higher Li2O2 surface exposition.
3,20–28
So, the choice of both a lithium salt and a solvent with an intermediate DN (e.g. TFSI- and TEGDME) could be a good compromise in terms of degradation grade of the organic solvent, Li2O2 growth mechanism and related electrochemical response.
Due to its central role in the Li-O2 electrochemical process, the cathode material has to respond to some
desired characteristics. During the ORR, its conductivity enables the electron flow, its porosity allows the Figure 2. Schemes of the structure and a) the discharge (ORR) and b) the charge (OER)
9 accommodation of lithium oxides particles and the maintenance of an adequate oxygen flow and its lightness ensures the registration of high discharge capacity and energy density. Another possible key-factor should be its catalytic activity towards both the ORR and the OER. Low cost and environmental impact are also desirable. Finally, both the organic solvent and the positive electrode material have to resist to oxidative chemical attacks mediated by highly reactive reduced oxygen species
(O
2-, O
22-,
1O
2, LiO
2, Li
2O
2).
29–321.3. A focus on cathode materials for aprotic Li-O2 cells
In the most common configuration, an aprotic Li-O2 cell was usually assembled with a carbon-based
material as positive electrode. Various forms of carbon matched some of the desired characteristics (i.e. lightness, porosity, low cost and environmental impact). Moreover, carbon surface defects act as catalytic centers for both the ORR and the OER.1,2,9,30,33,34,35 Unfortunately, carbon-based materials and polymer binders used as supports demonstrated low inertness to oxidative chemical attacks.1,9,19,36–39 Upon cycling, their degradation by-products and those from the organic solvent accumulate on the cathode surface and its pores blocking the positive electrode. Moreover, their insulating character causes the rise of the overvoltage both on discharge and charge. Upon cycling, the increase of the voltage hysteresis stress the cell materials and shortens the battery life-time.
Therefore, the search of conductive, light, porous, low cost carbon-free material as cathode for Li-O2 cell has
become an emerging issue in the view of the assembly of an optimized configuration.40 Moreover, this new material has to show equal or higher catalytic activity towards the cell reactions respect to carbon.
Good electrochemical performance have been reported for Li-O2 cell assembled with transition metal
oxides (TMOs) as positive inert carbon-free electrodes in combination with ether-based electrolytes. Due to their higher weight respect to the carbon-based ones, Li-O2 cells assembled with TMOs such as WO3,
40
TiO2, 30,40
RuO2, MnO2, 30,41
Fe2O3, Fe3O4, NiO and CuO 42
in various crystallographic and morphological structures, have demonstrated lower specific discharge capacities. However, improved performance have been registered in terms of reversibility and extended cycle life because of the overpotential decrease, particularly on charge. In some cases, this effect has been related to the presence of defects on the material active surfaces such as oxygen vacancies, acting as catalytic sites for the OER.30
Among the TMOs, a particular case of study is the cobalt oxide Co3O4. This material, grown in various
nano-structures, not only has remarkable effect in reducing the charge overpotential but also the potential gap between discharge and charge. Its catalytic activity towards both the ORR and the OER has been confirmed by the registration of enhanced discharge capacities and cycle stability.30,40,43,44,45
Some research groups related these phenomena to the high porosity and active surface of this nanostructured material and to a major exposition of catalytic sites to the electrolyte solution.40,43,44,45 However, this explanation sounds somewhat inadequate as similar effects have not been registered using other TMOs. So, a possible influence of the Co3O4 electronic structure has to be supposed.
10 The toxicity and low eco-compatibility of Co(II), have made necessary its partial substitution with other cations.42,46 This explains the enhancement of the scientific interest for mixed transition metal oxides such as cobaltites, with a general formula MCo2O4 where M represents a metal replacing some amount of cobalt.
These materials have a spinel structure with a cubic unit cell cF56 with centered faces in which 56 atoms can be found: 16 cobalt atoms, 32 oxygen atoms and 8 M atoms different from cobalt (Figure 3).47 Particularly, Co(II) occupies tetrahedral sites while Co(III) can be found both in tetrahedral and octahedral sites. Generally speaking, on the base of their valence, Mn+ cations can substitute both Co(II) in tetrahedral sites and Co(III) in octahedral sites.42,47
Among the cobaltites family, nickel cobaltite (NiCo2O4) has been reported as a good catalyst for the ORR
and the OER, enabling remarkable electrochemical performance as cathode material for Li-O2 cell.48,49,50
This compound is cheap, non-toxic and it can be synthesized by simple methods.48,50,51,52 Moreover, NiCo2O4
demonstrates higher conductivity than the single oxides Co3O4 and NiO. So, on discharge and charge, it can
facilitate the electron transfer.46,53,54,55 However, as in the case of Co3O4, the nickel cobaltite electrochemical
response cannot be explained in such a simple way. A general opinion is that its high catalytic activity has to be related to the co-presence of two redox couples in the crystallographic structure (i.e. Ni3+/Ni2+ and Co3+/Co2+).50 These sites, particularly at the surface of the cathode, possibly take part to multiple redox reactions.51,53 However, their role and the modification of their relative abundance upon cycling (i.e. changes in the NiCo2O4 electronic structure) have not been clearly understood yet.
Another possibility, as reported for an iso-structured CoMn2O4, is to relate the catalytic effect to the presence
of oxygen vacancy in the crystallographic lattice, acting as strong adsorption sites for O2 and enabling the
lowering of the kinetic barriers both for the ORR and the OER.56
11 In Figure 4 is shown the unit cell of the spinel NiCo2O4 crystallographic structure in which Ni atoms
substitute Co3+ ions in octahedral sites. The synthesis procedure and its evolution could influence the
substitution grade. Therefore, a more general formula for the nickel cobaltite is Co2+1-xCo 3+ x[Co 3+ Ni2+xNi 3+ 1-x]O4 with 0 < x > 1. 53,57,58
Nevertheless, at the surface of the material, also a Ni substitution to Co2+ ions in tetrahedral sites has been proposed.59
The method of synthesis and its even minor modifications could influence the material nanomorphology. Thus, NiCo2O4 can be grown in the form of nanoparticles, nanoflakes, nanoflowers, nanowires, nanotubes,
nanoroads, nanosheets etc.60,61,62,63,64 The addition of a template agent in the synthesis solution has been reported to successfully enhance the porosity.65,66
Nanostructured NiCo2O4 cannot be used directly in electrochemical devices because is not a free-standing
material. In some cases, it has been mixed with carbon and polymer binders and pressed onto a current collector.61,62,65,66 In other experiments, its solution has been dropped on a carbon-based support.63 For application in chemical oxidative environment, where the use of carbon-based material has to be avoided, another possibility is the deposition on an inert base that has to be introduced in the NiCo2O4 synthesis
solution. In this last case, the nickel cobaltite usually grows in the form of nanowires whose diameter, length and porosity could be influenced by the support itself and other parameters such as the calcination temperature.52,54,67 Moreover, a shape evolution from nanowires to nanoplates has been demonstrated if the amount of the precursors is modified increasing the Ni/Co ratio.68
As regards the application of nanostructured NiCo2O4 as active cathode material for Li-O2 cells, some reports
exist about the suitable use of a Ni foam support50,69 with an “empty” structure, high surface area and macroporosity. Due to these features, Ni foam is able to ensure the deposition of large amount of cobaltite
12 and to maintain an abundant oxygen flow through the positive electrode. Thanks to its conductivity, it can act as current collector. Moreover, it demonstrates catalytic activity towards both the ORR and the OER.70
1.4. The possible use of a co-catalyst
A strategy to further enhance the electrochemical performance of a Li-O2 cell is referring to a synergistic
effect of a co-catalyst and the active material used as positive electrode. In the case of an heterogeneous catalysis, the co-catalyst has to be deposited on the cathode in a negligible amount, so also noble metals can be used.
Good results in terms of lowering the kinetic barriers of the ORR and/or the OER have been reported for Li-O2 cell with a cathode constituted by a noble-metal in the form of nanoparticles or films (i.e. Pt/Au, Pt, Pd,
Au, Ag) deposited on a carbon-based material.71,72,73,74
Unfortunately, these systems were still affected by the unavoidable carbon degradation. Recently, research efforts have been devoted to test these co-catalysts on inert materials such as noble (i.e. Au)75 or transition metals (i.e. Ni)36.
On the base of the portrait proposed in the previous paragraph, the obvious subsequent advancement is the tentative construction of a composed cathode made of noble metal nanoparticles onto a nanostructured mixed TMO grown on an open metal mesh. As an example, the synergistic co-catalytic effect between Pd nanoparticles and NiCo2O4 in the form of nanosheets has been demonstrated. However, in this case a reactive
13
CHAPTER 2
The PhD activity
2.1. Aims and surrounds of the PhD project
The scientific project of the PhD addressed in this work focused on chemical and electrochemical materials and processes involved in the operation of aprotic Li-O2 cells. The activity has been devoted to the design of
batteries working with different combinations of cathode materials and electrolyte solutions. Taking advantage of a multi-technique characterization approach, the main scope was to increase the knowledge on the reactivity at the triple O2/cathode/electrolyte interface of the cells. Moreover, at the beginning of the
second year of the PhD, the synthesis of new cathode materials showing enhanced electrochemical performance, made possible the assembly of Li-O2 cells with competitive discharge capacity, reversibility
and long-term life.
The supervision of the PhD activity has been performed by Dr. Andrea Giacomo Marrani at the Chemistry Department of La Sapienza, University of Rome. The work was based on an active collaboration with Dr. Sergio Brutti at the Sciences Department of the University of Basilicata.
Particularly, the materials synthesis was performed in the laboratories of both Universities. The cells assembly, the electrochemical tests and the materials characterization by means of Fourier Transform Infrared Spectroscopy (FTIR), Transmission Electron Microscopy (TEM) and X-ray Diffraction (XRD) were realized during periodical working visits at the University of Basilicata.
After the transfer to Rome, the samples were analyzed with X-ray Photoemission Spectroscopy (XPS) in the laboratory coordinated by Professor Robertino Zanoni. Some interesting electrodes were observed with the Scanning Electron Microscope with Field Emission source (FE-SEM) of the Centro di Ricerca per le
Nanotecnologie applicate all’Ingegneria della Sapienza (CNIS).
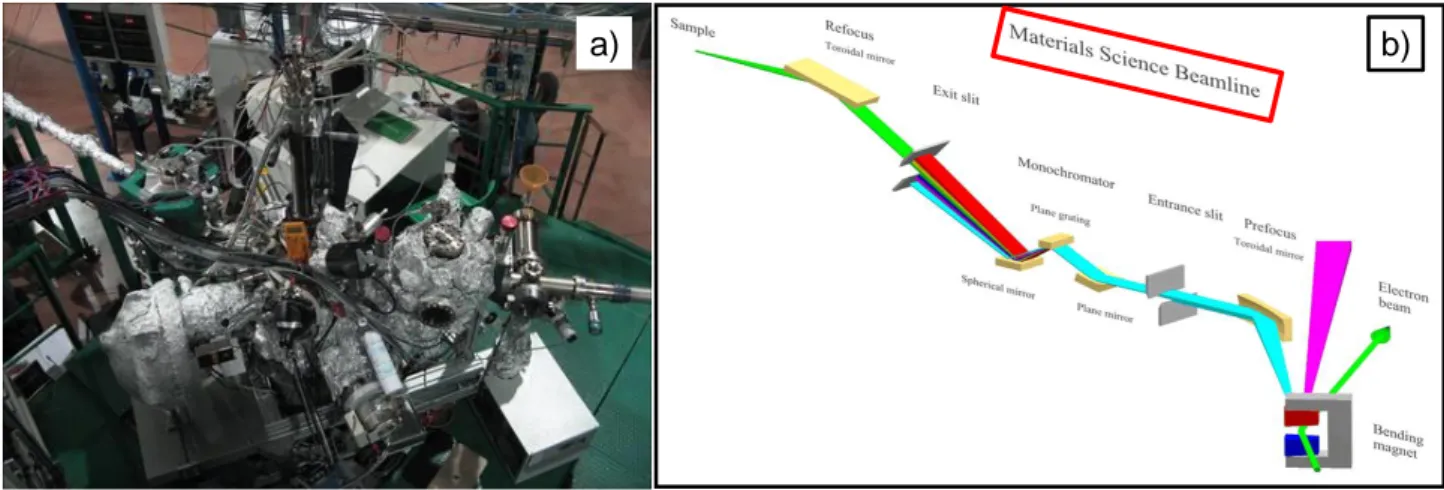
At the beginning of the third year, a session of photoemission (XPS and UPS) spectroscopy measurements was performed at the Materials Science beamline of the Elettra synchrotron laboratory in Trieste.
14 2.2. An overview of the PhD activity through the three years
The first year of the PhD activity was devoted to the study of the degradation phenomena affecting a carbon-based cathode in model Li-O2 cells. By means of electrochemical tests, spectroscopical and
microscopical analysis, the interaction between a porous carbon cathode and the electrolyte based on lithium bis(trifluoromethane sulfonyl) imide in tetraethylene glycol dimethyl ether (LiTFSI/TEGDME) was investigated. The goal was to demonstrate the peculiar influence of the TFSI- anion on the degradation processes of both TEGDME and carbon. Upon cycling, the accumulation of chemical oxidative by-products derived from the solvent and the cathode was identified as the major factor of the long-term efficiency loss of the cell.
At the beginning of the second year, the activity was turned to the search of a carbon-free cathode material inert to chemical oxidation, porous and possibly demonstrating catalytic activity for the cell reactions. As explained in paragraph 1.3, Li-O2 cells assembled with NiCo2O4 on Ni foam (NC@Ni) as cathode material
have been reported to show good electrochemical performance. So, the work started synthesizing this material by means of a hydrothermal method and testing it in combination with the LiTFSI/TEGDME electrolyte. Then, in order to increase the catalytic activity of the NC@Ni system, doping with TM ions was devised and achieved through an opportune modification of the synthetic procedure. The obtained Mn+-doped NiCo2O4 on Ni foam is referred to as NCM@Ni.
Due to the significantly higher discharge capacity and reversibility and lower overpotentials recorded both on discharge and charge for the Cr3+-doped and the Zn2+-doped NiCo2O4 on Ni foam (NCCr@Ni and
NCZn@Ni, respectively) compared to the pure NC@Ni, particular attention was devoted to the effect of these dopants on the electrochemical response of the doped electrodes. A full spectroscopical and morphological characterization was applied to the Ni-supported materials in parallel with the corresponding pure powders (NCCr and NCZn).
After the operation of the cells, selected cathodes were also analyzed ex-situ by means of XRD, XPS and SEM.
At the beginning of the third year, pristine NC@Ni, NCCr@Ni and NCZn@Ni electrodes, the corresponding powders and cathodes recuperated from cells that had worked in selected electrochemical conditions were measured at the Materials Science beamline of the Elettra synchrotron by means of XPS, in condition of enhanced resolution and sensibility.
The last months of activity were devoted to process the synchrotron data and formulate a complete portrait of the electrochemical and chemical properties of these materials.
Moreover, another step of the research was to investigate the possible co-catalytic activity of Pd nanoparticles (Pd NP) deposited onto the previously investigated NCCr@Ni material. The production of the Pd NP by pulsed laser ablation in liquid acetone (PLAL) in the fs regime, their deposition on the cobaltite
15 (which to the composed Pd/PdO@NCCr@Ni electrodes), the electrochemical tests and the XRD and TEM characterization of the materials were performed in collaboration with the research team of Dr. Angela De Bonis from the University of Basilicata, particularly with Dr. Antonio Gentile who based on this project his Master‟ degree thesis. Then, other investigations on pristine and post-mortem cathodes were performed by means of XPS and SEM in Rome.
16
CHAPTER 3
Instrumentation and techniques
3.1. Electrochemical characterization
All the electrochemical tests were performed on Li-O2 cells in two possible closed configuration, filled with
a fixed amount of pure O2 (5.0 purity), setting the static final pressure in the dead volume above the positive
electrode (about 3 cm3) to 1.0 bar. Theoretically, due to the absence of a continuous flow of oxygen, the cell could work until its amount was totally consumed. However, the cell death always preceded this event. The first configuration was that of an MTI Corporation cell type EQ-STC-LI-AIR (Figure 5 a). On the cell base, a stainless steel current collector, a lithium anode, a Whatman glass-fiber separator impregnated with 250 µL of a 1 m LiTFSI/TEGDME electrolyte solution and the porous cathode were set one on top of the other. The cell was closed with a cap equipped with a manometer in order to control the pressure value. The second type of cell was an EC-CELL type ECC-Air (Figure 5 b) in which the components were put in reverse order. On a metallic grid the cathode, a separator impregnated with the electrolyte, a lithium anode and a current collector were stacked and the cell, closed with a cup, was then blocked in a support.
The cells were assembled in an argon-filled glove-box with a moisture concentration below 0.1 ppm, in order to protect the components from the air exposition before the electrochemical tests.
As regards the different types of measurements, both for the carbon-based cells and the cobaltite-based ones, galvanostatic cycling was carried out, connecting them to a MTI Corp. battery cycler. In a first set of electrochemical tests, voltage cut-offs were imposed in discharge and/or in charge in order to investigate the discharge capacity supply, the reversibility and the overvoltages affecting the ORR and the OER. The ex-situ chemical characterization of the cathodes recuperated from cells stopped at various stage of their discharge and charge allowed to monitor the growth/dissolution of the discharge products (i.e. lithium oxides) and/or of the chemical oxidative by-products. In a second set of experiments, capacity limits were imposed, while the number of cycles was set to 100. This electrochemical procedure preserves the degradation of the cell components upon cycling, enabling to test the long-term performance.
In the case of the study on the NC@Ni, NCCr@Ni and NCZn@Ni materials, pseudo-Tafel plots at different temperature were also derived from intermitted galvanostatic titrations experiments performed at various current densities. From the comparison of the results at T=22 °C, the catalytic effect of the dopants on the
17 decrease of the ORR and the OER kinetic barriers was confirmed. Moreover, for each material, processing the data at two different temperatures allowed the evaluation of the ORR and the OER activation energies. For all the electrochemical tests, the imposed current densities and the measured capacities were normalized dividing by the geometrical area of the electrodes (1.54 cm2).
3.2. Materials characterization
The materials characterization was performed with a powerful multi-technique approach. The aim was to explore the chemistry, the morphology and the crystal structure of the samples combining surface- and bulk-sensitive techniques.
3.2.1. SEM and EDS
The pristine materials and a selection of post-mortem cathodes were observed by means of the Zeiss Auriga Scanning Electron Microscope (FE-SEM) at the Centro di Ricerca per le Nanotecnologie applicate
all’Ingegneria della Sapienza (CNIS). This instrument is equipped with a field emission source and a Bruker
Energy Dispersive X-ray Spectroscopy (EDS) probe. No samples preparation was required.
Changes in the morphology of the post-mortem carbon-based cathodes respect to the pristine were evaluated. In the case of the pristine cobaltite-based materials, SEM allowed to explore possible differences in the nanomorphology between the undoped NC@Ni and the doped NCCr@Ni and NCZn@Ni and between the supported materials and the corresponding powders NC, NCCr and NCZn. Also in this second study, SEM analysis was performed on post-mortem cathodes to evaluate the effect of the electrochemical operations. Finally, SEM images were recorded to complete the characterization of the Pd NP and the pristine Pd/PdO@NCCr@Ni electrode.
Figure 5. The a) MTI Corporation type EQ-STC-LI-AIR and the b) EC-CELL type ECC-Air Li-O2
18 EDS analysis was particularly useful to confirm the homogeneous dispersion of chromium and zinc onto the NiCo2O4 nanofibers and their incorporation as dopants. Moreover, in the case of the Pd/PdO@NCCr@Ni
sample, this instrumentation was used to assess the homogeneous coverage of the NiCo2O4 nanofibers by the
Pd NP.
3.2.2. TEM
TEM observations were recorded using a FEI Tecnai 200 kV cryo-TEM instrument equipped with a LaB6
electron beam source and two 2D flat cameras (low resolution and high resolution) at 200 kV e-beam acceleration. All the samples were suspended in THF in sealed vials by ultrasonic treatment (five cycles of 15 min of ultrasonic treatment followed by 45 min of rest to cool down the sample and thus avoid thermal heating), and dispersed on copper holey carbon film grids for observation.
In the case of the carbon-based electrodes, TEM images allowed to explore the morphological and structural changes of the carbon nanoparticles due to cell operations. Moreover, the reversible formation of lithium oxides and the overall accumulation of degradation products from carbon and solvent were observed. As regards the cobaltites, the pristine materials were observed by TEM to assess the absence of structural and morphological modification of the NiCo2O4 nanofibers due to doping. In this case and for the Pd NP
characterization, TEM pictures were analyzed using the ImageJ software.77 Indexing the electron diffraction patterns derived by selected areas Fast-Fourier-Transform (FFT) of the figures, it was possible to confirm the chemical nature of the materials.
3.2.3. FTIR spectroscopy
FTIR spectra of the carbon-based cathodes were acquired by a Jasco FTIR-460 Plus apparatus in the wave number range between 2000 and 400 cm−1 at room temperature in transmission mode. Materials removed from the cathodes and from a pristine carbon positive electrode, as fine powders, were mixed in an Ar-filled glovebox with CsI and then pressed in pellets by a Pike die set and handpress. FTIR spectra were also recorded for pure Li2O2, Li2O, and Li2CO3 powders as benchmark materials.
Infrared spectroscopy was useful to detect the discharge products (i.e. lithium oxides) and the by-products of the solvent TEGDME and the carbon cathode accumulated both on its surface and in its pores. In the transmission mode, the infrared rays cross the samples entirely allowing to gain information on the chemical composition both of their surface and bulk.
For the characterization of the pristine cobaltite-based positive electrodes, this technique was not applied due to the relatively “empty” structure of the samples in which low amount of active material is deposited on the Ni foam “open” framework. Infrared spectroscopy measurements were attempted on the cobaltites powders, but the spectra revealed not useful due to the predominance of signals related to samples hydration.
19 3.2.4. XRD
XRD experiments were carried out on the NC@Ni, NCCr@Ni and NCZn@Ni pristine electrodes and on the corresponding powders NC, NCCr and NCZn using a Siemens D5000 diffractometer equipped with a CuKα source and a graphite monochromator for the diffracted beam. X-ray diffraction was used to unequivocally identify the chemical nature of the materials detecting the characteristic reflections of their crystalline structure. The presence of phases different from NiCo2O4 spinel was also investigated.
Some XRD measurements were tentatively performed on post-mortem cathodes with the aim to detect crystalline discharge products (i.e. lithium oxides). Unfortunately, the amorphous nature of these materials and/or the low dimension of their crystalline domains prevented to confirm their nucleation on discharge and decomposition on charge by means of this technique for almost all the samples. This was probably related to the effect of the electrolyte solution (i.e. LiTFSI/TEGDME) on the Li2O2 growth mechanism and resulting
morphology (see Ch. 1, Par. 1.2). For the same reason, X-ray diffractograms were not recorded for carbon-based cathodes studied previously.
3.2.5. XPS
X-ray photoemission spectroscopy is one of the most powerful surface analysis techniques. It is sensitive to the first atomic layers of the samples and provides information about their elemental composition, the elements oxidation states and their chemical surroundings.
XPS measurements were performed on the NC@Ni, NCCr@Ni and NCZn@Ni pristine electrodes and on the corresponding powders NC, NCCr and NCZn to highlight the redox states of the transition metals and their relative abundance at the samples surface, eventually modified in the doped samples respect to the pure material. This information could help in the interpretation of the electrochemical performance of the undoped and doped cathodes. XPS analysis was also conducted on post-mortem cathodes to assess the reversible formation of lithium oxides and the factors related to the cell death.
In the study concerning the use of Pd NP as co-catalyst, XPS revealed particularly useful because it was the only technique able to shed light on the real nature of the Pd deposits.
For all the samples, XP spectra were recorded using a modified Omicron Nano-Technology MXPS system equipped with a monochromatic X-ray source (Omicron XM-1000) and an Omicron EA-127 energy analyzer (Figure 6 a).
20 The exciting radiation was Al Kα (hυ = 1486.7 eV), generated operating the anode at 14−15 kV and 10−20 mA. All of the photoionization regions were acquired using an analyzer pass energy of 20 eV, except for the survey scan, taken at 50 eV pass energy. Take-off angles of 11° with respect to the sample surface normal were adopted. The measurements were performed at room temperature, and the base pressure in the analyzer chamber was about 2 × 10⁻⁹ mbar. Samples extracted from the cells after the electrochemical tests were transferred into the spectrometer through an argon-filled glove-bag connected to the fast-entry lock chamber of the instrument to avoid contact with air (Figure 6 b). Sample degradation due to X-ray exposure was not evident within the duration time of each experimental observation. On the basis of appropriate criteria, for the different samples internal standard references were selected for the construction of a Binding Energy (BE) scale (accuracy of ±0.05 eV).
The experimental spectra were reconstructed by fitting the secondary electrons‟ background to a Shirley function and the elastic peaks to pseudo-Voigt functions described by a common set of parameters (position, fwhm and Gaussian−Lorentzian ratio) free to vary within narrow limits. During the fitting procedure the Gaussian−Lorentzian ratio was left free to vary between 0.6 and 0.9. XPS atomic ratios between relevant element components were estimated from experimentally determined area ratios (with ±10% associated error), which were corrected for the corresponding photoelectron cross sections according to Scofield calculations and for the square root dependence of the photoelectron kinetic energy. The softwares ESCA300 and XP Spectral Data Processor were used for the spectra reconstruction and the atomic relative quantification, respectively.
3.2.6. XPS measurements with synchrotron radiation
Unfortunately, use of the lab XPS instrument to study NC@Ni, NCCr@Ni and NCZn@Ni pristine electrodes proved nearly inefficient to perform the relative surface quantification of the metal components. In
Monocromatic Al Kα source Emispherical analyzer Analysis chamber Fast-entry chamber
a) b)
Figure 6. a) The spectrophotometer used for the XPS measurements addressed in this work; b) the XPS fast-entry lock chamber with connected an argon-filled glove-bag to avoid the contact of the samples with air before measurements.
21 fact, due to the low signal-to-noise (S/N) ratio only a tentative curve fitting reconstruction of the Ni 2p, Co 2p, Cr 2p and Zn 2p photoemission regions was attempted. Moreover, the determination of the atomic ratios (i.e. Ni/Co etc.) was compromised by the contribute to the signal intensity in the Ni 2p photoemission region of the underlying Ni mesh. So, a proposal was submitted to the Elettra synchrotron facility to acquired spectra in condition of higher energy resolution and sensibility.
XPS measurements were performed at the Materials Science beamline on pristine NC@Ni, NCCr@Ni and NCZn@Ni electrodes, on the corresponding NC, NCCr and NCZn powders and on post-mortem cathodes from Li-O2 cells that had operated in various electrochemical conditions.
Materials Science is a beamline suitable for experiments in materials science, surface physics, catalysts and organic molecules on various surfaces. The tunability of the photon energy ranges from 22 to 1000 eV with mainly linearly polarized light from a bending magnet source and tunable excitation energy for the best photoionization cross sections. The spot size on the sample has a diameter of ~100 μm. Photoelectrons from the sample are analyzed by hemispherical electron energy analyzer. In Figure 7 a and 7 b a photograph of the spectrophotometer at Materials Science and a scheme of the beamline are shown, respectively.
The resolving power is naturally better at lower energies, allowing the photon flux to be further increased by opening both the entrance and exit slit wider than the typical values (100 μm for entrance and 200 μm for exit slit). In this case the resolving power is still higher than 1000 and photon energy resolution below 100 meV. In Figure 8 the experimental flux curve for a storage ring energy of 2.0 GeV normalized to 300 mA ring current is shown. The data are collected from a photodiode inserted at the end of the beamline with the entrance slit open to 100 μm and exit slit to 250 μm (typical setting). Below 50 eV the flux can be increased by factor of 10 by opening the slits without significant impact to energy resolution.
a) b)
22 During the measurements upon the cobaltite-based samples addressed in this work, the exciting radiation was varied choosing the best for all the acquired photoemission regions. The criteria adopted refers to the general rule that a photoemission cross section is greater if the used excitation energy is similar to the energy of the corresponding ionized orbital. The experiments were performed at room temperature and the base pressure in the analyzer chamber was about 2 × 10⁻⁹ mbar. Post-mortem cathodes were transferred to Elettra in sealed vials and inserted into the spectrometer through an argon-filled glove-bag connected to the fast-entry lock chamber of the instrument to avoid contact with air. Sample degradation due to X-ray exposure was not evident within the duration time of each experimental observation.
The data processing was performed by means of the software KolXPD. First of all, a calibration of the photon energy was applied referring to the Au 4f photoemission line as standard.
As regards the fitting procedure, the experimental spectra were reconstructed by fitting the secondary electrons‟ background to a Shirley function and the elastic peaks to Voigt functions described by a common set of parameters (position, amplitude, Gaussian and Lorentzian fwhm) free to vary within narrow limits. XPS atomic ratios between relevant element components were estimated from experimentally determined area ratios (with ±10% associated error), which were corrected for the corresponding photoelectron cross sections derived from literature, reported in the Elettra website and stored in the KolXPD memory.
Figure 8. The experimental flux curve at Materials Science for a storage ring energy of 2.0 GeV normalized to 300 mA ring current.
23
CHAPTER 4
Study on a carbon-based cathode
4.1. Aims
The PhD activity started studying model Li-O2 cells assembled with a porous carbon cathode in combination
with LiTFSI/TEGDME as electrolyte solution.19 The goal was to describe the reactivity at the triple interface O2/cathode/electrolyte where the electrochemical and chemical reactions occur. On discharge, both the
carbon-based cathodes and the ethereal solvents used in Li-O2 cells are known to undergo degradation due to
the chemical oxidative attacks mediated by the oxygen reduced species.29–32 Gaining major insights in these processes competing with the Li2O2 reversible formation by means of the ORR/OER is fundamental for
identifying mitigation strategies to improve cell efficiency upon cycling. Particularly, an evaluation of the peculiar interaction between the cathode material and the electrolyte could be useful. In fact, in this work great attention was given to the TFSI- anion influence on the chemical nature of the cathode degradation products.
4.2. Samples preparation and cells assembly
As described in chapter 3, paragraph 3.1, Li-O2 cells and electrolyte solutions were prepared in an Iteco
Engineering argon-filled glovebox with moisture concentration below 0.1 ppm. In the case of the study on carbon-based cathodes, the batteries were assembled by using a MTI Corporation cell type EQ-STC-LI-AIR MTI Corp. (Figure 5 a) consisting of a stainless steel current collector, a metallic lithium foil as anode, a glass-fiber separator (Whatman, 18 mm in diameter) impregnated with 250 μL of a 1 m electrolyte solution, and a commercial porous carbon foil (MTI Corp., 14 mm in diameter) as cathode. The positive electrode was constituted of a mixture of Super P carbon and a fluorinated polymeric binder (Kynar, Arkema) dispersed on an inert carbonaceous gas diffusion layer. The ratio between carbon Super P and the binder was 38:62 w/w. This average percentage was systematically obtained measuring the weight of carbon remaining after vigorously washing with tetrahydrofuran (THF) and treating in an ultrasound bath of some pristine electrodes to completely remove the binder. The exact composition of this fluorinated polymer is not known but it is probably a co-polymer of polyvinylidene fluoride (PVDF) and hexafluoropropene (HFP). The salt
24 and the porous cathodes were dried at 110 °C overnight under vacuum before use. The solvent was used after drying/storage on regenerated 3 Å molecular sieves (Sigma-Aldrich) and lithium chips for at least 15 days in a glovebox. Li−O2 cells were filled with pure O2 (5.0 purity spilled from a high-pressure cylinder through
stainless steel gas lines, preliminarily evacuated, equipped with a molecular sieve-filled moisture trap), setting a static final pressure of 2.2 bar in the dead volume (about 3 cm3) above the porous electrode.
In a first set of electrochemical tests, galvanostatic cycling of the cell was carried out, connecting to a MTI Corp. battery cycler, setting to a single cycle with a current density of 0.2 mA cm−2 and stopping at cut-off voltages of 2.6, 2.5, and 2.0 V in discharge and 4.0 and 4.6 V in charge. The measured capacity was normalized dividing by the geometrical area of Super P carbon electrode (1.54 cm2). The reversibility was calculated as the ratio between the capacities measured on charge and on discharge. A second type of experiments were devoted to test the long-term performance, so galvanostatic cycling were carried out imposing capacity limits of 0.2 and 0.4 mA h cm−2 and current density values of 0.2 and 0.4 mA cm−2, while the number of cycles was set to 100.
After the electrochemical measurements, the cells were disassembled in glovebox. Their cathodes were recuperated and washed in TEGDME and in THF to remove the excess electrolyte, and dried under vacuum at room temperature prior to the chemical characterization.
A pristine carbon foil and a carbon foil wet with electrolyte were considered as benchmarks samples.
4.3. Electrochemical tests
4.3.1. Voltage limited performance on one cycle
Electrochemical discharge and discharge/charge tests were carried out under galvanostatic control at a constant current rate of 0.2 mA cm−2 with fixed voltage cut-offs. An example of the measured cell voltage profile is shown in Figure 9 for a cell fully cycled between 2.0 and 4.6 V. The corresponding performance in terms of specific capacity and charge reversibility are summarized in Table 1.
Figure 9. Galvanostatic cycle between 2.0 and 4.6 V of a carbon-cathode based cell. Cathodic and anodic cut-off voltages for partially discharged and charged cells are marked with black dots. Applied current density was 0.2 mA cm-2.
25 The profile of the galvanostatic curve resembles that reported in literature for similar systems (see Figure 1).1 On discharge (Figure 9, blue curve), we observe a stable plateau at about 2.6 V, below the thermodynamically estimated potential for the ORR (3.1 V), thus suggesting the occurrence of moderate overvoltages. This feature is due to the partial insulating character of both the main discharge product Li2O2
and the eventually formed chemical degradation by-products from the carbon electrode and the TEGDME solvent. As expected, upon discharge the specific capacity increases for deeper reductions (see Table 1). On charge, a short plateau at about 3.3 V and a long plateau at about 4.4 V are visible. These charge plateaus are related to the OER from an oxygen-rich species (i.e. a layer “LiO2 –like” covering the Li2O2 particles)
and from the bulk of lithium peroxide particles, respectively.14,15 Also on charge, due to the partial insulating character of both lithium peroxide and degradation by-products, overvoltages are registered. In fact, the two plateaus are above the thermodynamically estimated potential for the OER.1 The total capacity increases at high anodic voltage cut-offs, reaching an overall charge reversibility of 1 for the cell fully cycled between 2.0 and 4.6 V (see Table 1) .
Sample Galvanostatic condition (J = 0.2 mA cm-2) Discharge capacity (mAh cm-2) Charge capacity (mAh cm-2) Reversibility D. 2.6 V discharge to 2.6 V 0.99 ± 0.15 D. 2.5 V discharge to 2.5 V 2.21 ± 0.33 D. 2.0 V discharge to 2.0 V 2.99 ± 0.45 C. 4.0 V discharge to 2.0 V and charge to 4.0 V 2.99 ± 0.45 1.37 ± 0.21 0.46 ± 0.07 C. 4.6 V discharge to 2.0 V and charge to 4.6 V 2.99 ± 0.45 2.97 ± 0.44 0.99 ± 0.07 Table 1. Summary of the carbon-based cells studied on one galvanostatic discharge-charge cycle and corresponding performance. The reversibility has been calculated as the ratio between the charge and the corresponding discharge capacity.
4.3.2. Long-term performance
Long-term tests for the carbon-based cells were carried out performing their galvanostatic cycling at two different values of limited capacity and current densities, while the number of cycles was set to 100.
The resulting electrochemical performance are shown in Figure 10 in terms of specific capacity and charge reversibility versus cycle number. The samples and their corresponding cycle of death are summarized in Table 2.
26 Upon cycling the performance of the carbon-based cells addressed in this work were comparable with those reported in the available literature for similar configurations.31
At a current rate as large as 0.2 mA cm−2,a target capacity limitation of 0.2 mA h cm−2 (Figure 10 a) was successfully reached for more than 70 cycles, both in discharge and charge. In contrast, at higher rates, that is 0.4 mA cm−2, the cell suddenly failed to supply the programmed maximum capacity. As reported in Figure 11 a, this was due to the increase of both the charge and discharge overvoltages at increasing current rates.78 A similar trend is observed if the discharge/charge capacity limitation is doubled. In fact, at the same current rate, that is, 0.2 mA cm−2, identical cells reached the capacity limitation of 0.2 and 0.4 mA h cm−2 (Figure 10 c), both in discharge and charge for 71 and 26 cycles, respectively.
As regards the reversibility trends, at 0.2 mA cm−2 this parameter dropped below 1 after cycle 71 whereas at 0.4 mA cm−2 it was always smaller than unity (Figure 10 b). In the former case, the high charge reversibility recorded up to the 71st cycle is explained considering that the imposed capacity limit (0.2 mAh cm−2) amounts to less than the 10% of the total discharge capacity of the cell when neither capacity nor voltage limits are imposed (see Figure 9). For what concerns the cell cycled at 0.2 mA cm−2 but with a doubled capacity limitation of 0.4 mAh cm−2, the charge reversibility falls below 1 after cycle 26 (Figure 10 d). In this type of cell configuration a charge reversibility smaller than 1 has mainly to be related to the increase of charge overvoltages upon cycling (Figure 11 b). Despite the reversibility approaching 1, it is worth noting that this trend occurred even for the cell cycled at 0.2 mA cm−2. So, in these systems even working in not “stressful” conditions leads to an accumulation of insoluble and not fully redox-reversible reaction products or degradation byproducts over the positive electrode surface. This is the cause to an increase of the overall electrode resistance and to large overvoltages.
Figure 10. Cell performance upon cycling: (a,c) specific capacity and (b,d) charge reversibility (see text for more details).
27
Sample Galvanostatic condition Cycle of cell
death 100 cycles 100 cycles at 0.4 mA h cm−2 limited capacity, end state in charge,
J = 0.2 mA cm-2
26 100 cycles (II) 100 cycles at 0.2 mA h cm−2 limited capacity, end state in charge,
J = 0.2 mA cm-2
72 100 cycles (III) 100 cycles at 0.2 mA h cm−2 limited capacity, end state in charge,
J = 0.4 mA cm-2
1 Table 2. Summary of the long-term tests and corresponding cycle of death of the carbon-based cells addressed in this work.
4.4. Chemical characterization
4.4.1. TEM
By means of transmission electron microscopy images, we observed the morphological change of the active carbon material due to operation in the cells. Particularly, the results of TEM measurements on cathodes recuperated from cells stopped at various stages of one discharge-charge cycle are shown in Figure 12 b-d. For comparison, an image of the pristine carbon Super P material is also shown (Figure 12 a). The preparation of the samples and other experimental details have been described in chapter 3, paragraph 3.2.2. As expected, commercial Super P carbon is constituted by round-shaped nanoparticles with a diameter of 20−30 nm (Figure 12 a). Upon discharge, even at the high cut-off voltage of 2.6 V, a discontinuous polymer-like matrix appears and surrounds the carbon particles. This gelatinous deposit may be constituted by organic degradation by-products. Moreover, additional irregular and smaller nanoparticles with a diameter of 5−10
a) b)
Figure 11. a) Comparison between the carbon-based cell voltage profiles (cycle 50) at 0.2 and 0.4 mAh cm-2;
28 nm are visible. In the inset of the Figure 12 b, a tentative indexing of the partial FFT of the selected area is shown, attesting that these deposits may be constituted by Li2O2.
In fact, the interplanar distance found at 8 Å may be due to the reflection of the (001) plane of the peroxide lattice, to be compared to d(002) = 3.55 Å79 for the layer stacking in graphitic carbons.
At the end of discharge (i.e. 2.0 V, see Figure 12 c), the original carbon particles are almost invisible due to an almost complete coverage by the amorphous matrix. However, after a complete cycle of discharge and charge (i.e. at 4.6 V, see Figure 12 d), the carbon particles recuperate their original round-shaped morphology. Moreover, no other deposits can be observed, suggesting a complete decomposition of the lithium peroxide and the degradation compounds by means of the OER and other competitive electrochemical oxidative processes, respectively. Particularly, carbonaceous degradation compounds could be removed from the cathodes by means of an oxidation to carbon dioxide.1
A TEM image of materials from the cathode extracted from the cell set to 100 cycles at J = 0.2 mA cm-2 limiting the capacity at 0.4 mAh cm-2 and died after the 26th cycle (see Table 2) is shown in Figure 13 b. For comparison another image of the carbon particles from the pristine electrode is shown in Figure 13 a.
The presence of diffuse smooth amorphous-like layers (thickness <10 nm) grown upon cycling over the carbon nanoparticles can be clearly observed. This evidence suggests that the observed removal of the degradation products from the cathode surface on one cycle is not ensured upon cycling, even at the high
Figure 12. TEM images of materials from the carbon-based cathodes: (a) pristine; (b) sample discharged to 2.6 V; (c) sample discharged to 2.0 V; (d) sample discharged to 2.0 V and charged to 4.6 V. In the inset of Figure 12 b the calculated fast-Fourier transform (FFT) of the selected area and its tentative indexing are shown.
29
a)
b)
charge voltage of 4.6 V. Due to their insulating character, the accumulation of these by-products has to be considered as one of the main reasons for the rise of the overvoltage and the cell death.
4.4.2. FTIR spectroscopy
The ex-situ FTIR spectra of the discharged and charged cathodes on one cycle (see Table 1) are shown in Figure 14 e-i. The intensity of these spectra was normalized to the intensity at 1100 cm−1, corresponding to the most intense absorption peak of TEGDME.80 The reference spectra of a pristine carbon electrode and pure Li2O, Li2O2, and Li2CO3 powders are also shown in Figure 14 a-d.
Both in the reference spectra for lithium oxide and lithium peroxide a broad band in the 400−600 cm−1 region is visible (Figure 14 a and b), related to the Li−O bond stretching.81–87 Li2CO3 also gives a minor signal in
this region (Figure 14 c), but its FTIR fingerprint bands are at about 860, 1440, and 1507 cm−1. The first band is for the O=C−O bending mode, while the others are for its stretching vibrations.84–86,88,89
In the spectrum for the pristine cathode (Figure 14 d), an intense and broad band with maximum at 1020 cm−1 can be observed, possibly associated with the stretching mode of superficial oxidized groups of the carbon support, such as C−O−C and C=O.90,91 At lower wavenumbers minor signals from the fluorinated binder vibrations are visible.92,93
Figure 13. TEM images of materials from the carbon-based cathodes: (a) pristine; (b) from the cell cycled between 2.0 V and 4.6 V at J = 0.2 mA cm-2 limiting the capacity at 0.4 mAh cm-2. The cell died after the 26th cycle.
30 Upon discharge, between 400 and 600 cm−1 region, where the stretching of Li−O bond is expected, a broad band increases, remains almost equal on charge to 4.0 V and disappears at 4.6 V (Figure 14 e−i). This trend may confirm the overall accumulation of oxidized lithium compounds upon discharge and their removal charging at high overvoltage.
On discharge (Figure 14 e−g), according to the growth of a polymer matrix possible made of degradation products observed by TEM, even at the high voltage of 2.6 V, signals increase in the spectral ranges for the C−O and C=O stretching mode. These peaks can be related to the accumulation of carbonates and alkylcarbonates (C−O and C=O symmetric stretching at 1020−1300 cm−1, C−O and C=O asymmetric stretching at 1400−1660 cm−1)81,82,84–86,89 and carboxylates (C=O symmetric stretching at 1500−1660 cm−1).81,82 However, the lack of bands in the 1700−1800 cm−1 region, where the asymmetrical stretching of C=O carboxylates groups is expected,87,94 suggests the presence of these species only in the outermost layers of the samples.
As remembered in chapter 3, paragraph 3.2.3, unlike a surface-sensitive technique such as XPS, FTIR in transmission mode allows detection of compounds, such as inorganic Li2CO3, grown in the inner regions of
Figure 14. FTIR spectra of Li2O, Li2O2, and Li2CO3 pure powders (spectra a−c),
and of materials from pristine (spectrum d), discharged (spectra e−g), and cycled (spectra h and i) carbon-based electrodes addressed in this work.
31 the samples. Thus, it is worth noting the apparent lack of any fingerprint for this last compound both in discharge and charge. This evidence suggests a peculiar degradation reactivity of the carbon electrodes in presence of the LiTFSI salt compared to that reported for other configurations.37
As shown in Figure 14 h and i, on charge the FTIR spectra demonstrate the permanence of carbonates and alkylcarbonates on the cathode charged to 4.0 V, whereas the same spectral features are completely absent when the cut-off voltage is increased to 4.6 V. These results are compatible with the recovery of the pristine morphology shown by TEM images at high overvoltage (Figure 12 d), and could be associated with oxidative removal of carbonaceous deposits.
4.4.3. XPS
Cathodes extracted from the cell stopped at different cut-off voltages of the first discharge−charge cycle (see Table 1) and from the battery set to 100 cycles at J = 0.2 mA cm-2 limiting the capacity at 0.4 mAh cm-2 (see Table 2, sample “100 cycles”, died after 26 cycles) were analyzed ex-situ by means of X-ray photoelectron spectroscopy to investigate their surface composition. To facilitate the interpretation of these spectra, a pristine carbon electrode and a carbon electrode impregnated with the electrolyte (i.e. “uncycled” sample) were considered as benchmark materials. In chapter 3, paragraph 3.2.5, XPS experimental details have been described. In the case of the XPS analysis of the carbon-based electrodes, the C 1s BE of the −CF2− group at
292.0 eV belonging to the fluorinated polymer binder95 of the pristine carbon electrode was used as an internal standard reference for the BE scale (accuracy of ±0.05 eV). The reason for this choice is explained in the results discussion. During the curve fitting procedure, the asymmetry was fixed to 0.0 for all the peaks except for the graphitic-like carbon peak in the C 1s region, for which it was set to 0.15.96
Photoemission regions on one cycle
In Figure 15 the C 1s photoionization regions of the samples extracted from the cell stopped at different cut-off voltages of the first discharge−charge cycle are shown.
For the pristine carbon support (Figure 15 a) we observe the typical contributions from a lowly ordered graphitic carbon material, whose main feature is the graphitic sp2-hybridized C signal at 284.3 eV, slightly asymmetric at its high BE side.96,97 The subsequent peak is attributable to defects that are mainly sp3 -hybridized C sites.98 Considering all the spectra in Figure 15 a-g, its BE shift with respect to graphitic carbon was found to vary within the range +1.0 to +1.3 eV. At 286.7 eV a contribution from oxidized graphite (i.e. superficial epoxy and C=O groups)98,99 can be found. The broad shake-up transition visible at 289.3 eV is typical of extended π-delocalized carbonaceous systems and accounts for 10% of the main feature intensity.98 At 292.0 eV, there is a peak associated with the −CF2− groups of the fluorinated binder.
95
As previously mentioned, this signal was chosen as an internal reference for the BE scale. In fact, as evident in Figure 15, a BE position shift is experienced by some components (see green and black lines), as in the presence of a differential surface charging, apparently dependent on the working conditions of the cell. The −CF2−
32 component was adopted as a reference for BE scale because it is associated with one of the constituents of the carbon cathode material. This aspect will be clarified later.
In Figure 15 b, for the uncycled cathode, the peaks associated with the carbon support are hardly detectable since its surface was probably covered by a layer of electrolyte. Indeed, the additional features at 287.3 and 293.4 eV are associated with ethereal C−O bonds in physisorbed TEGDME82,99 and with −CF3 groups in
TFSI- anion,100,101 respectively. These signals are significantly reduced compared to those from carbon in the spectra of discharged and cycled cathodes (Figure 15 c−g) because the electrodes were rinsed with pure solvents after cycling.
Figure 15 c shows the effects of discharging the cell to 2.6 V. Signals similar to those for the pristine (Figure 15 a) can be identified, although with different relative intensities. However, a striking difference is the inversion of the relative intensities of the graphite-like carbon signal (see the black line in Figure 15) and the defect related peak (see the magenta line in Figure 15). In this case, a stronger enhancement is observed respect to that for previous studied carbon-based systems.37 We speculated that on discharge, because of the low DN of the solvent and the TFSI− anion,1,18,26 a thick layer of lithium oxides was deposited on the surface of the carbon foil. This thick precipitate may lead to the attenuation of outcoming photoelectrons and
Figure 15. C 1s XP spectra of pristine and uncycled (black lines, spectra a and b), discharged (blue lines, spectra c−e), and cycled (red lines, spectra f and g) carbon cathodes. The positions of some peaks and their possible shifts are marked with colored lines.
33 contributed to the structural damage of the graphite C=C network. In presence of different Li salts, such as lithium triflate, (LiSO3CF3, i.e. LiTFO), the enhancement of such component has been reported to increase
remarkably only when the discharge potential drops to 2.0 V.37 Therefore, we evaluated that the use of LiTFSI had a more dramatic impact on the degradation of the carbon cathode. The predominance of the defects-related feature over the graphitic one is constant throughout the discharged samples (spectra c−e). On the other hand, such a feature is still present even in the sample charged to 4.0 V (spectrum f), whereas it is completely recovered to its pristine intensity in the sample charged to 4.6 V (spectrum g).We hypothesized that this behavior, similar to that found in the presence of LiTFO37 and confirmed by other observations, can be explained referring to a partial decomposition, upon deep charging, of both lithium oxides and oxidized carbon by-products, both contributing to the elimination of the defects-related component by CO2 release.
1
Signals associated with carboxylate and carbonate groups82,99–103 are present at 288.5 and 289.5 eV, respectively, in spectra c−f. Their presence calls for the occurrence of degradation phenomena related to the carbon cathode and the TEGDME solvent, possibly due to the exposition to Li2O2 particles.
39
It is worth noting that, in the presence of the LiTFSI salt, carboxylates were not found to behave as an intermediate step to the formation of carbonates, as reported in presence of other salts such as LITFO.37 In fact, the variable relative intensity ratio of the two contributions throughout the spectra from discharged samples reveals that the two oxidized carbon moieties are not part of the same reaction path, but have different origins.
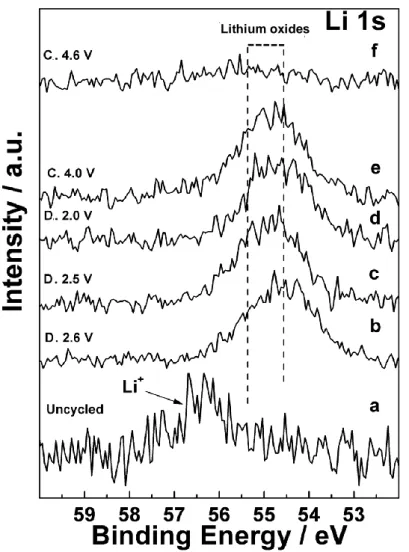
As to the presence of Li2CO3, that could nucleate on the cathode surface and in its pores due to the oxidant
attacks from Li2O2 particles to the underlying carbon support, 1,104
it is not possible to discern whether the peak at 289.4 eV can be assigned to this compound or to variably substituted organic carbonates. As discussed later, the Li2CO3 fingerprint is also missing in Li 1s spectra, and its absence is in agreement with
the corresponding FTIR spectra (see paragraph 4.4.2).
Charging the cell to 4.0 V (Figure 15 f) just few modifications respect to the discharged samples can be observed. In fact, oxidative degradation products (carboxylates, carbonates) are still present on the cathode surface, while defects of the graphitic network are only partly removed (see the magenta line in Figure 15). As evidenced adopting other lithium salts such as LiTFO,37 in the first discharge/charge cycle of the cell, only an extreme charging up to 4.6 V can restore the original structure of the carbon cathode. In fact, at 4.6 V we observed a recovery of the original degree of defectiveness parallel to the abatement of oxidized carbon features (spectrum g).
As mentioned above, with reference to the −CF2− position (red line), a negative BE shift of 0.8 eV is
experienced by the graphite-like (black line), defects (magenta line), and TEGDME (green line) peaks of spectra from the discharged and 4.0 V charged samples. On the other hand, according to the proposed energy calibration, the position of carbonates peak (blue line) is coherent with the literature.
Similar BE shifts have been reported by Edström et al. for signals associated with the solid electrolyte interphase (SEI) and bulk materials of Li-ion cells anodes.105 The nature of such shift is not apparently chemical, and since it is found to be dependent on the presence of carboxylates/carbonates species, it may be related to changes in the state of charge at the electrode‟s surface. Edström et al.105 explained a similar