UNIVERSITY
OF TRENTO
DIPARTIMENTO DI INGEGNERIA E SCIENZA DELL’INFORMAZIONE
38123 Povo – Trento (Italy), Via Sommarive 14
http://www.disi.unitn.it
AN INVESTIGATION ON UWB-MIMO COMMUNICATION
SYSTEMS BASED ON AN EXPERIMENTAL CHANNEL
CHARACTERIZATION
M. D. Migliore, D. Pinchera, A. Massa, R. Azaro, F. Schettino, and L.
Lizzi
January 2011
1
An Investigation on UWB-MIMO Communication Systems based on an Experimental Channel
Characterization
M.D. Migliore, D. Pinchera, A. Massa, R. Azaro, F. Schettino, and L. Lizzi
Abstract—The advantages of MIMO technology in UWB communication systems are investigated evaluating the channel capacity
from measurements taken in indoor environments. The results suggest that in practical instances spatial diversity is more attractive than spatial multiplexing for UWB systems.
Index Terms—MIMO, UWB, Spatial multiplexing gain, Spatial diversity gain . I. INTRODUCTION
Recently, there has been a growing scientific and industrial interest toward the Multiple Input Multiple Output (MIMO) technology. The possibility to increase the bit rate without using additional spectral resources is pushing the introduction of such a technology in many wireless standards, like IEEE 802.11 and IEEE 802.16. Due to the many advantages of MIMO systems, it seems natural to consider the introduction of multiple antennas technologies also in the IEEE 802.15 standard [1]-[3]. However, UWB technology has some peculiar characteristics, making not easy the understanding of the performances of a MIMO approach for this technology.
In order to clarify this point, let us consider the MIMO-UWB communication system from the point of view of information theory [4]. In the classic geometrical approach, the signal is a point in the signal space, whose dimension is equal to the number of Degrees of Freedom (DoF) of the signal. The available signal energy is distributed along the dimensions of the signal space, so that there is a trade-off between the energy per signal space dimension (or equivalently per degree of freedom) and the number of dimensions. This gives two basic mechanisms that limit the channel capacity of wireless systems. In the case of high signal energy compared to the noise energy (e.g., with high SNR), the limitation is due to the number of dimensions of the signal space (e.g., the system works in the “degree-of-freedom limited” region). In the case of low signal energy compared to the noise energy (e.g., in the case of low SNR), the limitation is due to the energy and the system works in the “power limited” region. In the first case, an increasing of the dimensions of the signal space gives an almost linear increase of the channel capacity, while an increasing of the available power gives only a logarithmic increasing. In the second case, an increasing of the available power gives an almost linear increasing of the channel capacity, while an increasing of the dimensions of the signal space does not give advantages.
Coming back to the wide band systems, UWB reaches very high bit rates spreading the available power on an extremely large number of DoF of the temporal signal. In fact, the number of dimensions of the signal space per unit time in UWB systems is some order of magnitude larger than Wi-Fi or Wi-Max signal space.
MIMO systems encode information both in spatial and temporal variations of the signal [5], but the maximization of the transfer rate is realized according to different approaches depending on the particular realization of the channel matrix and on the SNR. In particular, in the so called “spatial multiplexing” mode, MIMO systems increase the bit rate enlarging the dimension of the signal space by using the (spatial) number of degrees of freedom of the electromagnetic field [5]. In practice, the available DoF of the field are used to send independent information, obtaining a “spatial multiplexing gain” [6].
In the case of low SNR, MIMO systems take advantage of the spatial diversity offered by the use of multiple antennas. If the channel is known to both the transmitter and the receiver (the so called “Channel State Information” or CSI case), spatial diversity can be extracted through the Dominant Eingenmode Transmission Technique (DETT) [6]. The same information is transmitted from all the antennas and elaborated to use the “best sub-channel” among the receiving and transmitting antennas. In this approach, MIMO systems do not increase the signal space dimension, avoiding to further decrease the energy per degree of freedom of the signal. Instead, the solution maximizes the SNR, obtaining a power gain. The DETT is used to obtain diversity gain in fading communication channels with CSI. It is useful to note that while DETT can be used also at high SNR, obtaining an increasing of the reliability of the transmission accepting a lower throughput of the communication system, the use of multiplexing gain at low SNR must be avoided since it decreases both the throughput and the reliability of the communication.
The understanding of the way of working of a MIMO system is not only a theoretical interesting result, but has also practical technical relevance, since the design of MIMO systems that implement spatial multiplexing or spatial diversity is different.
The above discussion clearly points out that the analysis of the improvements using MIMO technology in UWB system is not straightforward. In particular, the importance of the signal level compared to the noise level (and, in presence of interferences, also to the interference level) makes fundamental the measurement of MIMO channels in true environments.
In this communication, the analysis of the improvement achievable using MIMO technology on UWB system is investigated on the basis of measured MIMO channels in indoor environments. The performance is analyzed varying the SNR, and using the channel capacity as a figure of merit of the system. The channel capacity of a wideband channel is evaluated by dividing the entire available bandwidth in a large number of frequency bins, each of them having bandwidth narrower than the coherence bandwidth. However, it must be pointed out that the capacity calculated in this paper is slightly different from the classic channel capacity. In fact, channel capacity is usually evaluated considering a constraint on the total average transmitted power.
Instead, the channel capacity is evaluated in this paper considering a constraint on the average transmitted power on each
frequency bin according to the spectral density power restriction of the UWB systems. This quantity will be called channel
capacity, but it is understood that it is evaluated with a different constraint compared to the usual channel capacity limited by the total power. Note that the use of classic total average power constraint would give higher channel capacity, that however would not be compatible with the UWB standard, as discussed above.
As last observation, in the paper the term “channel capacity” will be used also considering other communication strategies (MIMO without waterfilling, maximum SNR, “opportunistic communication”). Strictly speaking, the use of the term “channel capacity” is not rigorous in these cases, and it is used in the meaning of the “supremum of the bit rate with vanishing error probability” under the considered constraints.
II. EXPERIMENTAL RESULTS
Measurements of the channel matrix were performed in an indoor environment represented by a room of the Microwave Laboratory at the University of Cassino. The dimension of the room was about 4 m x 6 m x 3.5 m. Three metallic tables and other dielectric and metallic furniture were present. During the measurements no moving objects were present. A Vector Networ Analyzer was used to measure the channel matrix of a 2 x 2 MIMO system.
The UWB patch antennas designed at the ELEctromagnetic DIAgnostic (ELEDIA) Laboratory of the University of Trento were used. The antennas work in the bandwidth 6-8.5 GHz. In this range the reflection coefficient of the antennas is lower than –10 dB. The antennas were synthesized by exploiting an innovative design approach based on the use of a spline description of the antenna geometry and on a Particle Swarm algorithm [7]. In addition to the compliance to input impedance matching requirements, such an approach allows one to design UWB antenna systems with distortionless propagation properties that fit the user constraints in terms of flatness of both the transfer function and the group delay. The antenna prototypes, built on an Arlon substrate, were experimentally verified at ELEDIA Laboratory in Trento as well as at Microwave Laboratory in Cassino.
As regards to the experimental scenario, the inter-element distance between the transmitting (TX) antennas was 13 cm. The same inter-element distance was fixed for the receiving (RX) antennas. Measurements were performed with the two receiving antennas (as well as the two transmitting ones) parallel each to other, and placing the antennas in different positions in order to consider both the LOS cases and the NLOS cases, with a distance between TX and RX antennas ranging from 20 cm up to 3 m. In the following some typical results of the measurement campaign are shown.
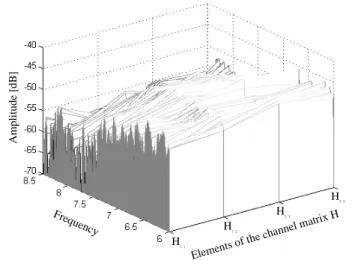
The first example deals with the measurements obtained positioning the TX and RX antennas at 1 m of distance, with a LOS path. The amplitude of the four channel matrix elements (i.e., H11, H12, H21, H22) is plotted in Fig. 1 in the frequency range of interest (6 GHz - 8.5 GHz). One of the channel matrix (i.e., that associated to the number 1 in Fig. 1) was used to evaluate the channel capacity in case of SISO (Single Input Single Output) system. The bandwidth 6-8.5 GHz was uniformly divided in 334 almost frequency-flat sub-bands, each of them having about 7.5 MHz bandwidth. This value is lower than the coherence bandwidth of the UWB channel, estimated to be around 10 MHz [3]. Since the FCC standard regularization fixes the maximum EIRP to –41.3 dBm/MHz, the channel capacity was evaluated considering an average transmitted power equal to –32.6 dBm for each of the 334 sub-channels. The received signal power was evaluated by means of the measured attenuation.
Frequency Elements of the ch annel ma trix H H1 1 H1 2 H2 1 H2 2 Ampli tude [ dB ]
3 -180 -170 -160 -150 -140 -130 -120 -110 -100 10 10-3 10 10 -2 100 101 102 No [dBm/Hz] [b it s/ s/ H z]
MIMO with CSI MIMO with CSIR SISO
MAXIMUM SNR
-1
Fig 2 - Channel capacity (bits/s/Hz) as function of the spectral noise density (dBm/s/Hz); triangles: SISO; diamonds: CSI MIMO; dots: CSIR MIMO; squares: maximum SNR (DETT) -1801 -170 -160 -150 -140 -130 -120 -110 -100 1.5 2 2.5 3 3.5 4 G ain No [dBm/Hz]
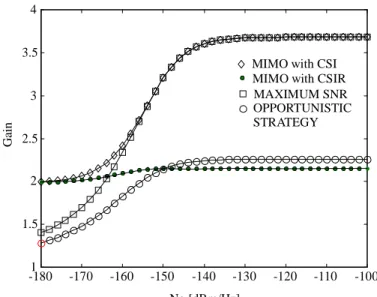
MIMO with CSI MIMO with CSIR MAXIMUM SNR OPPORTUNISTIC STRATEGY
Fig 3 - Channel capacity gain compared to the SISO system as function of the spectral noise density (dBm/s/Hz); TX and RX antennas distance equal to 1 m,
LOS case.
The signal was supposed to be affected by Additive White Gaussian Noise (AWGN) with a spectral power density varying from –100 dBm/Hz to –180 dBm/Hz. Note that the spectral noise density at T=300 K is –174 dBm/Hz. However, according to the IEEE 802.15 working group indications ([8], [3]), we must expect 6.6dB of receiver noise figure, and a further implementation loss of almost 3 dB, so that the noise spectral density is expected to be not lower than –163 dB. Of course, the presence of interfering signals would increase the noise in some parts of the spectrum, depending on the wireless interference system characteristics.
The channel capacity of the SISO UWB system is plotted in Fig. 2 in bits/s/Hz as the line with triangles.
On the same figure the UWB MIMO system in the CSI case is plotted considering the waterfilling solution in each of the 334 sub-channels as line with diamonds (covered in part by the squares, whose meaning will be introduced below), showing an improvement of the channel capacity. The improvement can be quantitatively better evaluated in Fig. 3 where the ratio between the channel capacity of the CSI MIMO and SISO is plotted as line with diamonds. The figure shows that the improvement in the channel capacity drops from almost 4 to 2. In order to clarify the reason of the dropping of the channel capacity improvement, we consider other three cases. The first one is concerned with the channel capacity with Channel State Information only at the Receiver (the so called “CSIR” case). In this case, the transmitted power (in each sub-band) is equally split into the two available spatial sub-channels of the MIMO system. The channel capacity and the improvement compared to SISO are plotted as lines with dots in Fig. 2 and Fig. 3, respectively. The second case is relative to the DETT solution, which maximizes the SNR ratio in each sub-band, obtained associating all the available power in each sub-band to the spatial sub-channel related to the highest singular value of the channel matrix (line with squares in Figs. 2-3). In the third case, we use a simple “opportunistic strategy” to take advantage of the spatial diversity. More in detail, the system transmits all the power available in each sub-band using the
TX and RX antenna associated to the element of the sub-band channel matrix giving the lowest attenuation (improvement compared to SISO system plotted in Fig. 3 as line with empty circles).
With reference to Fig. 3, it should be noticed that the channel capacity of the CSIR MIMO tends to the capacity of CSI MIMO in the case of low spectral noise density power, while the DETT strategy tends to the capacity of CSI MIMO for high spectral noise density power. As well known, the CSIR MIMO case tends to CSI case in the case of high SNR [6]. Consequently, for spectral noise power lower than –150 dBm/Hz we must expect that the ratio between the received signal power and the noise power is sufficiently high to allow to use the spatial channels of the MIMO system in an effective way, obtaining multiplexing gain. In this case, the gain is not larger than the minimum between the number of transmitting and of receiving antennas (i.e., 2 for the MIMO system under test). Instead, for low SNR the system tends to use only one spatial channel, combining the transmitted and received signal in order to maximize the SNR at the receiver. In this case we basically have a power gain. Consequently, the gain is not larger than the product between the number of receiving and transmitting antennas [6] (i.e., 4 in this case). Finally, the curve with empty circles shows that the DETT allows a much higher diversity gain than a simple “opportunistic” strategy in the case of low SNR.
Now, let us consider the same experimental set-up, in which the LOS were blocked by means of a metallic box between the TX and RX antennas. The amplitude of the measured channel matrix elements are shown in Fig. 4. A lower mean value due to the absence of the LOS component can be observed. This shifts the curves of the gains, plotted in Fig. 5, making the power gain more convenient than the multiplexing gain. The increasing of the distance between the RX and TX antennas gives a further shift of the curves. For example, the results obtained in case of TX and RX antennas placed at 3.10 m distance is plotted in Fig 6. The plot shows that the MIMO basically works increasing the received power and not as spatial multiplexer for a reasonable spectral noise density range. Furthermore, MIMO CSI allows one to obtain a significant increasing of the bit rate compared to a simple “opportunistic” strategy.
Frequenc y Amp lit ud e [ d B ] Elements of the ch annel ma trix H H1 1 H1 2 H2 1 H2 2
Fig 4 - Amplitude of the elements of the channel matrix H with NLOS propagation
-1801 -170 -160 -150 -140 -130 -120 -110 -100 1.5 2 2.5 3 3.5 4 G ain No [dBm/Hz]
MIMO with CSI MIMO with CSIR MAXIMUM SNR OPPORTUNISTIC STRATEGY
Fig 5 - Channel capacity gain compared to the SISO (bits/s/Hz) as function of the spectral noise density (dBm/s/Hz); TX and RX antennas distance equal to 1 m, NLOS case.
5 Finally, measurements performed considering distances shorter than a meter between TX and RX show that for such distances it is possible spatial multiplexing for practical values of noise spectral density.
-180 -170 -160 -150 -140 -130 -120 -110 -100 2.2 2.4 2.6 2.8 1.2 1.4 1.6 1.8 2 3 Gain No [dBm/Hz]
MIMO with CSI MIMO with CSIR MAXIMUM SNR OPPORTUNISTIC STRATEGY
Fig 6 - Channel capacity gain compared to the SISO (bits/s/Hz) as function of the spectral noise density (dBm/s/Hz); TX and RX antennas distance equal to 3.10
m, NLOS case.
III. CONCLUSIONS
The measured data show that, with the typical SNR involved in UWB communication systems, MIMO systems allow a significant multiplexing gain only at short distances (less than a couple of meters). Since the bit rate of UWB at short distance is already very high, improvements in UWB are practically relevant at large distances. Consequently, the results of the experimental investigation suggest that the best way to introduce MIMO technologies in UWB systems is to adopt DETT and, consequently, to use the diversity gain offered by the MIMO systems to increase the communication range. Although this work is focused on the spatial diversity, this observation is true also for polarization diversity, since the limitations are not related to the distribution of the two singular values of the channel matrix, but mainly to the low signal noise ratio of the UWB communication systems at large distance.
It is worth to note that, while the spatial multiplexing is a specific characteristic of MIMO systems, spatial diversity can be obtained also, for example, with SIMO (Single Input-Multiple Output) systems [6]. Accordingly, the analysis on the performance of MIMO systems compared to those of SIMO systems appears fundamental to understand the real advantages of MIMO technologies in UWB systems [3]. This requires a full statistical characterization of UWB MIMO channels in realistic scenarios. Such a task that is currently under development.
As last observation, the aim of the present work is to give some insight on the usefulness of the use of multiple antennas in UWB systems. The practical implementation of multiple antenna techniques in pulsed signaling UWB systems is a complex task that requires further studies. .
REFERENCES
[1] V. P. Tran and A. Sibille, “Spatial multiplexing in UWB MIMO Communications,” Electronic Lett., vol. 42 no. 16, pp. 931-932, Aug. 2006.
[2] A. Rajagopalan, G. Gupta, A. S. Konanur, B. Hughes, and G. Lazzi, “Increasing channel capacity of an Ultrawideband MIMO system using vector antennas”, IEEE Trans. Antennas Propagat., vol. 55, no. 10, pp. 2280- 2287, Oct. 2007.
[3] C. Sturm, M. Porebska, J. Timmermann, and W. Wiesbeck, “Investigations on the applicability of diversity techniques in Ultra Wideband radio,” in Proc. ICEAA, pp. 889-902, 2007.
[4] T. M. Cover and, J. A. Thomas. Elements of Information Theory, Wiley Series in Telecommunications, New York, 1991.
[5] M. D. Migliore “On the Role of the Number of Degrees of Freedom of the Field in MIMO Channel”, IEEE Trans. Antennas Propagat., vol. 54, no. 2, pp. 620-628, Feb. 2006.
[6] A. Paulray, R. Nabar, and D. Gore. Introduction to Space-Time Wireless Communications, Cambridge University Press, 2003.
[7] L. Lizzi, F. Viani, R. Azaro, and A. Massa, “Optimization of a spline-shaped UWB antenna by PSO,” IEEE Antennas Wireless Propagat. Lett., vol. 6, pp. 182-185, 2007
[8] IEEE 802.15 Working Group, “Parameter assumptions for the simulation of the proposed 802.15.3a PHYs”, http://www.ieee802.org/15/pub/04/15-04-0488-00-003a-parameter-assumptionssimulation-proposed-802-15-3a-phys.doc.
![Fig 2 - Channel capacity (bits/s/Hz) as function of the spectral noise density (dBm/s/Hz); triangles: SISO; diamonds: CSI MIMO; dots: CSIR MIMO; squares: maximum SNR (DETT) -1801 -170 -160 -150 -140 -130 -120 -110 -1001.522.533.54Gain No [dBm/Hz]](https://thumb-eu.123doks.com/thumbv2/123dokorg/2947435.23090/5.918.273.649.72.365/channel-capacity-function-spectral-density-triangles-diamonds-squares.webp)