PH.D. SCHOOL IN ENGINEERING SCIENCES Ph.D. Course in Industrial Engineering
D
EVELOPMENT OF A DESIGN OPTIMIZATION
FRAMEWORK TO DEAL WITH CURRENT CHALLENGES OF
E
NGINEERING
-
TO
-O
RDER PRODUCTS
Ph.D. Supervisor:
Prof. Michele Germani
Ph.D. Course Coordinator: Prof. Ferruccio Mandorli
Ph.D. Dissertation of:
Vincenzo Castorani
Abstract
This thesis presents a methodological approach to supporting the multi-objective optimization of engineered-to-order products. The goal is to support engineers in designing economic products while meeting performance requirements. The method is based on three optimization levels. The first is used in the prelimi-nary design phase when a company receives a request for proposal. Here, little information on the order is available, and time available to formulate an offer is limited. Thus, parametric cost models and simplified geometries are used in the optimization loop performed by genetic algorithms. The second phase (the embodiment design phase) starts when an offer becomes an order based on the results of the first stage. Simplified 3D geometries and advanced parametric cost models are used in the optimization loop, which presents a restricted problem domain. In the last phase involving detailed design, a full 3-D CAD model is gener-ated, and specific numerical simulations are performed. Cost estimations, given high levels of detail considered, are analytic and are performed using dedicated software. Two case studies to validate the presented approach are described. They concern the design optimization of a steel chimney and an air filtration system typically used in the oil and gas sector. The multi-objective optimiza-tion approach involves the minimizaoptimiza-tion of costs related to manufacturing and assembly phases and the product performance enhancement.
Contents
1 Introduction 1
1.1 Background . . . 1
1.2 Research goals and objectives . . . 2
1.3 Structure of the thesis . . . 5
2 Product customization 6 2.1 Customization Business Drivers . . . 6
2.2 Differentiation in Customized Products . . . 7
2.3 Manufacturing styles . . . 9
2.4 Engineer to order . . . 10
2.5 Customization Challenges . . . 13
2.6 Technical enablers to customization . . . 16
2.7 Summary . . . 19
3 State of the art 21 3.1 Design Optimization . . . 21
3.1.1 Optimization Problem . . . 21
3.1.2 Optimization techniques . . . 26
3.1.3 Current Challenges in Optimization . . . 32
3.2 Knowledge Based Design . . . 34
3.2.1 Product engineering knowledge . . . 34
3.2.2 Knowledge transformation . . . 37
3.2.3 Standardization . . . 39
3.2.4 Enablers for representation of products and product knowl-edge . . . 41
3.3 Cost estimation . . . 43
3.3.1 Cost factors . . . 44
3.3.2 Cost Calculation . . . 45 iii
3.4 Virtual Engineering . . . 50
3.4.1 Product modeling techniques . . . 53
4 Materials and method 58 4.1 Sequential optimization approach . . . 59
4.2 Product configuration . . . 60
4.3 Multi-objective optimization steps . . . 63
4.3.1 I optimization level . . . 63
4.3.2 II optimization level . . . 64
4.3.3 III optimization level . . . 65
4.4 Cost analysis . . . 66
4.4.1 Parametric cost estimation . . . 67
4.4.2 Analytical cost estimation . . . 69
4.5 Performance evaluation . . . 70
4.6 Optimization procedure . . . 71
4.7 Decision-making process . . . 75
5 Case study: Chimney 76 5.1 Chimney description . . . 76
5.2 Sequential design optimization framework . . . 80
5.3 Chimney configuration . . . 82
5.4 Cost assessment . . . 86
5.4.1 Parametric cost model . . . 86
5.4.2 Analytical cost model . . . 95
5.5 Performance assessment . . . 95 5.5.1 Analytical model . . . 96 5.5.2 Numerical model . . . 112 5.6 Multi-objective optimization . . . 119 5.6.1 I optimization level . . . 121 5.6.2 II optimization level . . . 123
5.6.3 III optimization level . . . 124
5.7 Results and discussion . . . 126
5.7.1 I optimization level results . . . 126
5.7.2 II optimization level results . . . 126
5.7.3 III optimization level results . . . 127
5.8 Optimal configuration and AS-IS model . . . 128
6.1 Filter house description . . . 133
6.2 Sequential optimization problem . . . 135
6.3 Product configuration . . . 137
6.4 Cost estimation . . . 139
6.5 Performance assessment . . . 141
6.5.1 Numerical simulation . . . 142
6.5.2 Validation of 2D modelling strategy . . . 145
6.5.3 Simplified and full 3D model . . . 149
6.6 Optimization procedure . . . 150
6.7 Results and discussion . . . 150
7 Conclusions and future works 154
List of Figures
2.1 Growth in product customization [18]. . . 7
2.2 Business drivers for the ETO model. . . 8
2.3 Product differentiation strategies for customized products [18]. . . 9
2.4 Traditional design process for ETO product. . . 12
2.5 Challenges in designing ETO products [18]. . . 13
2.6 Negative impacts of customization [18]. . . 15
3.1 Illustration of Pareto optimal set. . . 24
3.2 Classification of solution techniques for optimization problems. . . 27
3.3 Illustration of the gradient-based search method. . . 28
3.4 Genetic algorithms sequence. . . 30
3.5 Knowledge hierarchy model [1]. . . 36
3.6 Knowledge classification according to [30]. . . 37
3.7 Cost paradox along the product process development process. . . . 44
3.8 Cost/ECR versus time in a conventional PDP. . . 50
3.9 (a) Cost/ECR versus e-Design PDP time; (b) product knowledge versus e-Design PDP time . . . 52
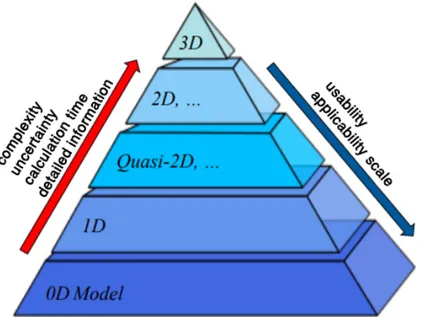
3.10 Applicability of the different model spatial domain. . . 56
4.1 Illustration of proposed method. . . 59
4.2 Illustration of I step of the proposed method. . . 63
4.3 Illustration of II step of the proposed method. . . 64
4.4 Illustration of III step of the proposed method. . . 65
4.5 Illustration of parametric cost estimation. . . 67
4.6 Illustration of analytical cost estimation. . . 69
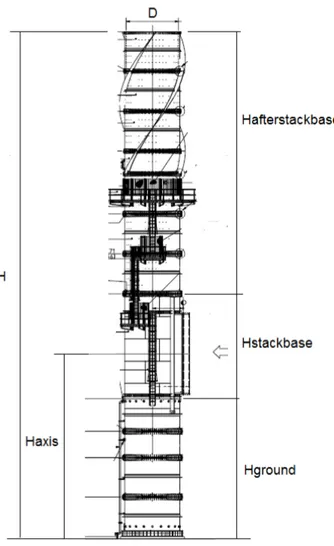
5.1 Geometry of the self-bearing chimney. . . 77
5.2 a) Standard stack b) Stack base. . . 78 vi
5.3 The proposed design methodology applied to the design of a
mod-ular steel tower. . . 81
5.4 3-D CAD model of a circular stack. . . 82
5.5 Screenshot of the implemented ducts configuration tool. . . 84
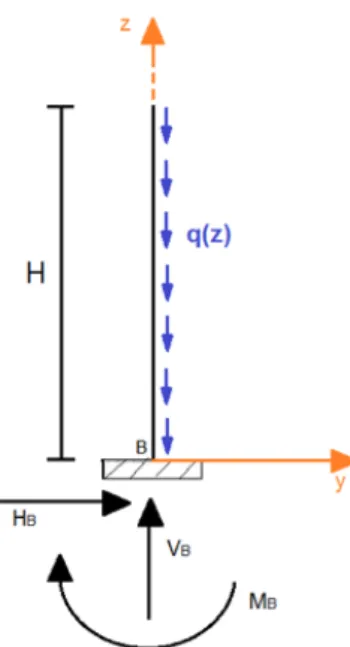
5.6 Approximation of the self-bearing chimney as a De-Saint Venant’s beam fixed at one end. . . 96
5.7 Technical representation of the investigated self-bearing with its geometrical constraints. . . 98
5.8 Diagram of the fixed beam with application of dead loads. . . 99
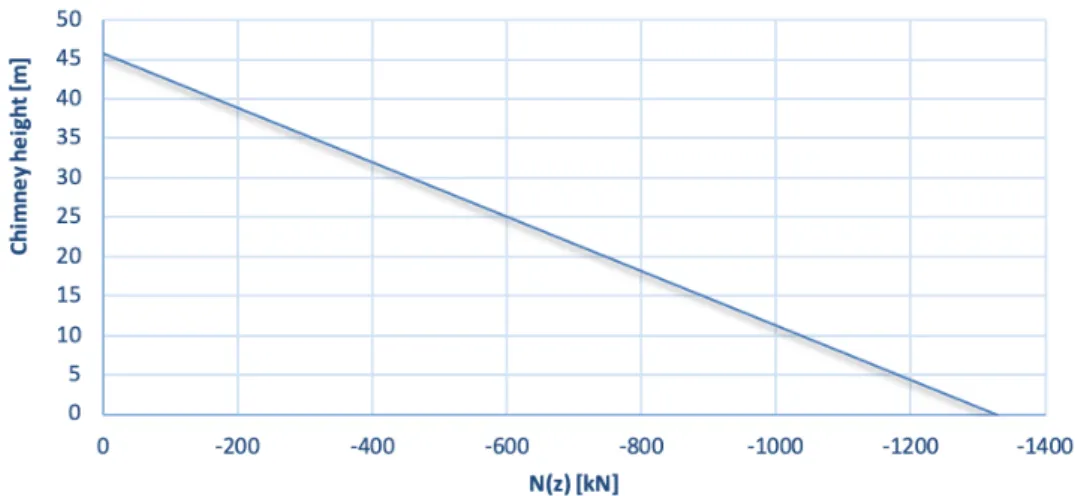
5.9 Typical diagram of normal stress along the beam subjected to dead loads. . . 101
5.10 Diagram of the fixed beam with application of live loads. . . 102
5.11 Diagram of the fixed beam with application of live loads. . . 102
5.12 Diagram of the fixed beam with application of wind load. . . 104
5.13 The shear force diagram of the chimney under wind load. . . 106
5.14 The bending moment diagram of the chimney under wind load. . . 106
5.15 Diagram of the fixed beam with application of seismic loads. . . 108
5.16 The normal force diagram of the chimney under seismic load. . . . 109
5.17 The shear force diagram of the chimney under seismic load. . . 109
5.18 The bending moment diagram of the chimney under seismic load. 110 5.19 Simplification of the bolted connection: a) real connection, b) sim-plified connection. . . 117
5.20 Simplification of the ground connection: a) real connection, b) simplified connection. . . 117
5.21 3D view of the FE analysis model. . . 118
5.22 Scheme of load conditions prescribed by the ASCE/SEI 7-05: a) dead load, b) live load, c) wind load, d) seismic load. . . 122
5.23 Workflow of the first MOO stage. . . 123
5.24 Workflow of the second MOO stage. . . 124
5.25 Workflow of the third stage of MOO. . . 125
5.26 Results of the first optimization stage: 8 stacked items with different thicknesses (mm), weights (%) and costs (%). . . 126
5.27 Results of the second optimization stage: 8 stacked items of differ-ent thicknesses (mm), weights (%) and costs (%). . . 127
a) rain hood technical draw, b) as-is rain hood distance,
c) optimal rain hood distance. . . 129 6.1 Geometry of the investigated air filtration system with its
compo-nents: 1) weather hood, 2) droplet catchers, 3) bird net, 4 & 5) the filtering stages, 6) inlet air cooling system, 7) demisters, 8) transition section. . . 134 6.2 Sequential optimization approach of the air filtration system - AFS. 136 6.3 Implemented design rule for the selection of a filter house. . . 138 6.4 Rectangular uninsulated duct. . . 139 6.5 a) 3D model of the filter house, b) 2D top and lateral section model. 143 6.6 Trend of velocity: a) A section of the 2D model, b) A section of the
3D model, c) B section of the 2D model, d) B section of the 3D model.146 6.7 Trend of pressure: a) A section of the 2D model, b) A section of the
3D model, c) B section of the 2D model, d) B section of the 3D model.147 6.8 Trend of temperature: a) A section of the 2D model, b) A section of
the 3D model, c) B section of the 2D model, d) B section of the 3D model. . . 148 6.9 Trend of velocity on the B section considering the real M6 geometry 149 6.10 Optimal configuration for the air filtration system. . . 151 6.11 Pressure drop: a) weather hoods, b) transition duct. . . 152 6.12 Confrontation between the velocity (at the inlet section of the first
List of Tables
3.1 Classification of the cost estimation techniques. . . 47
5.1 Main chimney design specifications and constraints. . . 80
5.2 Characteristic features of a circular stack. . . 85
5.3 Parameters used in cost calculation equations. . . 89
5.3 Parameters used in cost calculation equations. . . 92
5.4 Parametric cost model equations for cylindrical stack. . . 93
5.4 Parameters used in cost calculation equations. . . 94
5.5 Wind load calculation values according to ASCE/SEI 7-05 [4]. . . 103
5.6 Calculation values for the seismic load according to ASC/SEI 7-05 [4].107 5.7 Summary of the optimization. . . 120
5.8 Confrontation between the real case and the one reached with the proposed framework. . . 130
5.9 Design optimization time estimation . . . 131
6.1 Parametric cost model for a rectangular uninsulated duct. . . 140
Introduction
1.1 Background
In the modern industry, the responsiveness of a company with respect to cus-tomer demands plays a key role in increasing its attractiveness. Products must meet the growing needs of the market by achieving the right compromise between performance and cost. At the same time, they should be quickly introduced into the market, without losing competitiveness. However, in the case of complex and customized products it is not a trivial task. In fact, often, the goals to be achieved are conflicting and this means that there is not just a single solution, rather multi-ple solutions to the problem. [32] In addition, products require multi-disciplinary design efforts to design and manufacture, which enhance the importance of effective knowledge exchange as a base for decision-making process [55]. In case of Engineered-To-Order (ETO) products, the design process consists mainly of three phases [21]. The first one (conceptual design) starts when the company’s commercial division receives a Request-For-Proposal (RFP) for a new system and it has to prepare the relative economic quotation. The analogical cost estimation approach is not applicable for such products because the high level of customization required by the customer. Therefore, it is necessary each time to perform a preliminary design of the system. The timing to produce this analysis is typically very short. Errors at this stage, especially in the phase of cost estimation, can lead toward a drastic reduction of the company’s profit.
The second and third phase (embodiment and detailed design) starts when the offer becomes order. Depending by the complexity of the project, the engineering department, which leads this phase, has a time span between three and five
months for completing the detailed design.
In the first phase, the product optimization is a key aspect for achieving a com-petitive product. Optimizing a product means to determine the value of certain parameters (design variables) that allow to achieve the best measurable per-formance (objective function/s) under given constraints. However, the limited timeframe led engineers to a rough optimization. During the second and third phase, the optimization must be stressed. In fact, once the sale prize has been set in the first phase, the optimization process directly influences the product profit. Moreover, ETO products are generally configurable products where the design-sales-delivery process requires only systematic variant design, no adap-tive or original design in the sense of Pahl and Beitz [44]. Therefore, they can be optimized since the early stages of the design process. Indeed, configurable products have pre-designed general structures on which designers can apply an optimization process.
Nowadays, the optimization process mostly depends on manual analyses [87] that lead to suboptimal solutions and the quality of the results depends by the time spent. A step-by-step approach, namely manual optimization, is a time-consuming process that does not allow a comprehensive exploration of the prob-lem domain [87].
Furthermore, the evaluation of the product performances or production costs implies using specific software tools. For example, a Computer Aided Engineer-ing (CAE) software for assessEngineer-ing the mechanical performance [25] or a Design to Cost (DtC) tool for estimating the manufacturing costs [23]. Nevertheless, these tools, due to the complexity of the FEA codes and the cost assignment process, requires a great deal of time to perform an evaluation [105]. Additionally, when the problem domain is very large (e.g. heavy machinery, civil large structures, etc.) the time increases rapidly making the cost-performance assessment not feasible within the timeframe requested by the customer. Definitely, to simplify and accelerate the identification of the optimal product configuration, in or-der to increase the product quality and the time-to-market (TMT), a quick and automatic design optimization framework is essential.
1.2 Research goals and objectives
To address the described challenges companies engineering departments need to implement methods and tools to capture valuable knowledge and reach optimal
solutions during the designing phase. One possible countermeasure to address the challenges described above is to establish a knowledge base that spans all projects of an organization and integrate the design process with the use of dy-namic and flexible tools able to perform in an automatic and effective way cost and performance assessment. All the different design analysis should be driven by an optimization engine able to reach the best possible design configuration. In this regards, the scientific literature contains several optimization approaches to be used during the design phase. For example, Park and Dang [81] presented a method for the structural optimization of mechanical products through the integration between commercial CAD-CAE software. This integration is reached by means of scripts, programming languages and Application Programming Interface (API). Castorani et al. [28] proposed a multi-objective optimization approach for mechanical products, by associating the Response Surface Method-ology (RSM) and the Design of Experiments (DoE) techniques with an integrated platform made by CAD-CAE-DtC software tools. Cicconi et al. [33] developed a platform-tool for the automatic optimization of steel structures through virtual prototyping tools and Genetic Algorithms (GAs). They focused on the design of heavy reticular frame for oil & gas power plants. McKinstray et al. [67] studied the optimization of asymmetric and fully tapered portal frames via GAs. They consid-ered as loading the combination of snow and wind and as objective function the weight reduction. Their approach led to weight savings up to 40%. Farshchin et al. [42] proposed a Multi-Class Teaching–Learning-Based optimization (MC-TLBO) technique for truss structural optimization. The MC-TLBO algorithm was a two-stage procedure, which allows a better overall performance of the search space exploration. Their approach achieved a 4.5% weight reduction. Barraza et al. [12] compared the use of Non-Dominated Sorting Genetic Algorithm (NSGA-II) and Particle Swarm Optimization (PSO) for steel structures under earthquake loads. They aimed to minimize the structure weight without violating strength require-ments of the AISC-LRFD specification. They found that the solutions reached for PSO was in general better respect to the NSGA-II approach. Gong et al. [48] proposed a design optimization approach for steel buildings under earthquake loads. The objectives were a combination of minimum weight, minimum seismic input energy and maximum hysteretic energy of fuse members. The optimization problem was solved thanks to the integration of GAs with non-linear response history FEM (Finite Element Method). El Semelawy et al. [41] developed a tool for structural optimization of pre-stressed concrete slab. The tool used the FEM
for structural analysis and GAs to solve the optimization problem. The objective function considered the costs of concrete and pre-stressing tendons. Li et al. [63] presented an optimization methodology for beam-plate structure based on two levels. At first, bidirectional evolutionary structure optimization (BESO) method is exploited to achieve the optimal topology of structure, then, RSM is used to reach the optimum section to find the best final solution.
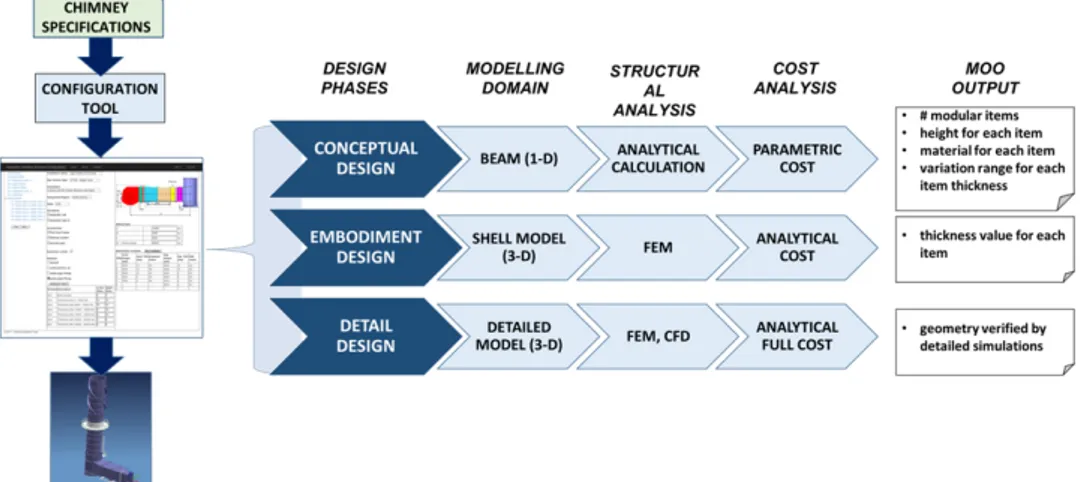
However, the scientific researches mentioned above are focused on methods and tools for a performance or performance-cost optimization without considering the importance for quickness, especially in case of complex and customized systems with high manufacturing cost. For this reason, the overall goal of this thesis is to investigate the deployment of approaches, tools and methodologies to establish a framework for implementing a strategically oriented design op-timization approach in the ETO product development process. This research work presents a rapid but accurate sequential and multi-objective optimization framework for the design of ETO products. This approach consists of three stages as the typical design phases for ETO products. During the RFP phase, an MOO is used to support an early evaluation of cost and product performance through a performance analysis. This optimization phase is performed using simplified simulation models (e.g., 1D-product models solved using lumped parameters models) opportunely automated to explore several solutions without the use of manual inputs. Subsequently, during the embodiment design phase, a simplified 3-D model is optimized from the results of the first stage. This carryover approach restricts the optimization problem domain at the second stage (when the product is more detailed) by reducing the number of variables considered and/or their variation ranges. Finally, for detailed design, based on the results of the previous phase, comprehensive optimization is performed. In turn, from analytical cost estimations and broad analyses of the product behavior of a full 3-D model, an optimal solution can be identified. This method allows for a complete exploration of the problem domain quickly developing a semi-optimized product design use-ful for the bidding phase and then a robustly optimized product design for the maximization of a company’s profits during the engineering design phase of ETO solutions. The expected benefits are a more effective design process, less design efforts and rework, increased product performance, and enhanced organizational profit.
The proposed framework is validated through two real case studies concerning a self-bearing chimney and an air filtration system (AFS) for oil & gas power
plant. The tower and the AFS examined are subject to forces (weight, winds, earthquakes, etc.) and conditions typical of conditions prevailing in the related installation site. The investigated cases are optimized in terms of cost and me-chanical performance.
1.3 Structure of the thesis
This thesis has been structured as follows:
Chapter 2 sets the background of product customization.
Chapter 3 reviews key definitions, methodologies, and tools in the research fields: engineering design, knowledge-based design, design optimization, performance assessments and cost estimation.
Chapter 4 presents the developed framework.
Chapter 5 presents a case study to validate the proposed design framework and to make clearer the various steps of the approach.
Chapter 6 presents another case study to highlight how the proposed framework can be applied to other products adopting different methods and tools. Chapter 7 summarizes the most important results derived from the research and
presents the overall conclusion of the thesis. Further, it suggests potential areas for further work.
Product customization
The field of product customization has grown over the past years, and it will con-tinue to expand in the future (as shown in Fig. 2.1) [112]. Most part of companies report a growth, only very few activities indicate a decrease. Business analysts expect a further growth of product customization over the next 5 years [18]. This trend has been common to a wide variety of industrial sectors, though some differences can be observed. For instance, while the Configured-To-Order (CTO) business model is commonly used as a product practice in the automotive in-dustry [65], the Engineering-To-Order (ETO) model is widely applied in different sectors such as the oil and gas sector [112]. CTO and ETO products differ in regards the presence of preconfigured and pre-scheduled production activities. While ETO products are engineered and built after an order is made [61], CTO products are already developed before a customer’s order is made. ETO situations are very common when customer requirements cannot be fulfilled through stan-dard offers. Sylla et al. [96] have classified ETO solutions as light when stanstan-dard solutions almost fully cover requirements through minor customizations or as
heavywhen the related solution must be completely adapted and defined.
2.1 Customization Business Drivers
To understand why product customization is growing, it is necessary to analyze what are the reasons (shown in Fig. 2.2) that drive the sale of customize products. The main reason is that customization helps companies to differentiate from their competitors. It is reported that 43 % of industrial equipment companies and 46 % of the automotive and transportation industries have a strategy to differentiate
Figure 2.1: Growth in product customization [18].
based on customization [18]. Indeed, studies show that customization is second only to innovation as product differentiation strategy [58].
ETO business model is a great way to compete in modern global markets since it helps in encountering customers’ requirements [22]. On the other hand, it is the nature itself of specific business sectors that leads to the necessity of customizing products. For example, a plant has to respect client specifications and also to be conform to site specification like footprint, loads, local legislation, standards and lots of other factors. Also, the companies where selling customized products is the rule are providing their customers with higher level of customization. The possibility to grab higher prices is another motivation that pushes companies to customize products even if not always it is possible to charge a price premium [56]. For instance, among biomedical and consumer goods business activities, a great part customizes to command higher prices trying to satisfy more the customer necessities.
2.2 Differentiation in Customized Products
Customization is adopted by companies to differentiate their products, since it leads to be more competitive [56], but how do they differentiate their customized products? The answer is with a higher level of customization (as shown in Fig. 2.3). Being able to meet more customer requirements has been recognized as a winning strategy to differentiate a product. The more the client will be able to modify a product according to his personal expectations, the most it will be
satis-Differentiation
Industry Nature
Localization
Higher Prices
EtO
Drivers
Figure 2.2: Business drivers for the ETO model.
fied. It is generally recognized as client satisfaction plays a key role in business success. These are not the only adopted product differentiation strategies in the sector of tailor-made products.
Also, product reliability and service/support provided to a client have an im-portant role. Customers are looking for assurance that the product will work in a satisfactory manner over its entire life with no unplanned stop. In the worst scenario that a failure will happen, they want to be able to count on a ready and effective service that will repair in a cost-effective way their product.
Building a strong brand is recognized as a powerful way to success in today’s busi-ness world [69]. Brand differentiation is the means by which a brand is set apart from the competitors, by relating a greater performance aspect with numerous client benefits.
Businesses-man across different industries have quickly realized that speed can be used to develop a competitive advantage. Speed can be categorized under a number of different labels, including speed to market, speedy delivery and speedy service, but the root word stays the same. Anytime a business can do something faster than the competition, they’re going to experience some level of success. In industries that are particularly price competitive, speed can be the distinguishing competitive advantage.
Other important factors, but not the key to success in ETO sales, are the rapid quotes and global reach. Surprisingly, the price is the least influent in differenti-ating products. In this particular sector, clients want their requirements satisfied and they are prepared to pay for that. Moreover, you may be cheapest today, but a competitor can always drop their price [59].
Figure 2.3: Product differentiation strategies for customized products [18].
Researches highlighted that differentiation strategies are different from one in-dustrial sector to another. For instance, aerospace and defense industries exploit their capabilities in offering a deeper level of customization and meeting cus-tomers specifications as the leading way toward product differentiation. Differ-ently, reliability is the key factor in safety-critical companies. Industrial equip-ment is more concentrated on encountering client needs than most industrial sector, while the biomedical industry competes much more on quote and delivery speed.
The choice of a proper strategy makes a great difference in terms of business achievements.
2.3 Manufacturing styles
One or more manufacturing style can be adopted by companies, that range from producing standard items that can be created and sold off of the shelf to merely custom products to manufacture a large variety of items designed on the basis of customers’ requirements. Traditionally, we can distinguish, depending on the adopted manufacturing style, the following products:
Standard Product that do not demand supplementary definition other than a part number when ordered or manufactured.
Configured-to-Order (CTO) Products are configured, manufactured and assem-bled based on client specifications using features and options (such as size, material, color, etc.). All items are designed prior to take them to the market, no more engineering efforts needed when client requirements are known. The product configuration process consists of selecting the proper items and assemble them into a valid product. The ordering process of a car or a personal computer with all its options can be seen as a typical CTO process.
Engineer-to-Order (ETO) Products are designed, engineered and produced, ac-cording to customer specification, after an order has been received. They are one of a kind products that require designing new parts to encounter client’s needs. During the proposal and order fulfillment process a signifi-cant engineering effort may be required.
Job Shop/Pure Custom Products that, in order to satisfy client needs, demand for an engineering and designing process. This kind of items are unique and not repeatable as they do not follow any logical or replicable design rules.
Hybrid Product produced mixing CTO and ETO manufacturing styles.
Considering this classification an ambiguous aspect could be the distinction between CTO and ETO. The main difference is that ETO products demands for additional design effort to achieve a quotation and manufacturing information [110]. Typically, ETO is based on engineering calculations and decision-making process that increase design process complexity demanding additional engineer-ing effort and expertise. While, CTO consists in just pickengineer-ing and choosengineer-ing part numbers to assemble together.
2.4 Engineer to order
Engineer-to-Order ETO products are complex ‘one of a kind’ systems and involve highly variable products [8] designed to satisfy client specifications. The ETO scheme is used as an optimal means to compete in modern industry whereby the
responsiveness of companies with respect to customers’ demands plays a key role in enhancing a company’s attractiveness [38]. However, it involves designing new parts to cater to customer needs [112]. In bidding preparation and order fulfillment processes, meaningful project-based efforts may be warranted. This typically involves engineering calculations and decision-making processes [112]. Growing levels of customization introduce more design complexity [100], which in turn creates different problems: incorrect quotations, late deliveries, missed financial targets, etc. André et al. [8] have highlighted that ETO business could benefit from the introduction of design platforms that support the development of highly customized products. Krisanto et al. [61] have noted that a lack of modularization lengthens the duration of engineering change orders.
In accordance with Pahl and al. [44], the product design process (PDP) of complex ETO products can be divided into three main phases.
The first one (preliminary design) begins when a company’s commercial division receives a Request-For-Proposal (RFP) for a new product/system/plant. To com-plete this task, a preliminary design must be developed. The time period required to obtain a technical and economic proposal as accepted by the customer is generally very short. Errors made at this stage and especially in terms of cost estimations can lead to a severe reduction in company profits.
The second phase (embodiment design) starts when an offer becomes an order and when a design must be developed. Engineers determine the definitive prod-uct layout and ensure that functional, strength, dimensional, cost requirements are met. Time allotted to this phase depends on the complexity of the design concerned and can generally varies from few weeks to several months.
In the third phase (detail design) an executive project must be completed. For example, in case of typical oil and gas structures, all accessory parts (e.g., flanges, bolts, catwalks, etc.) must be designed and final drawings must be produced to define manufacturing and assembly processes. Typically, less time is allotted to this phase than the embodiment design phase.
In Fig. 2.4 are reported the typical steps from the request for proposal phase to the site installation of the system. This kind of design, manufacturing and installation process presents various issue: long-lead times, proposal could lack of content, guess-work erodes margin, lower win rates, order engineering detracts from new product introduction, changes difficult to manage, errors cause scrap and rework liquidated damages etc.
Figure 2.4: Tr aditional design pr o cess for ET O p roduct .
Figure 2.5: Challenges in designing ETO products [18].
2.5 Customization Challenges
Today’s products are complex. It is generally recognized that they are complex to design, to produce and to support. This challenge is even more hard when we talk about customized products. Indeed, this kind of items demand for engineering based on order requirements. Clients are increasingly requiring more innovation and quality expectations have risen. Therefore, being able to manage product complexity is a relevant business issue.
Considering ETO products, the two major challenges are related to sales quotes (as shown in Fig. 2.5). Estimating properly the cost and being able to produce rapidly a quotation are the most difficult tasks for manufacturers.
Creating an accurate cost model is the most common challenge that can have a relevant impact on product profitability [83]. Achieving an accurate cost and schedule estimation requires lots of knowledge about the product that generally are not available during the request for proposal phase. Even though most com-panies are able to produce a quotation relying on a number of cost key drivers, to achieve an accurate estimation a detailed designs and specific knowledge about different products and manufacturing aspects (i.e., materials, machines, work-center times, custom tools, labor costs and times, etc.) are needed [22].
The incapacity to estimate accurately costs can lead to two different limit situa-tions. On the one hand, too much buffer is added making the offer less attractive, on the other hand, an aggressive price is proposed risking of losing money on the order. A right trade-off between these two situations is not so easily found. Quote response times represent the second major challenge for ETO companies [109], which must be able to prepare a competitive bid as soon as possible with-out taking on unacceptable levels of financial risk. Speed and accuracy almost always work against each other. Often, the available time is so short that, at best, a guess-work is carried-out. Moreover, long engineering lead-times significantly affect the development of ETO products. Time-related problems are mainly attributable to the required customizations to develop a product and typically without the use of systematic approaches or specific tools. This often results in a need for more complex design efforts than were expected, causing considerable delays in project development [17].
The quotations presented to clients are more than just a price. They contain rich product content like drawings, 3D models, technical details, performance assessments etc. This material is necessary to make customers aware how the proposed solutions satisfy their requirements.
Another big challenge in selling customized products is the capability for manu-facturer to meet agreed delivery schedule. This is probably related to the fact that lots of design tasks are carried out manually along with long engineering lead times and lack of engineering resources. Manual designing is likely the cause also for the long lead-time needed to produce a quotation. Industries requiring too much manual designing tasks will experience long quotation and order fulfill-ment lead time.
Due to the short design time and few available information (especially in the request for proposal phase) is not so easy to retrieve accurate and complete man-ufacturing information.
The engineering time is further extended since the design process is too people-centric. This people-centricity leads also to the fact that the company’s knowledge is often owned by few engineers. When these engineers go out from the company a vacuum of knowledge is produced.
During the engineering process is not so unusual that requests for changes are advanced by clients and, in this so structured context, it is difficult to accommo-date these requests.
com-Figure 2.6: Negative impacts of customization [18].
pelling and accurate quotation.
Ultimately the reached design is in the best scenario a sub-optimal design. All the challenges described above lead to relevant and negative consequences (as shown in Fig. 2.6). Research studies highlight that companies producing customized product suffer often of order errors. It is estimated that averagely 20 % of custom orders suffer of late delivery and about 17 % miss financial targets. Almost the same number of orders need recalls or warranty repairs due to errors in manufacturing documentations. The 10 % result in request for damages compensation by the customers. Moreover, the cost target, in 15 % of cases, are not respected and overrun happen [18].
These concrete problems can have a serious impact on company profitability, reputation and relationship with clients. It is extremely important to highlight that many often orders suffer more than just only one error making the problem even more serious.
2.6 Technical enablers to customization
Analyzing the most common challenges in the ETO product development process, it seems to be a lot of rooms for improvements. These improvements can be reached along all the ETO design phases: selling, engineering, manufacturing and installation. Different can be the tools and methods helpful to make more efficient and accurate the PDP for ETO products. In particular, we can cite:
• product configurator; • cost estimation; • numerical simulation; • design optimization; • design automation.
Product configurator is an interesting tool able to improve efficiency and reducing design errors. It can be seen as a valid and effective implementation of the knowledge-based design paradigm. This tool could be able to perform three different action: configuring the product, estimating a price, generating a quote. The configuring task can be seen as the process of finding, choosing and com-bining together product options to create a valid product configuration taking into account all rules and constraints (e.g. manufacturing limitations, standards, functional restrictions etc.).
Estimating a price means deciding how much the client should pay to acquire that kind of customized product while considering all the configuration and additional circumstances (e.g. financial margins, manufacturing costs, quotation competitiveness etc.).
The quote generation is a crucial action, since it enables the redaction of a syn-thesis document describing the proposed solution with the relative price. In this context, two different kind of configurator can be identified:
Sales configurator Software tool that enables sales department to generate a valid product configuration with enough information to estimate a sales price and generate a quotation. To perform this kind of operation, the software exploit configuration and quotation rules captured within the sys-tem and automate the bidding process. The sales configurator is generally integrated into CRM and ERP tools.
Technical product configurator Software tool that enables design engineers to produce in an automated way a detailed technical product configuration. The output of this tool is a rich model with sufficient information to manu-facture the product. To perform this kind of operation, the software exploit design and configuration rules captured within the system. It automates the generation process of the BoM - Bills of Materials and work instructions. Technical product configurator may be also able to create CAD models, technical drawings and specifications.
Generally, sales configurators manage product configuration at order level based on product features and options, providing a quote with the relative price of a valid configuration. Differently, technical configurators imply an analysis and decision-making process to engineering the specific order. These two different kinds of configurators, even if are distinct tools, are used both independently by companies.
Product configurators are able to solve different issues of the ETO design process: • slow quote process;
• long time in proposal generating; • low accuracy in the reached quotation;
• losing opportunities for up-selling and cross-selling; • few information on pricing changes.
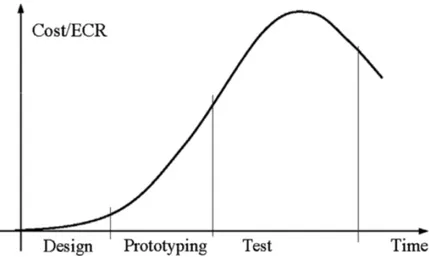
Estimating costs is an important task to perform as early and as accurately as possible in the product development process. This is particularly true when referring to ETO products where costs directly influence the company’s win rates and profit. It is generally accepted that the greatest part of costs is committed when the conceptual solution has been selected and the embodiment design is concluded [40]. The opportunities to reduce costs during the manufacturing and installation phases are relatively few. Therefore, it is crucial to begin cost opti-mization as early as possible. Indeed, every design change that has to be made during production is generally very costly. Cost estimation and optimization practice could prolong the PDP, but it is more economical and convenient than reducing cost lately to do not lose financial margin. Different are the available methods and tools to identify cost during the all design process. Each method
has its own specificity. Introducing cost estimation practice, instead of guess work, will help enormously in reducing missed financial target and improving bid win rates.
Performance assessment is central to the design of all kind of product. In par-ticular, referring to ETO designs, it is focused on the delivery of performing and cost-effective products to meet client’s needs. Often, this kind of assessment is carried out manually performing analytical calculations and experimental test. This kind of procedure is time consuming and makes complex the parametric study of the product. Numerical simulation, in particular physics-based simula-tion, can be a valid allay of the engineer to evaluate performance of the product in an accurate and rapid way [24]. The physics-based simulation tools likely minimize the necessity for product experimental tests. Due to the fact that solid modeling and virtual analysis are carried-out, accidental design defects experi-enced during the physical tests are lowered, thus reducing the feedback loop for design changes. Furthermore, the manufacturing phase is smooth as it has been scheduled and simulated. Possible issues related to manufacturing will have been broadly resolved in earlier design stages. The evaluation of product per-formance by means of physics-based simulation in the computer environment is commonly called virtual prototyping or VP. The advancement in simulation methods and tools has meant that more and more engineering questions have been found a more realistic answer through numerical analysis, thus minimizing the demands of physical testing. Nevertheless, some key questions cannot be an-swered for very complex engineering problems. VP will probably never substitute physical experiments entirely, however the savings it reaches for less complicated problems is relevant and beneficial.
A very helpful practice that is not widespread across engineering departments is the product optimization. Very often, products are designed, fabricated, and used regardless of whether they are the best one. It is a challenge for engineers to project performant and cost-effective solutions without compromising any design aspect. Lots of optimization methods and tools have been developed and employed to design better products. The optimization has been evolved to the stage of automatic design optimization through the use of dedicated platforms, such as ModeFrontier® or ISight®. These software are able, in a single frame-work, to integrate and communicate with each other CAD/CAE/DfC (Design for Cost) tools with optimization algorithms and methodologies. Optimization analysis have been playing a crucial role in developing competitive products. The
optimization of an existing product can be dictated by several factors such as: regulation, market needs, customizations, company strategies, etc. The integra-tion of an optimizaintegra-tion phase inside the tradiintegra-tional design processes can increase delays and cost. This risk grows when complex software tools are used during product design. However, this risk is well compensated to the enormous benefits in reaching an optimal solution.
Another category of tools able to improve ETO design efficiency is design au-tomation. Design automation can be defined according to Cederfeldt and Elgh [29] as ’computerised automation of tasks that are related to the design process
through the implementation of information and knowledge in tools or systems.’
These tools typically automate engineering and design calculations integrating themselves with CAD, CAE, ERP and spreadsheets. Often, technical configura-tors are equipped with heavy design automation capabilities. The configuraconfigura-tors that integrate design automation can automate manual engineering that is a bottleneck in all the design phases. This practice allows to reach more product configuration competing at the same time on quick quotations and order delivery, since automation is able to speed-up the design process, reducing errors and pro-viding more precise manufacturing documentation. Automatic bid generation allows to avoid costly and time-consuming effort in developing quotes and to exploit 3D CAD models to create more visual and convincing bids.
2.7 Summary
Multi Objective Optimization (MOO) methods and tools coupled with numerical solvers, automatic cost estimation tools, product configurators and design au-tomation systems allow companies to secure new market shares [71] [111] and to beat competitors during the preliminary design stage when an RFP must be prepared [96]. As noted in the following chapter, MOO is a common practice used to reduce product costs and to enhance performance in line with project require-ments and standards. This approach is used to deliver a competitive offer and especially in the sector of complex ETO products [45]. Enhanced MOO achieved during the preliminary design phase can drastically enhance the competitiveness of a product and of a company’s profits. However, this is not a trivial task due to the presence of time constraints and due to limit product knowledge. Optimiza-tion must also be stressed in design stages that follow. In fact, once a sale price has been determined in the first phase (order received), the optimization process
directly influences product profit margins.
Therefore, as stated in the previous chapter, the aim of the present study is to formulate a framework to produce an optimized design of ETO products. In this context, a sequential and multi-objective optimization method for the ETO design has been developed.
State of the art
In the previous chapter it was made clear that ETO manufacturers can experi-ence great benefits in rethinking their design process integrating methods and tools concerning the design optimization, cost estimation, virtual performance assessment and knowledge-based design. Therefore, in this chapter, the state of the art about methods and tools available in these fields is presented.
3.1 Design Optimization
In the ETO sector, one of the main priorities is the identification of the optimal solution, which is namely, the solution that allows to achieve the best measurable performance (objective function/s) under given constraints. Therefore, multi objective optimization has become very popular in this sector [33]. When per-forming MOO, several methods (genetic algorithms (GAs), evolution strategies (ES), differential evolution (DE), particle swarm optimization (PSO), neural net-work (NN), etc.) can be employed to achieve a solution [46]. The use of such expensive computational methods has been facilitated by recent progress made in the development of computing technologies [72]. In this context, research on this topic has become even more popular.
3.1.1 Optimization Problem
Formulating a design problem as an optimization problem, various aspect have to be taken under consideration. At first, it is important to define what are the properties that the system should have and how to measure them (objective
best possible solution has to be identified. Finally, the constraints to be respected have to be described. In formulating an optimization problem, all have to be formalized in a mathematical way. This formalization transforms a qualitative description of a problem into a quantitative statement.
In general, the mathematical form of a single-objective optimization problem is given as: Minimize f (~x) Subject to: ~gi(~x) ≤ 0, i = 1,m ~hj(~x) = 0, j = 1,p ~xl k≤ ~x ≤ ~x u k, k = 1,n (3.1)
where f (~x) is the objective function; ~gi(~x) is the ith inequality constraint;
mis the total number of inequality constraints functions; ~hj(~x) is the ith
equal-ity constraint, p is the number of equalequal-ity constraints;~x is the vector of design variables; n is the total number of design variables;~xl
kand~x u
k are the lower and
upper bounds of the kth design variable xk respectively.
After a proper formulation of the optimization problem, the model has to be solved for an optimal solution. The solving process involves choosing the most appropriate optimization algorithm or technique. Engineers needs to know and understand the main concepts and the advantages and disadvantages of the dif-ferent optimization methods, since an optimization problem is typically solved numerically. Graphical methods are the best choice when it comes to simple problems with two or less variables. Moreover, when the objective function and constraints are explicitly expressed in terms of design variables, the necessary and sufficient condition of the optimality can be exploited to solve the problem. Optimization problems can be classified in different ways. The design problem described by Eq. 3.1 is called single-objective (or single-criterion) problem since only one objective function is considered to be optimized. When multiple objec-tive functions are involved in the design process, it is called multi-objecobjec-tive (or
multi-criterion) problem. In this case, the aim is to optimize all the objectives at the same time.
Equality and inequality constraints can be present for an optimization problem. When they are present it is called constrained optimization problem. If no con-straint is involved, these problems are defined unconstrained. Moreover, the nature of the formulation for the objective functions and constraints determine a
further classification: linear, nonlinear and quadratic optimization problems. If all the functions are expressed through linear correlation, such problem is called linear optimization problem and linear programming techniques are used for the solving process. Otherwise, if only one of these functions is non linear, the prob-lem is called nonlinear, and they are solved by the use of nonlinear programming techniques. This kind of classification is particularly useful in choosing the most suitable optimization algorithm since special methods have been developed for the solution of particular class of problems. Therefore, one of the first task for an engineer is determining the kind of problem encountered or formulated. That, in most cases, will rule the choice of the solution method to be adopted.
Another important classification come from the number of disciplines of the phys-ical models involved in the optimization analysis. We can have single-disciplinary or multi-disciplinary design optimization MDO problems.
Ultimately, a further classification can be reached based on the deterministic nature of the analyzed variables. We can have deterministic or stochastic opti-mization problem. A stochastic problem implies that one or all the variables are expressed in a probabilistic way.
Multi-objective problem
Engineering optimization problems typically involve the simultaneous minimiza-tion or maximizaminimiza-tion of different criteria. For example, designers would like to minimize weight maximizing stiffness; or minimize cost maximizing production volume etc.
The mathematical form of a multi-objective optimization problem is given as: Minimize F (~x) = [f1(~x), f2(~x),..., fj(~x)]T Subject to: ~g(~x) ≤ 0 ~h(~x) = 0 ~x ∈ Rn, ~f(~x) ∈ Rk, ~g(~x) ∈ Rm and ~h(~x) ∈ Rq X = {~x|gm(~x) ≤ 0, m = 1,2,...,m} {hq(~x) = 0, q = 1,2,...,q} S = {F (~x)|~x ∈ X } (3.2)
where~x ∈ Rnis the vector of design variables and n is the number of decision
variables. k ≥ 2 is the number of objective functions and F (~x) ∈ Rkis the objective
con-Figure 3.1: Illustration of Pareto optimal set.
straints and~g(~x) is the inequality constraints vector. q is the number of equality constraints and ~h(~x) is the equality constraints vector. X is the feasible decision space and S is the criterion space.
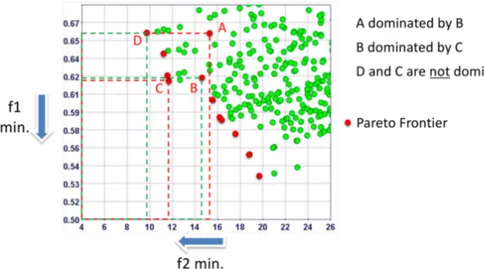
Optimizing a single function simply means determining a set of stationary points and finding the global optimum (absolute minimum or maximum). Differently, identifying an optimal solution for multi-objective problems could be no so easy. Indeed, in case of functions that have opposite characteristics (i.e. what increases the value of one function may results in decreasing the value of another and viceversa) is not so definite what optimum means. Therefore, a central concept when it comes to multi-objective optimizations is the Pareto optimality. In case that none of the objective functions can be improved without worsening the per-formance of the other, the solutions of such problem are called non-dominated and form the so-called Pareto Frontier.
According to the definition proposed by Pareto [80]: "a point x∗in the feasible
design space S is Pareto optimal if and only if there does not exist another point
xin the set S such that f (x) ≤ f (x∗) with at least one f
i(x) < fi(x∗)."
The set of all Pareto optimal points is called the Pareto optimal set (shown in Fig. 3.1). The preceding definition means that x∗can be called Pareto optimal, if no
other point in the feasible space S is present that enhance at least one objective function.
A concept related to Pareto optimality is that of weak Pareto optimality. At these points, it is possible to enhance some objective functions without
worsen-ing others. A weakly Pareto optimal point is defined as [80]: "a point x∗in the
feasible design space S is weakly Pareto optimal if and only if there does not exist another point x in the set S such that f (x) < f (x∗). That is, there is no point that
improves all of the objective functions simultaneously; however, there may be points that improve some of the objectives while keeping others unchanged." Another important concept in multi-objective optimization is efficiency, it is de-fined as [80]:"A point x∗in the feasible design space S is efficient if and only if
there does not exist another point x in the set S such that f (x) ≤ f (x∗) with at
least one fi(x) < fi(x∗). Otherwise, x∗is inefficient. The set of all efficient points
is called the efficient frontier."
Non dominatedand dominated points are other common concepts, which are defined as [80]:"A vector of objective functions f∗= f (x∗) in the feasible criterion
space X is non dominated if and only if there does not exist another vector f in the set X such that f ≤ f∗, with at least one f
i< fi∗. Otherwise, f∗is dominated."
The utopia point in the criterion space is defined as [80]:"a point f0in the crite-rion space is called the utopia point if fi=mi n[fi(x) | for all x in the set S], i = 1
to k. It is also called the ideal point." This point is obtained by minimizing each objective function without considering the other objective functions.
Multi-disciplinary problem
The constantly increasing complexity of engineering systems has led to the devel-oping of Multi-Disciplinary design optimization MDO techniques and to their integration in the design process. MDO simplifies the exploration of interdisci-plinary interactions to reach a better solution.
The first attempts to introduce MDO in the PDP occurred in ’70s and have been progressing since then, showing great capabilities to enhance product perfor-mance and reducing at the same time costs and lead-time. MDO is widely applied in different industrial sectors including automotive, industrial, biomechanics, electronics, aerospace where the interest is particularly intense [79].
According to Sobieszczanski-Sobieski [91] MDO consists of mainly 5 components: Mathematical Modelling, Design-Oriented Analysis, Approximation Concepts, Optimization Procedures, System Sensitivity and Human Interface. The main is-sues in implementing MDO are related to computational costs and organizational challenges. To overcome these limitations numerous strategies and methods have been developed. These includes: All-in-One (A-i-O), Individual Discipline Feasible (IDF), Multidisciplinary Feasible (MDF), Collaborative Optimization
(CO), Concurrent Sub-Space Optimization (CSSO), and Bi-Level Integrated Sys-tem Synthesis (BLISS) methods.
As in any type of optimization process also in the multi-disciplinary one, the choice of a suitable approach to formulate and solving the optimization problem affects the solution results. Balling and Sobieszczanski-Sobieski [91] compared and assessed six different strategies: single-level vs. multilevel optimization, system-level simultaneous analysis and design vs. analysis nested in optimiza-tion and discipline-level simultaneous analysis and design vs. analysis nested in optimization. Two main conclusions can be drawn by their analysis: no single approach is fastest for all implementation cases and no single approach can be identified as being always the slowest. Therefore, the selection of the approach should be realized only after a deep analysis of all the factors involved in the problem.
3.1.2 Optimization techniques
The techniques to solve an optimization problem, constrained or unconstrained, can be classified into three categories (as shown in Fig. 3.2):
1. optimality criteria methods (classical methods); 2. graphical methods;
3. search methods using numerical algorithms.
The optimality criteria methods can be exploited to find the unconstrained maximum and minimum of a function of several variables. The hypothesis at the base of these techniques is that the function is differentiable twice considering the design variables and the derivatives are continuous. The Lagrange multiplier method can be used in case of problems with equality constraints. Otherwise, in case of problems with inequality constraints, the Karush–Kuhn–Tucker (KKT) conditions can be exploited to reach the optimal condition. A great disadvantage of these methods is the fact that they can lead to equations difficult to solve. Graphical methods are very simple approaches that can be used only when max-imum two design variables have to be optimized. They are able to solve both linear and non linear problems. Graphical techniques are able to clearly repre-sent the feasible region and iso-lines of the objective functions. In this way it is possible to identify in a very simple way the optimal solutions.
Optimization methods Optimal criteria methods Graphical
methods methodsSearch
Gradient-based methods Non-gradient methods
Figure 3.2: Classification of solution techniques for optimization problems.
It is important to highlight that neither classical methods nor graphical methods ask for numerical calculations to achieve a solution.
The most common and used techniques to solve for optimality are search meth-ods based on numerical calculations. These methmeth-ods look for the optimal so-lution in an iterative way beginning from an initial design point. To drive the optimum search process some approaches rely on gradient information, i.e. derivatives of objective and constraint functions with respect to design variables. These techniques are called gradient-based techniques. Other approaches exploit certain rules that do not require for gradient information in the searching process. These are named non-gradient-based techniques. Gradient-based methods are accurate algorithms while non-gradient-based methods are robust algorithms. The robustness of an optimization algorithm is the ability to reach the absolute extreme of the objective function. While, the accuracy measures the capability of the optimization algorithm to find the extreme of the objective function. Robust algorithms reach global extremes while, Non-Robust algorithms get stuck in local extremes.
Gradient-based approaches
Gradient-based approaches have a solution strategy based on the calculation of the derivatives of objective and constraint functions exploiting numerical algorithms. They are able to solve both constrained and unconstrained problems
Figure 3.3: Illustration of the gradient-based search method.
of one or more design variables. As every numerical approach, also the gradient-based one starts from an initial design point. Through an iterative process, it searches for a local minimum (or maximum) that is the nearest to the initial point. In case of constrained problems, if the initial design is in an infeasible region, the first goal of the algorithm is to bring the research into a feasible zone. A stopping criterion needs to be defined to terminate the search when a local optimum is found. After a certain number of design iterations, the stopping criterion must stop the research even if no optimal solution is found.
In Fig. 3.3 is illustrated the main procedure of a gradient-based algorithms. An initial design is given as x0. The derivative of the objective function in x0 is
computed as f0(x). The search direction is determined by the derivative of the
objective function f0(x0). Once the search direction is defined, the step size
is researched. Typically, a large stepδx size is assumed. Once x1= x0+ δx is
determined, the objective function f (x1) and its gradient f0(x1) are calculated.
The same step size is usually used to find the next design until the search direction is reversed. Once it is reversed, the step size is decreased toδx/2. This iterative
process stops when the convergence criterion is reached. The convergence criterion can be defined in different ways.
Non-gradient-based approaches
The non-gradient-based approaches, unlike the gradient based ones, use only the values of the objective functions without taking into consideration gradient information. These kinds of method are very general and can be applied to a wide variety of engineering problems. Moreover, they are able to find global opti-mum solutions as opposed to the local optiopti-mum determined by gradient-based approaches. Even if no gradient has to be calculated, the solution process is an expensive process since a great deal of function evaluations is required. For large-scale problems that will result in long computational time. Furthermore, there is no certainty that a global optimum can be found. The most popular and representative algorithms of the non-gradient approach are the genetic algo-rithms (GAs) [14].
The genetic algorithms are very general algorithms that can be applied to all different types of problem: continuous, discrete, non-differentiable. Moreover, these methods are easy to use and program and achieve global optimum solu-tions. GAs are based on Darwin’s theory of natural selection: survival of the fittest. The idea at the base of these methods is to begin with a set of designs generated in a random way. A fitness value is attributed to each design point. A subset, from the in-use set of designs, is randomly selected with a bias assigned to the fittest elements of the set. New design points are generated through a random process from the picked subset of designs. As new designs are generated from the elements of the set with higher fitness values, the probability to have more fit design in the next sets is greater. The process is iterated until stopping criterion is encountered.
The main phases of genetic algorithms can be synthesized in the following steps (as shown in Fig. 3.4):
1. GAs iteration starts with the definition of an initial population (design points are generated using the allowable values for each design variable) and of a fitness function;
2. fitness values are evaluated and assigned to the respective designs; 3. reproduction, a set of design are selected (the selection is biased toward
the more fit elements) from the current population and carried into the next one;
Figure 3.4: Genetic algorithms sequence.
4. crossover, picked elements of the new generation exchange characteristics among themselves;
5. mutation, this process avoids that the reproduction and crossover phases result in a loss of valuable genetic materials;
6. if the stopping criterion is met the optimization is concluded and the optimum is found.
Scientific literature reports various genetic algorithms to be used in solving optimization problems. The most used ones are the MOGA-II [47], in case of objective problems on discrete base, and the NSGA-II [47], in case of multi-objective problems on continuous base.
Meta-models
Many practical engineering design problems require detailed and rich model of the system to predict system response under different conditions. These models
can be very large and complex, requiring long computational time to be solved. Optimization of these systems can be almost impossible. To solve this kind of issue, meta-modelling techniques have been developed.
Response Surface Methodology - RSM [15] consists of a group of statistical and mathematical techniques useful in the development, improvement and opti-mization of systems/processes/services. This method is widely used in industry, especially in situations where there are many input variables that potentially affect the measurements of the system characteristics [52]. The goal is to si-multaneously optimize the levels of these variables in order to obtain the best performance. Input variables (or independent variables), the values of which can be controlled and set by the experimenter, are called factors. The response variable (or dependent variable) is the measured quantity, the value of which is affected by the levels factors changes. The application of RSM takes concrete form by determining the approximate functional relationship between the input variables and the response of the system to be optimized. Typically, second order polynomials expressions are used. The relationship between the response and the inputs is given by:
y = f (x1, x2,..., xn) + ² (3.3)
where y is the response, f is the unknown function of response, x1, x2, . . . , xn
denote the independent variables, n is the number of the independent variables and² is the statistical error. Epsilon is generally assumed to have a normal
distribution with mean zero and variance. RSM consists of the following steps: 1. Choice of the factors of major effect on the system and delimitation of the
experimental domain;
2. Design a set of experiments in order to have adequate and reliable measures of the interest response;
3. Determine the mathematical model that best interpolates data obtained from designed experiments;
4. Identify the optimum values for the input variables that lead to the maxi-mum(or minimum) value of the response.
To design the set of experiments on which developing the meta-model, De-sign of Experiments techniques can be used. The DeDe-sign of Experiments [16] is a statistical methodology to approach the design and organization of experiment
that allows to get as much information as possible with the minimum amount of resources (i.e. with the smaller number of experiments). Usually, the most immediate experimental procedure consists in performing one or more tests, for each value of the investigated independent variables, leaving unchanged all the other conditions: One Factor At a Time (OFAT) approach. OFAT method does not study contemporary the variations effects of two or more parameters. On the other hand, the DoE methodology is based on tests characterized by the simulta-neous variation of more parameters [36]. The first step of the DoE is the choice of the factors, the number of the levels, the range of the variability intervals and the response variables. Then, the proper experimental design is defined and the experiment is realized. Finally, the obtained data are statistically processed to generate the response surface. There is a large amount of experimental designs in the literature.
The response of a system may be affected by several factors and it is practically impossible to identify and study each minimum contribution. Additionally, more are the effects to consider and less accurate will be the experimental fitting of the obtained data. Therefore, to limit the usage of computational resources and to increase the accuracy of the analyses, it is necessary to choose those factors with the greatest impact on the response. In case of complex design, where it is not easy to know the cause-effect relationship between factors and response, a screening design should be carried out to find out those variables with the most significant effects.
3.1.3 Current Challenges in Optimization
According to scientific literature review, various are the challenges in design optimization [14]. In particular, we can cite: constraints handling, large-scale optimization and speed-up the optimization process.
Constraint handling
Engineering design optimization problems frequently involves a number of con-straints, which can derive from different design aspects such as safety, regu-lations, customer’s requirements and/or limit on time and resources. From a mathematical point of view, constraints have the effect to make unfeasible a more or less large portion of the searching area. As a consequence, optimization methods struggle in searching for optimum design through restricted feasible
![Figure 3.5: Knowledge hierarchy model [1].](https://thumb-eu.123doks.com/thumbv2/123dokorg/2967813.27053/46.892.177.717.182.431/figure-knowledge-hierarchy-model.webp)

![Table 5.5: Wind load calculation values according to ASCE/SEI 7-05 [4].](https://thumb-eu.123doks.com/thumbv2/123dokorg/2967813.27053/113.892.183.723.221.595/table-wind-load-calculation-values-according-asce-sei.webp)
