Relationship Between the Chondrocyte Maturation
Cycle and the Endochondral Ossification in the
Diaphyseal and Epiphyseal Ossification Centers
Ugo E. Pazzaglia,
1* Terenzio Congiu,
2Valeria Sibilia,
3Francesca Pagani,
3Anna Benetti,
4and Guido Zarattini
11
Department of Medical and Surgical Specialties, Radiological Sciences and Public Health,
University of Brescia, Brescia, Italy
2
Department of Surgical and Morphological Sciences, University of Insubria, Varese, Italy
3
Department of Medical Biotechnology and Translational Medicine, University of Milan, Milan, Italy
4Department of Clinical and Experimental Sciences, University of Brescia, Brescia, Italy
ABSTRACT
The chondrocyte maturation cycle and
endochondral ossification were studied in human, fetal
cartilage Anlagen and in postnatal meta-epiphyses.
The relationship between the lacunar area, the
inter-territorial fibril network variations, and calcium
phos-phorus nucleation in primary and secondary
ossifica-tion centers were assessed using light microscopy and
scanning electron microscopy (SEM) morphometry. The
Anlage topographic, zonal classification was derived
from the anatomical nomenclature of the completely
developed long bone (diaphysis, metaphyses and
epi-physes). A significant increase in the chondrocyte
lacu-nar area was documented in the Anlage of epiphyseal
zones 4 and 3 to zone 2 (metaphysis) and zone 1
(dia-physis), with the highest variation from zone 2 to zone
1. An inverse reduction in the intercellular matrix area
and matrix interfibrillar empty space was also
docu-mented. These findings are consistent with the osmotic
passage of free cartilage water from the interfibrillar
space into the swelling chondrocytes, which increased
the ion concentrations to a critical threshold for
min-eral precipitation in the matrix. The minmin-eralized
carti-lage served as a scaffold for osteoblast apposition both
in primary and secondary ossification centers and in
the metaphyseal growth plate cartilage, though at
dif-ferent periods of bone Anlage development and with
distinct patterns for each zone. All developmental
proc-esses shared a common initial pathway but progressed
at different rates, modes and organization in diaphysis,
metaphysis and epiphysis. In the ossification phase the
developing vascular supply appeared to play a key role
in determining the cortical or trabecular structure of
the long bones. J. Morphol. 000:000–000, 2016.
VC 2016 Wiley Periodicals, Inc.KEY WORDS:
bone
development;
cartilage
Anlage;
chondrocyte maturation cycle; mineral deposition;
endo-chondral ossification
INTRODUCTION
During human embryonic development, the limb
buds appear at approximately 4 weeks of age
(3.5 mm in length, Streeter stage 12). The upper
limb buds can be observed slightly earlier than
the lower ones. Between the 6th and 9th weeks of
development, the cartilage Anlagen of the major
bones are formed (Streeter, 1951; Uhthoff, 1990).
The initial ossification in the late embryonic
period (O’Rahilly and Gardner, 1972) continues
throughout the fetal and early postnatal periods.
The secondary ossification centers of the epiphyses
appear after birth in humans (Vogt and Vickers,
1938; Noback, 1944; Greunlich and Pyle, 1959;
Caffey, 1973). The cartilage growth model is
char-acterized by the chondrocyte maturation cycle,
which, combined with matrix synthesis, represents
the first step in endochondral ossification. These
processes are differently distributed in the Anlage
zones and lead to the formation of the diaphyseal
cortex or to the trabecular bone of epiphyses and
metaphyses (Ballock and O’Keefe, 2003).
The most frequently used model in the study of
the chondrocyte maturation cycle and
endochon-dral ossification is the metaphyseal growth plate
in experimental animals (Wilsman et al., 1966a,b;
Hunziker et al., 1987; Farnum and Wilsman,
1993), where there is an evident ordered and
sequential progression of the two aspects, that
control the longitudinal growth of the bone. The
Conflict of interest: None of the authors had conflicts of interests. Contract grant sponsor: “Medical and Surgical Specialties, Radiologi-cal Sciences and Public Health Department” of the University of Brescia.
*Correspondence to: Ugo E. Pazzaglia, Department of Medical and Surgical Specialties, Radiological Sciences and Public Health, University of Brescia, Brescia, Italy.
E-mail:[email protected]
Received 19 November 2015; Revised 16 May 2016; Accepted 26 May 2016.
Published online 00 Month 2016 in
Wiley Online Library (wileyonlinelibrary.com). DOI 10.1002/jmor.20568
fetal cartilage Anlagen exhibit an earlier
develop-mental stage than the metaphyseal growth plate
does. The proliferation pattern of the cells is not
ordered in this way but is also oriented in columns
in zone 2, which corresponds to the metaphysis
of
the
later
bone
development.
The
three-dimensional symmetric or asymmetric distribution
of growth only defines the rough globular shape of
a short bone or the elongated shape of a long bone
(Pazzaglia et al., 2011).
This study assesses the chondrocyte lacunar
area rather than volumetric parameters of the cell
to improve measurement accuracy because lacunae
exhibit fewer processing artifacts than
chondro-cytes do. The number of lacunae, their density, the
total lacunar area and the intercellular matrix
area can be compared in histological fields of equal
size in the cartilage Anlage zones. Mineral
deposi-tion on the cartilage matrix and the related
endo-chondral
ossification
is
correlated
with
the
chondrocyte maturation cycle (Bonucci, 2007). The
latter begins at different time points in different
ossification centers of the same Anlage but with a
basic common pattern, that produces a different
structural layout in the diaphyseal ossification
center, the epiphyseal and the metaphyseal growth
plate cartilage. Therefore, the study has been
extended to include available histological slides of
early postnatal human bones, in which the
epiphy-seal and metaphyepiphy-seal chondrocyte maturation
cycle can be evaluated in corresponding zones in
the two age groups.
The aims of the study are: (1) to examine the
correlation of the chondrocyte maturation cycle
(through lacunar size parameters) with the
associ-ated interterritorial matrix transformation which
leads to calcium phosphorus nucleation; (2) to
evaluate
chondrocyte
morphology
definition,
distribution and temporal sequence in the Anlage
of the ossification centers development; and (3) to
compare the structural layouts of diaphyseal and
epiphyseal ossification.
MATERIALS AND METHODS
Light Microscopy Histology
The histological material for the study was obtained through a retrospective analysis of the Morbid Anatomy slide archives, where all pregnancy terminations are routinely examined. An initial selection of cardiovascular and brain malformation cases without skeletal dysmorphia (assessed by prenatal ultrasound diagnosis) was made. The pregnancies were terminated between the 16th and 22nd week. The examined material did not allow the assessment of fetal length. The inclusion criteria required that slides comprised whole bone cartilage Anlagen or the appropriately oriented proximal/distal area (longitudinal section). Twelve samples (including several Anlagen) were selected. The study protocol was approved by the Council of the Department of Medical and Surgical Specialties, Radiological Sciences and Public Health of the University of Brescia.
All Anlagen of the limbs showed the same cycle of chondro-cyte maturation, but its development was delayed in the distal limbs Anlagen compared to the proximal limbs Anlagen. Furthermore, the development of the lower limbs was slightly delayed compared to the upper limbs. Therefore, in fetuses between the 16th and 22nd week the cartilage Anlagen which corresponded to the histological stages 3b–7 according to the Rivas and Shapiro classification (2002) were examined.
Fifty-nine longitudinal Anlagen of cartilage in histological slides from 12 fetuses satisfied the inclusion criteria: 28 meta-carpals and metatarsals; 16 phalanges; 15 humeri, radii/ulnae, femura and tibiae/fibulae. The tissue specimens had been fixed in neutral formaldehyde solution (10%), dehydrated in a series of increasing ethanol solution concentrations and embedded (undecalcified) in paraffin blocks. Ten micrometer thick sections were produced and stained with hematoxylin-eosine, Alcian blue (pH 1), PAS and the von Kossa method. Sections were then mounted on glass slides and observed with an Olympus BX51 microscope.
Histology of the meta-epiphyseal postnatal development was obtained from slides of the senior author’s educational collec-tion. These include four cases: two proximal tibiae (2 and 3 months after birth) and two proximal humeri (3 and 5 months Fig. 1. Human fetal, 2nd metacarpal, 20th week (Von Kossa-neutral red/bar 5 500 mm). Skeme
showing the boundaries used for zones definition and morphometry. 1—mid-shaft diaphysis, 2— proximal and distal diaphysis, 3—central epiphysis; 4—peripheral epiphysis; see text for details.
after birth). The glass slides had been registered as “normal bone development” by the anatomist who collected the samples, which indicated that the children had died from causes unre-lated to bone pathology. Both of the tibiae and one humerus had been decalcified, routinely processed and stained with hematoxylin-eosine. The 5-months-old humerus had been
embedded undecalcified in methylmetacrylate and stained with the solochrome method. The postnatal epiphysies area was measured by tracing the epiphyseal contour on a graphic tablet (excluding the growth plate) and counting the number of carti-lage canals with a low power stereo microscope (Olympus SZX7, Japan) at 203 magnification. Individual canals were Fig. 2. Human fetal, middle phalanx of 2nd finger. (A) 17th week, hist. stage 3a (hematoxylin-eosin/bar 5 200 mm). Chondrocyte hypertrophy in the Anlage zone 1) prior to mineral deposition. The chondrocytes are randomly distributed in both zone 1 and in the epiphyses. In zone 2, cell lacunae appear flattened and aligned longitudinally (arrow). The periosteum surrounds zone 1 and osteo-blasts have formed an uncalcified thin layer of the periosteal sleeve. (B) 20th week, hist. stage 4a, 3rd metacarpal (Hematoxylin-eosin/bar 5 200 mm). The hypertrophic chondrocyte zone 1 is circularly enveloped by a periosteal sleeve of enhanced thickness. A layer of periosteal osteoblasts is present on the external surface. Swollen chondrocytes and mineral deposition are apparent in zone 1. An increased width of zone 2 reveals a more apparent stacking of chondrocyte columns than in A. (C) 20th week, hist. stage 4a, 3rd metacarpal (Von Kossa-neutral red/bar 5 200 mm). The same slide in B documents the mineral deposition on the matrix between the enlarged chondrocyte lacunae. Dark spots inside the lacunae are artifacts. The periosteal sleeve appears densely calcified and does not expand beyond the mineralized zone 1. (D) 22nd week, hist. stage 5a, humerus (hematoxylin-eosin/bar 5 1 mm). Periosteal apposition and remodeling have formed the diaphyseal cortical bone, whereas the zone 1 mineralized cartilage has undergone resorp-tion. Few primary trabeculae inside the marrow canal are undergoing remodeling. Zone 2 chondrocytes reveal longitudinal columns of the metaphyseal growth plate cartilage. The epiphyses are cartilagineous without inner canals.
considered independently of their shape (circular, elongated or branched).
Light Microscopy Morphometry
For morphometry a stricter selection of the 59 available car-tilage Anlagen (based on orientation) was carried out: 15 whole metacarpals and metatarsals, 10 phalanges, 4 humeri, 2 radii/ ulnae, 2 femura and 2 tibiae/fibulae were selected. The topo-graphic zonal classification used in the current study is derived from the commonly used anatomical nomenclature of the com-pletely developed long bone. This method allows the relation-ship between the chondrocyte maturation cycle and the ossification process in the human fetal cartilage Anlagen to be evaluated with regard to the lacunar area and the cartilage interfibrillar area. Zones of the whole cartilage Anlage have been demarcated as shown in Figure 1: 1—mid-shaft diaphysis, corresponding to the central part of the cartilage model where the intercellular matrix has been calcified and the outer perim-eter delimited by the first periosteal sleeve; 2—proximal and
distal diaphysis not yet surrounded by a periosteal bony sleeve, characterized by enlarging chondrocytes and not yet calcified intercellular matrix; 3—central epiphysis; and 4—peripheral epiphysis, corresponding to the outer cartilage layer at approxi-mately1=4of the epiphyseal radius.
Morphometry was carried out at 4003 magnification on hematoxylin-eosine stained sections. Randomly selected fields (30 or 20 in each zone) corresponded to an area of 218.63 3 163.63 mm (0.035 mm2). The following parameters were
assessed: the number of chondrocyte lacunae, the total chondro-cyte lacunar area (TCLA), the mean single chondrochondro-cyte lacunar area (MSCLA) and the total matrix area (TMA) (calculated from the difference between the total field area and the TCLA). The digital images were obtained using a Color View IIIb cam-era (Soft Imaging System GmbH, Germany) and processed using Adobe Photoshop, delimiting the outline of each chondro-cyte lacuna and staining the area black with the fill function (bucket). The lacunae that were intersected by the field edge were counted and measured. The total number of chondrocyte lacunae, their density, the TCLA, the MSCLA and the TMA were determined with ImageJ (Schneider et al., 2012) using the color threshold function which allows the black stained chon-drocyte lacuna to be distinguished from the neighboring matrix.
In the early postnatal specimens (two proximal tibiae and two humeri) 30 randomly selected fields (4003 magnification) of the proximal tibial and humeral epiphyses (zone 5) and the corresponding metaphyseal growth plate cartilage hypertrophic cell layer (zone 6) were analyzed using the same parameters as the fetal bone cartilage Anlagen (zone 5 vs zone 3 and zone 6 vs zone 1). The early secondary ossification center zone of the older humeral head was excluded from morphometry field sam-pling and was only used for morphological documentation of the secondary ossification center.
Cartilage canals had not yet formed in any of the examined fetal Anlagen and could only be quantified in the postnatal epi-physes. Canal density was expressed in the total epiphyseal area, which was measured manually using the “Cells” software (Soft Imaging System GmbH, Germany).
Scanning Electron Microscopy
Unstained histological glass slides from the same paraffin mounts of fetal and early postnatal specimens were processed for observation (Pazzaglia et al., 1987). After deparaffination, slides were dehydrated in increasing concentrations of ethanol solution and subjected to CO2critical point drying. The slides
were then coated with a thin layer of gold in a sputter coater (Emitech) and observed using a Philiphs XL 30 scanning elec-tron microscope. X-ray energy dispersive spectra were obtained from SEM fields (20.0003 magnification) to document CaP nucleation.
Assessment of the matrix interfibrillar, empty area was car-ried out on SEM digital images of the longitudinally sectioned surfaces. These were acquired in the backscattered mode (4.0), with the electron beam perpendicular to the plane of the sec-tion, at 20 kV and 10 mm of working distance. The same mag-nification of 25.0003 was used for all sections. The cartilage interfibrillar empty space and was measured in 20 randomly selected fields (corresponding to an area of 4.85 3 3.67 mm, 5 17.8 mm2) of metacarpals bone Anlage zone 3, 2, and 1
(with exclusion in the latter of the fields where mineral deposi-tion had already occurred). The total field area, the cartilage interfibrillar empty area and its percentage was assessed with the Image J with the same contrast enhancement in all the fields and using the binary threshold function. The interfibrillar empty area (black) and its percentage of the total field area were compared between zone 3 vs 2 and in zone 2 vs 1 in the same metacarpals.
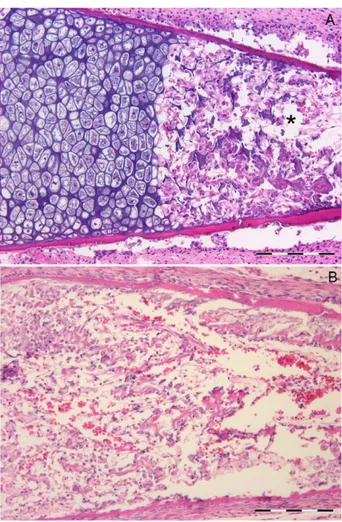
Fig. 3. Human fetal, proximal ulna. (A) 20th week (hematoxy-lin-eosin/bar 5 200 mm). Mineralized cartilage of zone 1 is under-going resorption (asterisk) by the vessels from the mid-diaphysis (branches of the central medullary artery). No vessels are observed to pierce through the sleeve from the periosteal net-work. (B) 20th week, radius (hematoxylin-eosin/bar 5 200 mm). Advanced resorption of zone 1 mineralized cartilage and wide-spread medullary vessel network. There is not calcified cartilage that can serve as a scaffold for secondary trabeculae formation.
Statistical Analysis
The accuracy of lacunar outline delimitation (carried out man-ually) was tested comparing the repeated measurements of total chondrocyte lacunae area (independently obtained by two inves-tigators U.E.P. and T.C.) on a sample of 20% of the histological
fields equally distributed for each zone. The intra-observer and inter-observer variation (Bland and Altman, 2010) has shown an acceptable degree of agreement (95% confidence interval).
The assessed parameters (TCLA, TMA, chondrocyte lacunae number (CLN), MSCLA) were represented as the mean 6 standard error of the mean (SEM). TCLA and TMA were Fig. 4. Human fetal, proximal humerus. (A) 22nd week, (hematoxylin-eosin/bar 5 500 mm). Fetal epiphysis prior to the development of cartilage canals. (B) postnatal 3 months old, lproximal humeral epiphysis (hematoxylin-eosin/bar 5 4 mm). A cartilage canal sys-tem has developed in the epiphysis without any evidence of chondrocyte maturation cycle activation. No secondary ossification center is evident. Fetal zone 2 is reduced to the thickness of its own metaphyseal growth plate (defined by the lateral and medial bars). (C) postnatal 3 months old, proximal humeral epiphysis (hematoxylin-eosin/bar 5 500 mm). The origin of the cartilage canals system with connective-vascular sprouts entering into the epiphysis. (D) postnatal 3 months old, proximal humeral epiphysis (hematoxylin-eosin/ bar 5 100 mm). Vascular lacunae delimited by a single endothelial layer and structured vessels with a “tunica muscularis”. Loose con-nective tissue fills tha canal between vascular lacunae. (E) Postnatal 5 months old proximal humerus (SEM backscattered). The sec-ondary ossification center of the epiphysis reveals hypertrophic chondrocyte columns converging centripetally (arrow). Vessels (asterisk) have reached the center through the epiphyseal cartilage canal system. The metaphyseal cartilage is evident on the right side with the longitudinally and orderly oriented hypertrophic chondrocyte columns. Thin metaphyseal vessels advance between the calcified cartilage septa.
expressed either as absolute values or as TCLA/TMA. Data were analyzed by one way Analysis of Variance (ANOVA) fol-lowed by multiple comparison Bonferroni t-test. Differences between the groups were analysed using an unpaired t-test. The comparison of the matrix interfibrillar empty area (carried out with SEM) among zones 3, 2, and 1 was analyzed with an unpaired Student
t-test. Values of P < 0.05 were considered statistically significant.
RESULTS
Light Microscopy Histology
Between the 16th and 22nd weeks of
develop-ment, the chondrocyte maturation cycle prior to
the commencement of mineral deposition (stage
3b) can be observed in the hands and distal foot
phalanges (Fig. 2A), and the next developmental
phase (stage 4a) can be observed in the proximal
phalanges, metacarpals and metatarsals Anlagen
(Fig. 2B,C). Development in the proximal limbs is
more advanced than in the distal limb (stage 5a)
with a well-structured diaphyseal cortex apparent
(Fig. 2D). Therefore, even in the limited fetal time
interval of the current study, the differential lag
between bone Anlagen development is apparent in
a sufficiently ample histological documentation.
The definition of zones 1 and 2 boundaries at
stage 4a is precisely demarcated by the mineral
deposition on the cartilage (Fig. 1). The definition
of zones 3 and 4 is based on the previously
reported topographic criterion.
After mineral deposition on zone 1 cartilage
matrix the diaphyseal ossification continues with
osteoblasts layer differentiation on the external
surface of the Anlage and the development of the
periosteal vascular network (Fig. 2B). In all
stud-ied Anlagen, the zone 1 calcifstud-ied cartilage matrix
appeared to serve as a scaffold for early
osteo-blasts apposition but did not take part in further
cortex formation. The diaphyseal circumference
increases through eccentric, periosteal apposition,
while the inner calcified cartilage zone 1
under-goes chondroclast resorption and substitution by
the developing marrow vascular network and by
red marrow tissue (Fig. 3A,B). The periosteum
advances both proximally and distally towards
zone 2, where chondrocytes are becoming
hyper-trophic and align longitudinally. In the proximal
limb Anlagen (humerii, radii/ulnae, femura, tibiae,
and fibulae), a medullary vascular network has
been formed by the branches of the central
nutri-tive arteries. The hypertrophic chondrocyte and
the calcified matrix of zone 1 are undergoing
resorption.
Cartilage canals have not been observed in fetal
Anlage of the meta-epiphyses at up to 22 weeks of
age (Fig. 4A), but they are commonly observed in
the early postnatal period before the appearance
of the secondary ossification centers (Fig. 4B and
Table 1). Cartilage canals enter into the
cartilagi-neous epiphyses from the peripheral border (Fig.
4C) or across the metaphyseal growth plate. They
can only contain loose connective tissue or
vascu-lar lacunae surrounded by a simple endothelium
and vessels with a structured wall (Fig. 4D). The
initial development of the secondary ossification
center in this series was only observed in the
5-months-old proximal humerus (Fig. 4E). These
results demonstrate the same chondrocyte
matura-tion cycle as in zone 1, but with a different
ossifi-cation pattern.
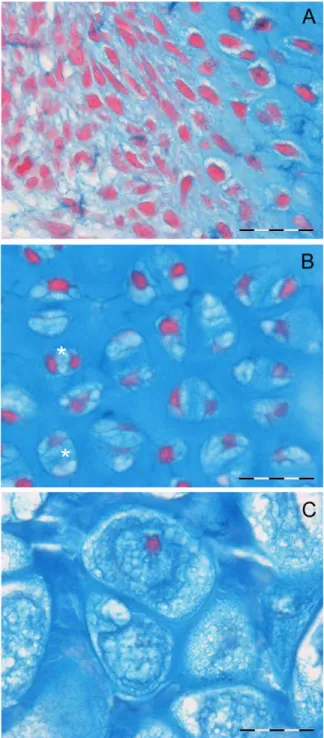
The chondrocyte cytology during the course of
the maturation cycle is characterized by
cytoplas-mic vacuole formation and size increase.
Chondro-cytes are smaller and round-shaped in fetal zone
3, and their volume greatly increases in zones 2
and 1. Cells are stained by Alcian blue, no PAS
positive deposits can be observed inside
intracyto-plasmic vacuoles. Nuclear pyknosis is commonly
observed in zone 1 chondrocytes (Fig. 5).
Light Microscopy Morphometry
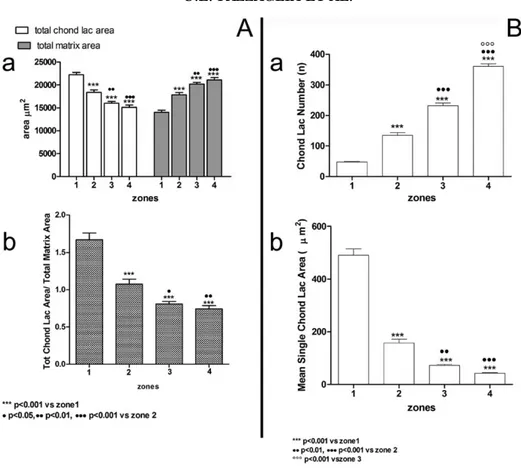
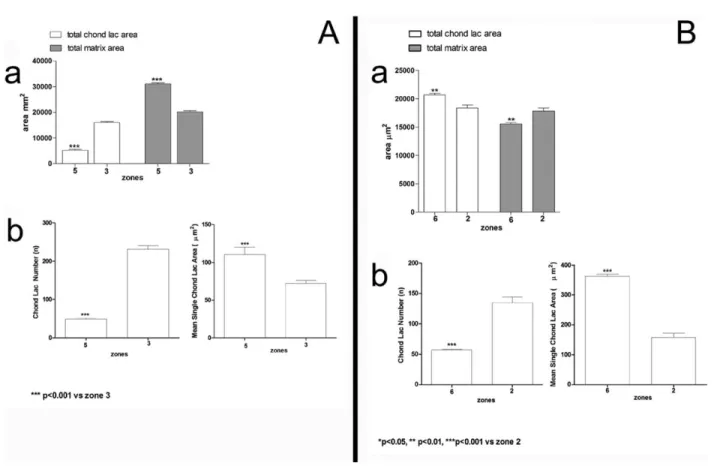
The
TCLA
in
fetal
Anlagen
significantly
increases from zones 4 and 3 of the epiphyses to
zones 2 and 1 of the diaphyses (P < 0.001). The
total
intercellular
matrix
area
significantly
decreases from zone 4 to zone 1 (P < 0.001). The
highest increments related to the chondrocyte
lacunar area parameters between zones 2 and 1
correspond to the sector of the cartilage Anlage
where mineral deposition in the matrix is
occur-ring (Fig. 6A). In line with the above reported
data, the ratio between the TCLA and total matrix
area (TMC) decreases significantly from zone 1 to
4 (Fig. 6A). This corresponds to an increment of
the CLN from zone 1 to 4 (Fig. 6B) and the
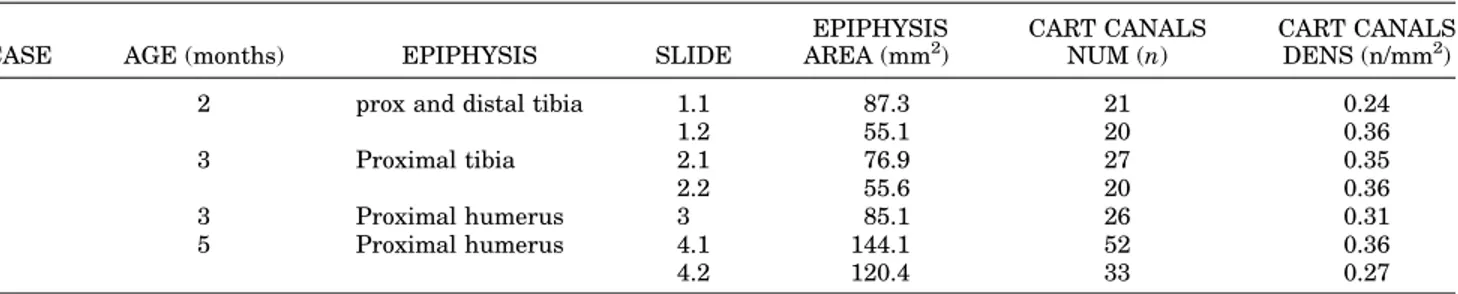
TABLE 1. Postnatal bone epiphyses area, number and density of cartilage canals
CASE AGE (months) EPIPHYSIS SLIDE
EPIPHYSIS AREA (mm2) CART CANALS NUM (n) CART CANALS DENS (n/mm2)
1 2 prox and distal tibia 1.1 87.3 21 0.24
1.2 55.1 20 0.36 2 3 Proximal tibia 2.1 76.9 27 0.35 2.2 55.6 20 0.36 3 3 Proximal humerus 3 85.1 26 0.31 4 5 Proximal humerus 4.1 144.1 52 0.36 4.2 120.4 33 0.27
inverted
relationship
of
the
latter
with
the
MSCLA (Fig. 6B).
Histological
analysis
of
postnatal
epiphyses
(zone 5) with the corresponding fetal central
epiphysis (zone 3) reveals a significantly lower
TCLA and a higher TMA (both P < 0.001) (Fig.
7A). Zone 5 exhibits a reduction in CLN with a
concomitant increase in the MSCLA (Fig. 7A).
The hypertrophic cell layer in the postnatal
growth plate (zone 6) exhibits TCLA values higher
than those of fetal zone 2 (P < 0.01) and the TMA
is significantly lower than that in zone 2 (P < 0.01;
Fig. 7B). The CLN is significantly lower in zone 6
than in zone 2 (P < 0.001) and the MSCLA is
sig-nificantly higher (P < 0.001) between the same
zones (Fig. 7B).
In summary, the morphometric analysis
docu-mented
inversely
related
chondrocyte
and
matrix size parameters in fetal zone 4 and 1. A
similar trend was observable in postnatal
meta-epiphyses.
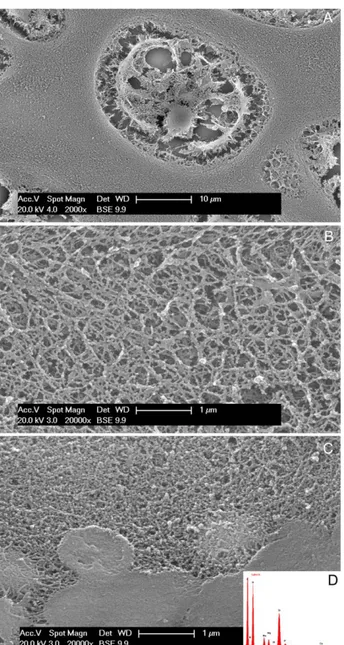
Scanning Electron Microscopy
Scanning electron microscopy observation of
deparaffinized sections can be affected by technical
artifacts because the cell membrane can partially
detach from the lacunar border. Artefactual tears
and shrinkage are present in most of zone 1 and
zone 2 chondrocytes. However, a few cells that
were still connected to the lacunar border were
found. The large
cytoplasmic
vesicles appear
empty after processing and their content remains
unidentified, but should have originally held a
well hydrated content (Fig. 8A). The intercellular
matrix is formed by a reticular network of loose
collagen fibrils in the epiphyses (zone 3; Fig. 8B).
The network becomes more compact in zone 2, and
the fibrils appear tightly packed in zone 1, with
patches of dense material deposed on the fibrils
network (Fig. 8C). X-ray energy dispersive spectra
reveal dense plaques with the typical calcium and
phosphorus spectrum in accordance with zone 1
(Fig. 8D). No sign of calcium phosphate deposits
was found in any field in zones 3 and 2.
At higher magnification, the matrix interfibrillar
empty space was observed to decrease gradually
from zone 3 to 1 (Fig. 9A), which has been
statisti-cally analyzed (Fig. 9B).
The proximal humerus coplanar section of the
postnatal 5-month-old meta-epiphysis, including
both the secondary ossification center and the
metaphyseal growth plate, directly demonstrates
the hypertrophic chondrocyte structural pattern
and the vascular network . The metaphyseal
growth plate exhibits longitudinally organized
col-umns with thin, parallel vascular spaces between
the straight calcified cartilage septa (Fig. 4E). In
the secondary ossification center, the same
col-umns are arranged in a less orderly pattern, but
Fig. 5. Human fetal, 3rd metacarpus. (A) 20th week, (Alcian blue-neutral red/bar 5 20 mm). Perichondrium and zone 4 chon-drocytes characterized by a high rate of cell proliferation, small cell size and scanty intercellular matrix. (B) 20th week, 3rd metacarpal (Alcian blue-neutral red/bar 5 20 mm). Chondrocyte maturation pattern in zone 3, characterized by larger lacunar and cell size, small intracytoplasmic vescicles and increments of the intercellular matrix mass. The paired chondrocytes (aster-isks) inside a unique lacuna are an evidence of cell intralacunar duplication which characterizes cartilage interstitial growth. (C) 20th week, 3rd metacarpal (Alcian blue-neutral red/bar 5 20 mm). Swollen chondrocyte of zone 1 characterized by massive increment of the lacunar area. The cell inside is also enlarged due to dilated cisterns or cysts. Artifactual tears suggest a fluid content of the latter. Nuclei are picnotic.
exhibit a recognisable pattern that converges
cen-tripetally, with vessels present in opposite
direc-tion emerging from a large, central vascular space
(Fig. 4E). This vascular space is supplied by the
vessels entering into the epiphysis through the
cartilage canals network.
DISCUSSION
Enchondral bones of vertebrates develop from a
cartilaginous Anlage in which the bone shape is
already well defined before ossification begins
(Uhthoff, 1990; Pazzaglia et al., 2011).
Earlier studies on the chondrocyte maturation
cycle have been carried out in the metaphyseal
growth plate cartilage (Buckwalter et al., 1986;
Hunziker et al., 1987; Hunziker, 1994; Wilsman
et al., 1996a, b; Ballock and O’Kneefe, 2003) and
have focused on chondrocyte metabolic activity,
shape/volume modulation and the relationship
with the matrix mineralization. However, to the
best of our knowledge, no research has yet been
carried out in human fetal cartilage Anlagen to
examine a morphological/morphometric basis for
the above referenced biological processes and their
relationship with the developmental patterns of
primary and secondary ossification centers. These
ossification centers develop from the diaphysis
zone 1 and the epiphysis zone 3 of the cartilage
Anlage with different dynamics and structural
lay-outs compared to the metaphyseal growth plate.
In particular, the chondrocytes of zone 1 (confined
in a close environment that soon becomes
sur-rounded by the periosteal sleeve) offer a
character-istic model for the effects of fluid diffusion
between the cells and the matrix.
The current study has some limitations:
1. Fetal age (16th–22nd week) and retrospective
analysis of histological slides do not permit fetal
length assessment. However, due to the
develop-mental lag among Anlagen in the single fetuses,
it was possible to pool the Anlagen according to
Rivas and Shapiro (2002) histological staging.
The rabbit gestation period is approximately 30
days compared to 9 months in humans, but an
extrapolation of the staging is possible because
the basic morphology and the sequence of the
cartilage Anlage transformations do not differ
between the species.
2. The orientation of cartilaginous Anlagen was
obtained by selecting slides that included a
com-plete, longitudinal section or at least half
(mid-sector and epiphysis) of the Anlage.
Fig. 6. (A) Histograms documenting the reciprocal variation of TCLA and TMA from zone 1 to 4 in fetal Anlagen (a). The ratio between the two paramenters significantly decreases from zone 1 to 4 (b). (B) Histograms documenting the increase in CLN from zone 1 to 4 (a) and the decrease in the MSCLA (b) in the same zones.
3. One meta-epiphysis from each postnatal age (2,
3, 3, and 5 months) was longitudinally oriented
before histological processing.
4. Artifacts occur due to processing of SEM
depar-affinized sections, the same used for light
microscopy. These were used mainly for
mor-phology and morphometry of the matrix fibrils
network. Despite the quality limitation of the
SEM images, the method has the advantage of
evaluating the same slides where light
micros-copy morphometry has been carried out.
Chondrocyte Maturation Cycle and Matrix
Transformation
The inverse correlation of the chondrocyte
lacu-nar area parameters with those of the
interterrito-rial matrix suggests the uniqueness of cells and
matrix transformations in the chondrocyte
matu-ration cycle characterizing the first stage of
endo-chondral ossification. The chondrocyte lacunar
area variations in the passage from zone 3 to 2
could still be consistent with a concept of cell
hypertrophy supported by a high matrix synthesis
level and could eventually be associated to a
cer-tain degree with shrinkage of the fibrils network.
However, the changes in both the morphological
and morphometric parameters from zone 2 to 1
clash
with
this
hypothesis
and
are
better
explained by cell swelling. Earlier studies carried
out in the metaphyseal growth plate cartilage
(Buckwalter et al., 1986; Farnum et al., 2002)
have considered this question; the first paper
reported an increase in intracytoplasmic
organ-elles of 126% from the proliferative zone to the
hypertrophic zone against an increment of 779%
for the total cell volume (cytoplasm 1 nucleus),
and the second study reported chondrocyte
lacu-nar area variation that was in agreement with the
analysis of early postnatal zone 6 in the current
study.
With regard to the cartilage permeability and
the transport of solutes, the major fraction of
carti-lage water is reported to be free (Maroudas, 1975,
1976; Maroudas and Schneiderman, 1987; Torzilli,
1988); thus the molecular packing density and
intrafibrillar water content are a function of the
osmotic pressure difference between the
extrafi-brillar and intrafiextrafi-brillar spaces (Maroudas et al.,
1991). Considering the environmental condition of
the Anlage zone 1, the recovery of H
2O into the
swelling
cell
would
correspond
to
the
Fig. 7. (A) Histograms comparing the reciprocal variation of the TCLA and the TMA between Postnatal zone 5 and Fetal Anlage zone 3 (a). The CLN is significantly higher in Fetal zone 3 than in Postnatal zone 5, while the MSCLA is significantly higher in zone 5 than in zone 3 (b). (B) Histograms comparing the TCLA and the TMA between the postnatal metaphyseal growth plate cartilage (zone 6) and the cartilage Anlage zone 2 (a). The CLN and the MSCLA (b) demonstrate a significantly lower CLN and a higher MSCLA in postnatal zone 6 than in fetal zone 2.
concentration of CaPO
4in the matrix, up to a
crit-ical threshold of mineral precipitation. Different
mechanisms of cartilage calcification induction
have been suggested, such as matrix vescicles, or
a family of calcium channel molecules denoted as
annexins that are linked to type-II and type-X
col-lagen (Mwale et al., 2002; Ballock and O’Kneefe,
2007; Bonucci 2007). However, the hypothesis of
H
2O recovery into the cell rather than the
trans-port of calcium and phosphorous ions from the
cell into the matrix aligns with the morphology
and morphometry observed in this study. The
cal-cification of the Anlage cartilage has a close
rela-tionship
with
the
onset
of
endochondral
ossification in the diaphyseal and epiphyseal
ossi-fication centers, but at a later age in the latter.
Ossification Center Development
The fetal epiphyses up to the 22nd week of age,
even in the Anlagen with the most advanced
his-tological developmental stage (upper limb
proxi-mal humeri) do not exhibit cartilage canals. In
contrast, a well- developed network is evident in
all postnatal epiphyses, indicating that canals
have been progressively organized at least from
the 23rd week onwards. To date, no morphological
evidence indicates a causal relationship between
canal system development and the secondary
ossi-fication center, only suggesting that the latter
comes afterwards (Haraldsson, 1962; Gray and
Gardner, 1969; Lufti, 1970; Wilsman and Van
Sickle, 1970, 1972; Agrawal et al., 1986; Ganey
et al., 1992, 1995; Burkus et al., 1993; Shapiro,
1998; Blumer et al., 2008). Indeed a reliable,
sys-tematic evaluation of the appearance of the
sec-ondary ossification centers can only be obtained
by skeletal X-ray surveys (Vogt and Vickers, 1938,
Noback, 1944; Christie, 1949; Greunlich and Pyle,
1959; Caffey, 1973). The observation that some
canals only contain loose connective tissue
with-out vascular differentiated structures and others
contain vascular lacunae or even structured
ves-sels supports the view that the system plays a
pri-mary role in providing nutrition to cartilage.
Canals are advantageous in large-sized epiphyses
for the diffusion of water and solutes into the
inner core, but do not indicate that the canal
presence alone could initiate the endochondral
ossification process. The structured vessels can
use the canal network to reach at the appropriate
developmental period the epiphyseal ossification
center.
Structural Layout of Epiphyseal and
Diaphyseal Ossification
The epiphyseal ossification morphology
demon-strates the already reported chondrocyte
matura-tion cycle and the matrix calcificamatura-tion but with a
centripetal
progression
and
alignment
of
the
hypertrophic cells. The vessels reach the
ossifica-tion center through some of the pre-existing
carti-lage canals. They are branches of the external
metaphyseal vascular network or even of the
intramedullary vascular system (Brookes and
Rev-ell, 1998; Shapiro, 1998). There is a substantial
difference
between
diaphyseal
and
epiphyseal
Fig. 8. Human fetal, 3rd metacarpus. 20th week, (SEM, back-scattered). (A) The swollen chondrocytes of zone 1 had under-gone to schrinkage and artifacts due to processing dehydration. In the figure, the cell has maintained (despite schrinkage) con-tact with the lacunar border along the whole perimeter. Cysts and cisterns are evident inside the cytoplasm. (B) Morphology of zone 3 cartilage intercellular matrix. Collagen fibrils dispersed in a 3-D reticulum. (C) Tightly packed collagen fibrils of zone 1 (compared to B) and CaP nucleation in the bottom of the figure. Compacting was not an artifact of processing because images B and C were acquired from the same Anlage. (D) X-rays energy dispersive spectrum of the mineralized field in C documenting the CaP peaks.
ossification: the calcified cartilage of the former
provides a single cylindrical scaffold for the
perios-teal
apposition,
which
is
almost
completely
resorbed by the intramedullary vascular network
advancement. Epiphyseal and metaphyseal
ossifi-cation are characterizeds by osteoblasts apposition
on the thin calcified cartilage septa between the
chondrocyte columns.
In conclusion, a common chondrocyte
matura-tion cycle provides a stiff scaffold for osteoblast
apposition, but ossification progresses with
differ-ent patterns in the diaphysis, the epiphysis and
the metaphysis. Its schedule and pattern appear
to be set by the local morphology and the
develop-ment of the vascular supply.
ACKNOWLEGDMENTS
SEM observation and EDAX analysis was
car-ried out with an electron microscope of the
“Department of Surgical and morphological
Scien-ces” of the University of Insubria. The two
anony-mous
reviewers
and
the
editor
are
greatly
appreciated for their valuable comments and
sug-gestions in the revision of the manuscript.
LITERATURE CITED
Agrawal P, Kulkarni DDS, Atre PR. 1986. The participation of cartilage canals in the ossification of the human fetal calca-neum. J Anat 147:135–142.
Ballock RT, O’Keefe RJ. 2003. The biology of the growth plate. J Bone Joint Surg Am 85A:715–726.
Bland JM, Altman DG. 2010. Statistical methods for assessing agreement between two methods of clinical measurement. Int J Nurs Stud 47:931–6.
Blumer MJ, Longato S, Fritsch H. 2008. Structure, formation and role of cartilage canals in the developing bone. Ann Anat 190:305–15.
Bonucci E. 2007. Biological Calcification. Berlin: Springer-Ver-lag. pp. 261–301.
Brookes M, Revell WJ. 1998. Blood Supply of Bone. London: Springer-Verlag.
Buckwalter JA, Mower D, Ungar R, Schaeffer J, Ginsberg B. 1986. Morphometric analysis of chondrocyte hypertrophy. J Bone Joint Surg Am 68:243–55.
Burkus JK, Ganey TM, Ogden JA. 1993. Development of the cartilage canals and the secondary center of ossification in the distal chondroepiphysis of the prenatal human femur. Yale J Biol Med 66:193–202.
Caffey J. 1973. Pediatric X-Ray Diagnosis. London: Lloyd-Luke (medical books) LTD.
Christie A. 1949. Prevalence and distribution of ossification centers in the newborn infant. Am J Dis Child 77:355–61. Farnum CE, Wilsman NJ. 1993. Determinations of proliferative
characteristics of growth plate chondrocytes by labeling with bromodeoxyuridine. Calc Tissue Int 52:110–9.
Farnum CE, Lee R, O’Hara K, Urban JP. 2002. Volume increase in growth plate chondrocytes during hypertrophy: The contribution of organic osmolytes. Bone 30:574–81. Fig. 9. Human fetal, 3rd metacarpus. 20th week (SEM backscattered, 25.0003). Interfibrils
empty spaces in zone 3, 2, and 1 (A). The morphometric analysis of the interfibrils’ empty area reveals a significant reduction from zone 3 to zone 2 and from zone 2 to 1 in the same Anlage.
Ganey TM, Love SM, Ogden JA. 1992. Development of vascularization in the chondroepiphysis of the rabbit. J Orthop Res 10:496–510. Ganey TM, Ogden JA, Sasse J, Neame PJ, Hilbelink DR. 1995.
Base-ment membrane composition of cartilage canals during develop-ment and ossification of the epiphysis. Anat Rec 241:425–37. Gray DJ, Gardner E. 1969. The prenatal development of the
human humerus. Am J Anatomy 124:431–45.
Greunlich WW, Pyle SL. 1959. Radiographic Atlas of Skeletal Development of the Hand and Wrist, 2nd ed. Stanford, CA: Stanford University Press.
Haraldsson S. 1962. The vascular pattern of a growing and full-grown human epiphysis. Acta Anat (Basel) 48:156–67. Hunziker EB. 1994. Mechanism of longitudinal bone growth
and its regulation by growth plate chondrocytes. Microsc Res Tech 28:506–519.
Hunziker EB, Schenk RK, Cruz-Orive LM. 1987. Quantitation of chondrocyte performance in growth-plate cartilage during longitudinal bone growth. J Bone Joint Surg Am 69:162–173. Lufti AM. 1970. Mode of growth, fate and function of cartilage
canals. J Anat 106:135–145.
Maroudas A. 1975. Fluid transport in cartilage. Ann Rheum Dis 34:77–81.
Maroudas A. 1976. Transport of solutes through cartilage: Per-meability to large molecules. J Anat 122:335–347.
Maroudas A, Schneiderman R. 1987. “Free” and “exchangeable” or “trapped” and “non-exchangeable” water in cartilage. J Orthop Res 5:133–8.
Maroudas A, Wachtel E, Grushko G, Katz EP, Weinberg P. 1991. The effect of osmotic and mechanical pressure on water partitioning in articular cartilage. Biochim Biophys Acta 1073:285–94.
Mwale F, Tchetina E, Wu CW, Poole AR. 2002. The assembly and remodeling of the extracellular matrix in the growth plate in relationship to mineral deposition and cellular hyper-trophy: An in situ study of collagens II and IX and proteogly-can. J Bone Miner Res 17:275–283.
Noback CR. 1944. The developmental anatomy of the human osseus skeleton during the embryonic, fetal and circumnatal period. Anat Rec 88:91–125.
O’Rahilly R, Gardner E. 1972. The initial appearance of ossifi-cation in staged human embryos. Am J Anat 134:291–301.
Pazzaglia UE, Dell’Orbo C, Wilkinson MJ. 1987. The foreign body reaction in total hip arthroplasties. A correlated light-microscopy, SEM and TEM study. Arch Orthop Trauma Surg 106:209–219.
Pazzaglia UE, Beluffi G, Benetti A, Bondioni MP, Zarattini G. 2011. A review of the actual processes governing growth and development of long bones. Fetal Pediatr Pathol 30: 199–208.
Rasband, WS. 199722016. ImageJ, Bethesda, MD: U. S. National Institutes of Health. Available at: http://imagej.nih. gov/ij/
Rivas R, Shapiro F. 2002. Structural stages in the development of the long bones and epiphyses. J Bone Joint Surg Am 84A: 85–100.
Schneider CA, Rasband WS, Eliceiri KW. 2012. NIH Image to ImageJ: 25 years of image analysis. Nat Methods 9: 671–675. Shapiro F. 1998. Epiphyseal and physeal cartilage
vasculariza-tion: A light microscopic and tritiated thymidine autoradio-graphic study of cartilage canals in newborn and young postnatal rabbit bone. Anat Rec 252:140–148.
Streeter GI. 1951. Developmental Horizons in Human Embryos. Washington: Carnegie Institution of Washington.
Torzilli PA. 1988. Water content and equilibrium water parti-tion in immature cartilage. J Orthop Res 6:766–769.
Uhthoff HK. 1990. The Embryology of the Human Locomotor System. Berlin: Springer-Verlag.
Vogt EC, Vickers VS. 1938. Osseous growth and development. Radiology 91:441–444.
Wilsman NJ, Van Sickle DC. 1970. The relationship of cartilage canals to the initial osteogenesis of secondary centers of ossi-fication. Anat Rec 168:381–392.
Wilsman NJ, Van Sickle DC. 1972. Cartilage canals, their mor-phology and distribution. Anat Rec 173:79–93.
Wilsman NJ, Farnum CE, Green EM, Lieferman EM, Clayton MK. 1966a. Cell cycle analysis of proliferative zone chondro-cytes in growth plates elongating at different rates. J Orthop Res 14:562–572.
Wilsman NJ, Farnum CE, Lieferman EM, Fry M, Barreto C. 1966b. Differential growth by growth plates as a function of multiple parameters of chondrocytes. J Orthop Res 14:927– 936.