Abstract
In order to evaluate the influence of the texture characteristics of agricultural nets on the air flow passing through them, a micro wind tunnel was designed and built in the testing and engineering labora-tory of Sachim s.r.l., an Italian high-density polyethylene (HDPE) tech-nical textiles manufacturer. The micro wind tunnel (0.1345 m diame-ter) allowed the simultaneous measurement of the air flowrate and the pressure drop through a net sample. The equipment was designed to set up the inclination of the net samples with respect of the airflow at fixed angles (90°, 60°, 45°, 30°). The variation of the pressure drop with the air velocity on four different flat woven round monofilament HDPE nets perpendicular to the air flow are here reported. In all cases the air velocity measured into the micro wind tunnel was above 4 m s–1 hence reported results do not consider low wind speed.
Preliminarily, the loss coefficient was assumed as a function of porosity and Reynolds number, calculated with reference to the equiv-alent diameter of the pores, FS(Rel,e) and showed percent deviations
form experimental results in the range 14.6%÷25.3%. Hence a simpli-fied expression of the loss coefficient, depending only on the porosity was proposed, FS(e) which highlighted differences with experimental results in the range 3.5%÷20.3%. Finally, results were compared with those based on the Bernoulli’s principle found in the literature.
Introduction
Plastic nets are widely used in various agricultural applications: pro-tection from hail, wind, snow or strong rainfall in fruit-farming and ornamentals, shading nets for greenhouses and moderate influence of the microenvironment around a crop are the most common cases (Castellano et al., 2008). In some cases nets are placed on the vents of the structure, in others they cover the entire structure, the latter being this kind of structure called either net-house or screen-house. Usually, such net-covered structures do not have ventilation openings since it is expected that the cover is sufficiently permeable to provide enough ventilation capacity whilst protecting the crop against wind, hail or sun radiation.
The air permeability characteristics of the covering material deter-mine both the ventilation performance - together with buoyancy and convective phenomena (Teitel, 2007) - of a nethouse as well as its windbreak effect together with aerodynamic effects induced by the geometry of the structure (Robertson et al., 2002; Mistriotis and Castellano, 2012).
When nets are placed on the vents of the greenhouse, they affect mainly the internal microclimate due to the fact that usually vents are closed in case of strong wind. In any case, it is strategic to understand the correlation between the airflow passing through the net and its geometrical characteristics in order to properly design the building both from a structural and an energy efficiency point of view.
In the literature, the air flow characteristics through the net have been evaluated either in terms of permeability based on the motion equation of a fluid through a porous material expressed by the Forchheimer equation (Miguel et al., 1997, 1998, 2001; Bartzanas et al., 2002; Fatnassi et al., 2003; Valera et al., 2005), or in terms of coefficient of discharge based on Bernoulli’s flow theory (Brundrett, 1993; Kosmos et al., 1993; Pearson and Owen, 1994; Kittas et al., 2002; Bailey et al., 2003; Fatnassi et al., 2003; Ishizuka et al., 2005; Wang et al., 2007).
In many cases, the pressure drop given by both methods differs lit-tle, considering that the difference in the results obtained from apply-ing Forchheimer or Bernoulli equations is less significant than the uncertainty of not knowing the air pressure distribution around the greenhouse, a parameter which is needed to calculate the ventilation rate through an opening.
In order to evaluate the influence of construction parameters of Correspondence: Sergio Castellano, Department of Science of Agriculture,
Food and Environment (SAFE), University of Foggia, via Napoli 25, 71100 Foggia, Italy.
E-mail: [email protected]
Key words: Air flow; porous media; loss coefficient; discharge coefficient; plastic nets.
Acknowledgments: measurements and tests were performed within a wider R&D project named Tessuti a rete per uso agricolo (Innovative fabrics for agricultural use) funded to Sachim s.r.l. by Regione Puglia with the PIA instrument (Regolamento generale dei regimi di aiuto in esenzione n.9 del
29.06.2008 e s.m.i. - Titolo V Aiuti alle medie imprese e ai Consorzi di PMI per Programmi Integrati di Agevolazione).
Conflict of interest: the authors declare no potential conflict of interest. Received for publication: 1 February 2016.
Accepted for publication: 25 March 2016.
©Copyright S. Castellano et al., 2016 Licensee PAGEPress, Italy
Journal of Agricultural Engineering 2016; XLVII:542 doi:10.4081/jae.2016.542
This article is distributed under the terms of the Creative Commons Attribution Noncommercial License (by-nc 4.0) which permits any noncom-mercial use, distribution, and reproduction in any medium, provided the orig-inal author(s) and source are credited.
Experimental results on air permeability of agricultural nets
Sergio Castellano,
1Giuseppe Starace,
2Lorenzo De Pascalis,
3Marco Lippolis,
3Giacomo Scarascia-Mugnozza
41
Department of Science of Agriculture, Food and Environment, University of Foggia;
2
Department of Engineering for Innovation, University of Salento, Lecce;
3Sachim s.r.l., Putignano
(BA);
4Department of Agricultural and Environmental Science, University of Bari, Italy
Non
commercial
agricultural nets on the air flow, a micro wind tunnel was built - based, when compliant with the nets characteristics, on UNI EN ISO 9237 rec-ommendations - in the Testing and Engineering Laboratory at Sachim s.r.l., an Italian high-density polyethylene (HDPE) technical textiles manufacturer. Experimental results in terms of loss coefficient of four flat woven - a simple orthogonal weave between weft and warp threads (Castellano et al., 2008) - round monofilament HDPE nets are reported in this paper.
Models for fluid flow
Teitel (2007) presented a comprehensive literature review on stud-ies concerning the airflow resistance characteristics of various nets. The following section is mainly based on his review.
Forchheimer equation
The steady state, incompressible fluid flow through a highly porous material in which the volume of the solid matrix exceeds that of the fluid contained within it can be expressed by the Forchheimer equa-tion:
(1)
The permeability K represents the ability of the medium to transmit the fluid through it. Eq. (1) is derived from the general motion equa-tion of one-dimensional mass transfer through a permeable material (Miguel et al., 1997). Eq. (1) shows how fluid velocity is related to pres-sure drop, through the viscous resistance force, which appears due to momentum transfer at the fluid interface (m/K) and the pore inertia effects (rY/K0.5). The viscous resistance is predominant for low veloci-ties of the fluid through the porous material (mi=m/e), when the spaces occupied by the fluid are smaller than those occupied by the solid matrix and when the length of the porous material is comparable with its cross section (Bejan, 2013).
Some authors, considering a net equivalent to a porous media, used Eq. (1) to describe the airflow thorough a net. To analyse the airflow characteristics of greenhouse screening materials, and to determine their permeability K and inertial factor Y, Miguel et al. (1997) and Miguel (1998) tested several screens in a wind tunnel, and their find-ings let Miguel (1998) conclude that the correlations that best relate the screen permeability and inertial factor to the porosity e were:
(2)
(3) Different correlation equations were given by Valera et al. (2005) who tested eleven screens:
(4)
(5) The porosity e is a geometric property defined as the ratio of non-solid volume (voids) to the total volume of the net and can be measured using image processing (Castellano et al., 2008).
The motion is described by the Reynold number Re, which can be interpreted as the ratio between inertial and viscous forces:
(6)
In the general motion equation of one-dimensional mass transfer through a permeable material d is assumed coincident with the diam-eter of the particles of the solid matrix (Bejan, 2013). In formulation concerning the airflow passing through a net, d represents either the mesh size (distance between wires, pore equivalent diameter, etc.) or the wires diameter.
For very small velocities (Re<1) the quadratic term of Eq. (1) can be neglected obtaining the Darcy law, which defines the permeability:
(7)
Increasing the airflow velocity - Miguel (1997) assumed empirically as threshold value Re<150 - convective inertia effects become predom-inant, the linear term of the Eq. (1) can be neglected and the pressure drop can be described only by the quadratic term of Eq. (1) leading to Bernoulli’s formulation:
(8)
where the characteristics of the porous media are enclosed into the discharge coefficient Cd.
The porous media approach has been widely used in recent years in simulating nets in computational fluid dynamics analyses of green-house microclimate, the source term in the momentum equation is generally represented by Eq. (1) (Teitel, 2007).
Coefficient of discharge
The discharge coefficient approach - based on Bernoulli’s theory - is derived from the so-called orifice analogy. In the orifice model, the open area between the filaments is treated as a submerged orifice and, depending on the geometry of the opening, a discharge coefficient is determined for the pore (Pedersen, 1969).
Lu et al. (1996) developed an orifice model for calculating the perme-ability of monofilament fabrics in which the discharge coefficient was presented as follows:
(9)
Effective fractional open area (EFOA) is given by ac=Ac / l2f. Since the
infancy of the orifice model, discharge coefficient has been related to the flow Reynolds number in the following form (Pedersen, 1969; Gooijer et al., 2003; Wakeman and Tarleton, 2005):
(10) Note that Reynolds number is defined differently in different stud-ies. Following the work of Pedersen (1969), Lu et al. (1996) defined their Reynolds number based on the wetted perimeter of the orifice Wc through which the air passes:
(11)
Non
commercial
The EFOA and Wcwere expressed by:
(12)
(13) In Eq. (13), E(k,p / 2) is the elliptical integral of the second kind where: (14) (15) A simplified form of the discharge coefficient was used by Rigakis et al. (2015) in order to estimate the ventilation rate in screenhouses:
(16)
Bailey et al. (2003), in order to evaluate the airflow resistance of greenhouse ventilators with insect screens, used the relation proposed by Brundrett (1993):
(17)
where the loss coefficient Fs, is directly correlated to the discharge coefficient (commonly used to quantify the flow resistance of an open-ing) with the following:
(18)
and the loss coefficient was expressed by
(19) with
(20)
and h (e) defining the influence of the screen porosity e, expressed as
(21) Brundrett (1993) showed that Eq. (21) fitted the data better than did other alternative expressions such as 1 – e/e2and (1 – e/e)2 that have
been cited in other literature (Richards and Robinson, 1999). In this case, the Reynolds numbers were based on the diameter of the wires forming the screen. The first term in Eq. (20) dominates when Re<1; the third term provides the nearly constant value at high Reynolds numbers Re>200; the second term provides the transition between the first and third terms.
Bailey et al. (2003) used the Eq. (19) as the basis for correlating pressure drop coefficients of five nets and suggested, based on their experimental results, different coefficient with respect to Brundrett (1993) (Table 1).
Pinker and Herbert (1967), according to Eq. (19), suggested to split Fsinto two independent components as well: a screen porosity function, h (e), and a Reynolds number function, g (Re). With reference to g (Re), they tested four functions and concluded that it was difficult to discriminate between the four since the particular form of h (e) was more important than that of g (Re).
Ishizuka et al. (2005) used a vertical, open-ended tube with the test screen across the top, and an open, spiral, electrical heating wire across the bottom. The heat input and temperature difference across the test screen under steady-state conditions were measured and the thermally created pressure difference was calculated. Measurements were made on nine wire mesh screens with porosities of 0.371, 0.504 and 0.778 over the Reynolds number range (based on the wire diame-ter) 0.4 to 95, and the loss coefficients were correlated by:
(22) Lopez Martinez et al. (2014) derived the coefficient Fsequalling Eqs. (1) and (17) and assuming dp/dx=Dp/e, (Molina-Aiz et al., 2009):
(23) This coefficient was used to predict the pressure drop through the mesh for Reynolds numbers Rep<105(Teitel, 2001). Repis the Reynolds number based on the screen permeability and can be calculated by con-sidering the square root of specific permeability K (Lopez Martinez et al., 2014):
(24) Coefficients K and Y depend mainly on the porosity of the net, according, for example, to Eqs. (2), (3), (4) and (5).
When the approaching flow is not perpendicular to the screen, Laws and Livesey (1978) proposed that the loss coefficient FS,b,for a flow with an approach angle of b could be expressed as:
(25)
Table 1. Values of coefficients w, q, r proposed by Brundrett (1993) and Baily (2003) in the equation of the function g (Re).
w q r Brundrett (1993) 7.125 0.88 0.055 Bailey (2003) 18 0.75 0.055
Non
commercial
use
only
where FSis the loss coefficient for flow perpendicular to the screen (b=0°), the expression is valid for flows within b=45°.
Eq. (25) can be considered a simplified relation with respect to that proposed by Pinker and Herbert (1967) and improved by Brundrett (1993), in which the loss coefficient depends on the approach angle as well:
(26) which implies that for a given porosity and Reynolds number, the value of the pressure-loss coefficient is expected to decrease when the flow is not perpendicular to the screen (Teitel, 2007).
Teitel and Shklyar (1998) showed that b is not the only parameter affecting the pressure drop. They emphasised the importance of whole geometry by indicating that, when the distance between two adjacent threads of a woven screen is smaller than five times the thread diame-ter, the texture of the screen affects both the pressure drop through it and the downstream flow pattern.
To many practical purposes, it is quite complicate to evaluate experi-mentally empirical coefficients in Eq. (1), and differences among the var-ious studies were larger for the values of K and Y than for those of FS (Teitel, 2007). The choice of either the Forchheimer or Bernoulli equa-tions makes little difference and, as the pore dimension of the screen was increased, the difference between the values calculated by the two equa-tions tended to decrease. Kittas et al. (2002) used both the porous medi-um method and Bernoulli’s equation to calculate the pressure-loss coeffi-cient of a screen with a porosity of 0.6, which they tested, and the values obtained by the respective methods differed by only about 3%. Teitel (2001) compared the two methods and concluded that they agreed quite well in their predictions of the pressure drop through screens. For this reason, in this study a discharge coefficient approach was adopted. Based on experimental results, the loss coefficient of tested net was calculated as a function of the Reynolds number and the porosity of the net, FS (Re,e). In addition, a simplified expression of the loss coefficient, depend-ing only on the porosity was proposed, FS(e). Calculated values of the loss coefficient were compared with those proposed by different authors found in the literature and with experimental results.
Materials and methods
Laboratory devices
A micro wind tunnel was purposely designed and built at Sachim s.r.l.’s testing and engineering laboratory. The iron steel wind tunnel with a circular section (D=0.1345 m) allowed varying the airflow veloc-ity in the range 0÷15 m/s (Figure 1). The pressure drop upstream and downstream the fabric specimen was measured by means of a manometer mod. Aerofiltri MM200600 able to appreciate a pressure dif-ference in the interval of 0÷200±5 Pa. In addition, the test setup allowed modifying the inclination of the plastic net sample J inside the wind tunnel (90° when perpendicular, 60°, 45°, 30°) with respect of the airflow (Castellano et al., 2015).
The air flowrate through the wind tunnel was measured with a hot wire airflow sensor mod. SMC PF2A 712H in series with the net to be characterised. Distributed pressure drop due to the roughness of the inner surface of the pipe was taken into account. It was calculated by means of three measurements without the net sample at different air velocity, average values allowed to evaluate the relationship between the distributed pressure drop and the air velocity and, finally, the dis-tribute pressure drop was subtracted to experimental data gathered with net samples.
The velocity - to be used for fluid dynamics calculations - was then calculated with respect to the tunnel cross section. The ambient tem-perature was in the range of 20±1°C, compliant with the sensor speci-fications.
Tested nets
A set of flat woven round monofilament HDPE nets with different geometrical characteristics was tested (Table 2). Four nets with the same thickness of the warp and weft thread and different porosity were part of set A1 (dwarp=0.28 mm) (Table 1). Some of tested nets were com-mercial models, other were built specifically for the tests.
Each net was tested three times and the average value was taken into account in calculations. In the present paper, results concerning the airflow perpendicular to the net sample are reported.
Figure 1. Rendering of the device used to measure the air permeability of nets and fabrics at different inclinations. Specimen holder to set up the different inclinations: the picture refers to the specimen holder 60°.
Non
commercial
Results and discussion
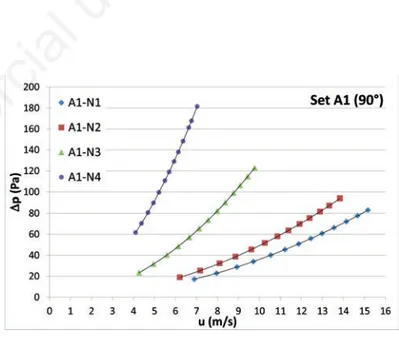
For all the investigated nets, a second order correlation between the air velocity measured in the wind tunnel and the pressure drop Dp was found (Figure 2).
A parabolic curve formally equal to Eq. (17) was assumed, the coef-ficients which better fit measured data were evaluated by means of the ordinary least squares method:
(27) where r=1.205 kg m–3at 20°C. A very high coefficient of determination R2>0.99 was gathered for all tested nets (Figure 2). Eq. (27) represents a parabola with the vertex coincident with the origin of axes; the shape of the curve depends on the value of the coefficient FS. The lower is FS, the wider is the concavity of the parabola throughout the whole velocity range measured in the micro-wind tunnel.
The loss coefficient was investigated firstly when the flow was per-pendicular to the sample. Preliminarily, according to Eq. (19), FSwas assumed as the product of two different functions: h (e) depending on the porosity and g (Re) depending on the Reynolds number. Concerning h (e), was confirmed the expression proposed by Brundrett (1993), a very high coefficient of determination (R2>0.87) was found assuming:
(28) A distribution based on empirical coefficients proposed by Brundrett (1993) (Table 1) was assumed as g (Re) but, differently from Brundrett (1993), Bailey et al. (2003), in Eq. (20) the Reynolds numbers were cal-culated with reference to the equivalent diameter of the pores:
(29) where: leq=4lwarplweft /(2lwarp–2lweft) is the equivalent diameter of the pores (Table 2).
Finally, the loss coefficient of tested nets was expressed as: (30)
Due to the high determination factor (R2>0.87) highlighted by h (e) with respect to FS, a simplified expression of the loss coefficient, depending only on the porosity, was proposed as alternative to Eq. (30):
(31)
The empirical coefficient 0.74 in Eq. (31) was calculated by means of the least square method, comparing experimental data with calculated applying Eq. (27) and assuming the loss coefficient depending only by the porosity of the net.
In Figure 3, pressure drops across the tested nets, induced by differ-ent values of the superficial velocity, evaluated according to Eq. (20) proposed by Bailey et al. (2003), Eq. (22) proposed by Brundrett (1993), Eq. (23) proposed by Ishizuka (2005), were plotted. In the same dia-grams, the measured values of the pressure drop in the micro wind tun-nel and the calculated values according to Eqs. (30) and (31) were reported.
Formulation proposed by Bailey et al. (2003) and Brundrett (1993) provided results very similar to each other (Figure 3) and a good corre-lation with experimental results (Table 3). Percentage errors lower than 13.0 and 12.4% respectively were observed in both formulations in samples A1-N1, A1-N2 and A3-N3 (Table 3). Higher differences were observed, 20.5 and 25.5% respectively, in measurements of net sample A1-N4 (Table 3). The same behaviour, with higher percentage errors between measured and calculated values applying Eq. (30), was observed. Such result depended on the function g (Re) proposed by Brundrett or Bailey which decreases hyperbolically from infinity to almost 0.5 when the Reynolds number passes from 0 to 100 and is almost constant when Re>100, consequently in the range of investigat-ed nets - 76<Re<282 - high variability of g (Re) is gatherinvestigat-ed, especially in nets with low porosity characterised by lowest Reynolds numbers. The formulation proposed by Ishizuka et al. (2005) overestimated the
Figure 2. Experimental values (marked ones) of velocity u, and pressure drop Dp for the tested nets. The solid lines indicate the parabolic regression curves
Table 2. The set of the nets under investigations. dwarpis the thickness of the warp; is the dweft thickness of the weft; lwarpis the distance
between the threads of the warps; lweftis the distance between the threads of the weft; leqis the equivalent diameter of the pores, units
are in millimetres, e is the porosity of the net.
Set Net Id. dwarp dweft lwarp lweft leq e A1 N1 0.28 0.28 1.39 1.72 1.54 71.6% A1 N2 0.28 0.28 0.97 1.54 1.19 65.7% A1 N3 0.28 0.28 0.35 1.54 0.57 47.0% A1 N4 0.28 0.28 0.27 0.49 0.35 34.4%
Non
commercial
use
only
pressure drop trough the net with respect to experimental results (Figure 3). Calculated values with Eq. (22) fitted better the experimen-tal results at high air velocity as confirmed by high values of standard deviations. The best fitting was observed comparing calculated values with those measured at net sample A1-N4 with a percentage error of 7.5% (Table 3).
Eq. (30), which FS (Rel,e) was assumed for, highlighted percentage errors with experimental data less than 25.3%, higher respect to those calculated by formulation proposed by Bailey et al. (2003) and Brundrett (1993) (Table 3).
The simplified formulation, described by Eq. (31), which assumed FS depending only on the porosity, showed a good matching with meas-ured data, similar to those obtained applying Eq. (30) except for net sample A1-N4 for which the best fitting with a percentage error 3.5% was observed (Table 3).
Conclusions
The airflow through the nets was experimentally evaluated using a purposely-built micro wind tunnel able to modify the inclination of the sample with respect to the airflow rate. In the present paper, results concerning the airflow perpendicular to the net sample are reported.
The airflow motion was described using the Bernoulli equation in terms of loss coefficient. Results confirmed those available in the liter-ature in terms of: i) dependence of the pressure drop on the square of the velocity and the porosity by means of the parameter (1–e2/e2); ii) the negligibility of the of the loss coefficient dependence on Reynolds for ordinary values of the air velocity.
Preliminarily, in this study the loss coefficient was assumed as the
Figure 3. Pressure drop Dp across tested nets induced by different velocity of the airflow u. (●) Measured in the wind tunnel; (∆) Bailey
et al. (2003); (£) Brundrett (1993); (◊) Ishizuka et al. (2005); (×) Equation (30) assuming FS(ReI, e); (+) Equation (31) assuming FS
(e).
Table 3. Differences between calculated and experimental values normalised with respect to the experimental values and associated stan-dard deviations.
Sample Bailey et al. (2003) Brundrett (1993) Ishizuka et al. (2005) FS(Rel,e) FS(e) A1-N1 13.0±6.7 12.4±5.4 45.6±26.7 25.3±2.8 18.9±3.2 A1-N2 10.2±5.9 10.2±4.5 42.5±24.0 22.9±2.3 20.3±2.5 A1-N3 5.3±3.3 4.6±2.7 37.5±20.5 14.6±1.4 20.3±2.3 A1-N4 20.5±2.7 25.5±1.1 7.5±4.3 21.2±0.7 3.5±2.2
Non
commercial
use
only
product of two different functions: h (e) depending on the porosity and g (Re) depending on the Reynolds number, FS (Rel,e), and showed per-cent deviations form experimental results in the range 14.6%÷25.3%. Differently from previous papers, the Reynolds number was calculated with reference to the equivalent diameter of the pores and not to the diameter of the wire. Hence, due to the high determination factor (R2>0.87) highlighted by h (e) with respect to F
S, a simplified expres-sion of the loss coefficient, depending only on the porosity was pro-posed, FS (e). The simplified formulation of the loss coefficient, allowed to predict the pressure drop with respect to the air velocity with a good accuracy and highlighted differences with experimental results in the range 3.5%÷20.3%. The two formulations of the loss coefficient, FS (Rel,e) and FS (e), were compared with those based on the Bernoulli’s principle found in the literature such as Bailey et al. (2003), Brundrett (1993) and Ishizuka et al. (2005). Results showed that the relationship proposed by Brundrett (1993) and Bailey et al. (2003) were in very good agreement with experimental results. Highest differences, 25.5 and 20.5% respectively, were observed in the net sample characterised by the lower porosity. The equation, proposed by and Ishizuka et al. (2005), overestimated the pressure drop at higher porosity and the fit-ting with experimental results increased when the porosity decreased, differences were in the interval 7.5-45.6%. The discharge coefficient approach allowed correlating the airflow characteristic uniquely to geo-metric characteristics of the net such as the porosity and the equiva-lent diameter of the pores (by means of the Reynolds number). As a consequence, evaluating the pressure drop with respect to the air speed simply knowing the geometric characteristic has been proved as possible even if further are needed to deepen the effect of other param-eters such as the geometry of the orifice, the diameter of threads or the kind of the weave. In any case, at this moment it seems more effective to evaluate the airflow characteristics of the net by means of experi-mental results into wind tunnel. Further study on other sets of textiles will be performed in the next future in order to validate the results here presented and to investigate the correlation of the loss coefficient with respect to the other geometrical parameters of the net.
References
Bailey B.J., Montero J.I., Pérez Parra J., Robertson A.P., Baeza E., Kamaruddin R. 2003. Airflow Resistance of Greenhouse Ventilators with and without Insect Screens. Biosyst. Engine. 86:217-29.
Bartzanas T., Boulard T., Kittas C. 2002. Numerical simulation of the air-flow and temperature distribution in a tunnel greenhouse equipped with insect-proof screen in the openings. Comput. Electron. Agric. 34:207-21.
Bejan A. 2013. Convection heat transfer. 4th ed. John Wiley & Sons, Hoboken, NJ, USA.
Brundrett E. 1993. Prediction of pressure drop for incompressible flow through screens. J. Fluid Engineer. Trans. Am. Soc. Mech. Eng. 115:239-42.
Castellano S., Scarascia Mugnozza G., Russo G., Briassoulis D., Mistriotis A., Hemming S., Waaijenberg D. 2008. Plastic nets in agriculture: a gen-eral review of types and applications. Appl. Eng. Agric. 24:799-808. Castellano S., Starace G., De Pascalis L., Lippolis M., Scarascia Mugnozza
G. 2015. Evaluation of HDPE nets performance in micro wind tunnel. Proc. Int. Symp. on New Technologies and Management for Greenhouses, GreenSys 2015, 19-23 July, Evora, Portugal.
Fatnassi H., Boulard T., Bouirden L. 2003. Simulation of climatic conditions in full-scale greenhouse fitted with insect-proof screens. Agric. Forest Meteorol. 118:97-111.
Gooijer H., Warmoeskerken M.M.G.G., Wassink J.G. 2003. Flow resistance
of textile materials - Part I: monofilament fabrics. Textile Res. J. 73:437-43.
Ishizuka M., Nakagawa S., Koizumi K., Takegoshi E. 2005. Measurements of flow resistance coefficients for wire nets in natural air convection flow. Proc. 16th Int. Symp. on Transport Phenomena, ISTP-16, Prague, Czech Republic.
Kittas C., Boulard T., Bartzanas T., Katsoulas N., Mermier M. 2002. Influence of an insect screen on greenhouse ventilation. Trans. ASAE 45:1083-90.
Kosmos S.R., Riskowski G.L., Christianson L.L. 1993. Force and static pres-sure resulting from airflow through screens. Trans. ASAE 36:1467-72. Laws E.M. Livesey J.L. 1978. Flow through screens. Ann. Rev. Fluid Mech.
10:247-66.
Lopez-Martinez A., Valera-Martinez D.L., Molina-Aiz F., Peña-Fernandez A., Marin-Membrive P. 2014. Microclimate evaluation of a new design of insect-proof screens in a Mediterranean greenhouse. Span. J. Agric. Res. 12:338-52.
Lu W.M., Tung K.L., Hwang K.J. 1996. Fluid flow through basic weaves of monofilament filter cloth. Textile Res. J. 66:311-23.
Miguel A.F., van de Braak N.J., Bot G.P.A. 1997. Analysis of airflow charac-teristics of greenhouses screening materials. J. Agr. Eng. Res. 67:105-12.
Miguel A.F., van de Braak N.J., Silva A.M., Bot G.P.A. 1998. Physical model-ling of natural ventilation through screens and windows in greenhous-es. J. Agr. Eng. Rgreenhous-es. 70:165-76.
Miguel A.F., van de Braak N.J., Silva A.M., Bot G.P.A. 2001. Wind-induced airflow through permeable materials part I: the motion equation. J. Wind Eng. Ind. Aerod. 89:45-57.
Mistriotis A., Castellano S. 2012. Airflow through net covered tunnel struc-tures at high wind speeds. Biosyst. Eng. 113:308-17.
Molina-Aiz F.D., Valera D.L., Peña A.A., Gil J.A., López A. 2009. A study of natural ventilation in an Almería-type greenhouse with insect screens by means of tri-sonic anemometry. Biosyst. Eng. 104:224-42.
Pearson C.C., Owen J.E. 1994. The resistance to air flow of farm building ventilation components. J. Agr. Eng. Res. 57:53-65.
Pedersen G.C. 1969. Fluid flow through monofilament fabrics. Proc. 64th National Meeting of AIChE, New Orleans, LA, USA.
Pinker R.A., Herbert M.V. 1967. Pressure-loss associated with compressible flow through square-mesh wire gauzes. J. Mech. Eng. Sci. 9:11-23. Richards P.J., Robinson M. 1999. Wind loads on porous structures. J. Wind
Eng. Ind. Aerod. 83:455-65.
Rigakis N., Katsoulas N., Teitel M., Bartzanas T., Kittas C. 2015. A simple model for ventilation rate determination in screenhouses. Energ. Build. 87:293-301.
Robertson A.P., Roux Ph., Gratraud J., Scarascia Mugnozza G., Castellano S., Dufresne de Virel M., Palier P. 2002. Wind pressures on permeably and impermeably-clad structures. J. Wind Eng. Ind. Aerod. 90:461-74. Teitel M. 2001. The effect of insect-proof screens in roof openings on
greenhouse microclimate. Agric. Forest Meteorol. 110:13-25.
Teitel M. 2007. The effect of screened openings on greenhouse microcli-mate. Agric. Forest Meteorol. 143,:159-75.
Teitel M., Shklyar A. 1998. Pressure drop across insect-proof screens. Trans. ASAE 41:1829-34.
Wakeman R.J., Tarleton E.S. 2005. Solid/liquid separation: principles of industrial filtration. Elsevier Advanced Technology, Oxford, UK. Wang Q., Maze B., Vahedi Tafreshi H., Pourdeyhimi B. 2007. On the
pres-sure drop modeling of monofilament-woven fabrics. Chem. Eng. Sci. 62:4817-21.
Valera D.L., Molina-Aiz F.D., Alvarez A.J., Lopez J.A., Terres-Nicoli J.M., Madueno A. 2005. Contribution to the characterization of insect-proof screens: experimental measurements in wind tunnel and CFD simula-tions. Acta Hort. 691:441-8.
Non
commercial
Nomenclature
Variables and parameters AC area of the pores, mm2 Cd discharge coefficient
D diameter of the micro wind tunnel, m df filaments diameter, mm
dwarp diameter of the warp, mm dweft diameter of the weft, mm e thickness of the mesh, mm FS loss coefficient
Fsq loss coefficient as function of of the approach angle of the flow h(e) function of the porosity
g (Re) function of the Reynolds number K permeability parameter of a net, m2 kc coefficient in Equation (10) k,jf coefficients in evaluation of EFOA leq equivalent diameter of the pores, mm lf filaments center-to-center distance, mm lwarp distance between the threads of the warp, mm lweft distance between the threads of the weft, mm p pressure, Pa
Q volumetric flow rate, m3s–1 R coefficient of correlation R2 coefficient of determination
Re Reynolds number
Red Reynolds number based on the diameter of the particles of the solid matrix
Rel Reynolds number based on the equivalent diameter of the pores Rep Reynolds number based on the screen permeability
u fluid velocity, m/s
ui fluid velocity through the net, m/s w, q, r empirical coefficients
Wc wetted perimeter of the orifice, mm
x direction of the mono dimensional flow motion Y inertial factor
Greek letters αcαC EFOA
b approach angle of the flow with respect to the screen (0° if perpendicular), deg
Dp pressure drop, Pa e porosity
m dynamic viscosity, kg m–1s–1
q inclination of sample into the micro wind tunnel with respect to the airflow (90° when perpendicular), deg
r density, kg m–3