Accepted
Article
This article has been accepted for publication and undergone full peer review but has not
PROF. VINCENZO FICARRA (Orcid ID : 0000-0002-2447-5196) DR. FRANCESCO PORPIGLIA (Orcid ID : 0000-0001-8567-6795) DR. ALESSANDRO CRESTANI (Orcid ID : 0000-0001-7443-8740) DR. ANDREA MINERVINI (Orcid ID : 0000-0001-5140-4628) DR. GIANLUCA GIANNARINI (Orcid ID : 0000-0002-6995-246X) Article type : Original Article
Article category: Urological Oncology
The Simplified PAdua REnal (SPARE) nephrometry system: a novel classification of parenchymal renal tumors suitable for partial nephrectomy
Vincenzo Ficarra1, Francesco Porpiglia2, Alessandro Crestani3, Andrea Minervini4, Alessan-dro Antonelli5, Nicola Longo6, Giacomo Novara7, Gianluca Giannarini3, Cristian Fiori2, Claudio Simeone5, Marco Carini4, Vincenzo Mirone6
1Department of Human and Pediatric Pathology “Gaetano Barresi”, Urologic Section, Uni-versity of Messina, Italy; 2Division of Urology, San Luigi Gonzaga Hospital Orbassano, University of Turin, Italy; 3Urology Unit, “Santa Maria Regina degli Angeli” Hospital, Adria (Ro), Italy; 4Department of Urology, Careggi Hospital, University of Florence, Italy,
5Urology Unit, ASST, Spedali Civili di Brescia, University of Brescia, Italy; 6Department of Urology, University of Federico II of Naples, Italy; 7Department of Oncologic, Surgical and Gastrointestinal Sciences, Urologic Unit, University of Padua, Italy; 8 Urology Unit, Aca-demic Medical Centre Hospital “Santa Maria della Misericordia”, Udine, Italy
Accepted
Article
Corresponding author:
Prof. Vincenzo Ficarra, MD, FEBU
Department of Human and Pediatric Pathology “Gaetano Barresi”, Urologic section - University of Messina, via Consolare Valeria 1 98124 Messina, Italy
e-mail: [email protected] twitter: @FicarraVincenzo
Keywords: renal cell carcinoma, partial nephrectomy, nephrometry scores, perioperative outcomes, pathological features
Abstract
Objective: Nephrometry systems provide important information for treatment planning, patient counseling and comparison between different partial nephrectomy (PN) series.
RENAL and PADUA classification are the most popular and widely used nephrometry sys-tems.
Objective of the study are: (1) to simplify the original PADUA classification of renal tu-mors generating a new system able to predict equally or better the risk of overall com-plications in patients undergoing PN; and (2) to test if the addition of contact surface ar-ea (CSA) parameter improves the accuracy of the original and new simplified PADUA classification.
Material and methods: We analyzed the clinical records of 531 patients who underwent PN (open, laparoscopic and robot-assisted) for renal tumours at 5 tertiary academic re-ferral centers from January 2014 to December 2016. The ability of each variable included in the PADUA classification to predict overall complications was tested using binary lo-gistic regression analysis. The variables that were not statistically significant were
exclud-Accepted
Article
ed from the simplified classification. Starting from original and simplified PADUA sys-tems, another two models were generated adding tumor CSA. ROC curve analysis was used to compare the ability of the different 4 models to predict overall complications. Binary logistic regression was used to perform both univariable and multivariable anal-yses looking for predictors of postoperative complications. Linear regression analysis was used to identify independent predictors of absolute change in eGFR (ACE).
Results: The Simplified PAdua REnal nephrometry (SPARE) score system including 1) rim location; 2) renal sinus involvement; 3) exophytic rate and 4) tumor dimension showed equal performance in comparison with the original PADUA score (AUC 0.657 Vs 0.664). Adding tumor CSA to the original (AUC 0.661) or to the simplified (AUC 0.658) PADUA scores did not increase the accuracy of both systems to predict overall complications. The SPARE system (OR 1.2 – 95%CI 1.1-1.3) was an independent predictor of postopera-tive overall complications. Age (p<0.001), BMI (p<0.001), Charlson index (p=0.02), pre-operative eGFR (p<0.001), and tumor CSA (p=0.005) were independent predictors of ACE. Limitations include the retrospective design and the lack of central imaging review.
Conclusions: The SPARE score is composed by only 4 variables instead of the original six and its accuracy to predict overall complications is similar to that of the original PADUA score. Addition of tumor CSA was not associated with an increase in prognostic accuracy. The SPARE system could replace the original PADUA score to evaluate the complexity of tumors suitable for PN.
Introduction
The European Association of Urology (EAU) guidelines on renal cell carcinoma (RCC) suggest the use of nephrometry systems to predict objectively the potential mor-bidity of nephron-sparing surgery for renal masses [1]. These tools provide important da-ta for treatment planning, patient counseling and comparison between different partial nephrectomy (PN) series [2].
Accepted
Article
RENAL nephrometry and PADUA classification were proposed in 2009 and widely used thereafter [3,4]. Several studies externally validated both systems as predictors of overall complications, warm ischemia time (WIT), estimated blood loss (EBL) and renal function impairment [2]. Moreover, a recent comprehensive systematic review and meta-analysis evaluating the impact of host factors on robotic PN confirmed the ability of both RENAL and PADUA nephrometry systems to predict the most important intra- and post-operative outcomes [5]. Few studies compared PADUA and RENAL nephrometry scores reporting substantially overlapping ability to predict perioperative outcomes [6, 7] and renal function impairment [8]. More recently, Schiavina et al reported slightly advantages in favor of PADUA classification to predict WIT and major complications [9].
First-generation nephrometry systems are clearly imperfect and have limitations such as interobserver reproducibility, incomplete quantification of relevant anatomic features and variable correlation with perioperative outcomes. For those reasons, other investigators have proposed and evaluated second-generation nephrometry systems such as the Di-ameter-axial-polar (DAP) nephrometry systems) [10], (the Zonal Nephro scoring system) [11] (Arterial Based Complexity (ABC) scoring system) [12]. Moreover, in 2015 Leslie et al proposed a new imaging parameter to predict the risk of complications after PN: the tumor contact surface area (CSA) [13]. Both available second-generation nephrometry systems and tumor CSA failed to be simpler, more reproducible or effective than RENAL and PADUA classifications. Therefore, it is likely that RENAL and PADUA classifications will remain the most popular in the academic community.
Similarly to TNM staging systems, we believe that the first generation of nephrometry score should be periodically updated considering the current clinical sce-nario and the potential role of new imaging features. Indeed, the expanding indications for nephron-sparing surgery as well as the wide diffusion of laparoscopic approaches and the significant improvement in surgical technique significantly changed the typology of the tumor treated conservatively and the morbidity of the procedures. Moreover, we need to simplify the available systems to improve their reproducibility and increase their use also in the clinical practice, beyond the clinical research setting. For such reasons, 10 years after the introduction of the PADUA score, we performed this multicenter study with the aims (1) to simplify our original classification of renal tumors generating a new
Accepted
Article
system able to predict equally or better the risk of overall complications in patients who underwent PN; and (2) to test if adding the CSA parameter improves the accuracy of the original and new simplified PADUA classification.
Patients and methods
After local Internal Review Board (IRB) approval, we analyzed the prospectively collected clinical records of 531 consecutive patients who underwent elective PN because of a suspicion of kidney cancer at five academic, high-volume centers (Brescia, Italy; Fi-renze, Italy; Napoli, Italy; Torino (Orbassano), Italy; Udine, Italy;) from January 2014 to De-cember 2016.
Patient records were extracted from each institutional database. All data were la-beled with their respective institution and pooled.
All patients underwent preoperative three-dimensional abdominal CT scans or ab-dominal magnetic resonance imaging (MRI) to define the clinical stage and the anatomi-cal characteristics of the tumors. All the radiologic images were prospectively evaluated by each participant center with the aim of assigning each variable (polar location; rim lo-cation; exophytic/endophytic rate, renal sinus and urinary collecting system involvement and maximal tumor size) included in the PADUA classification [4] as well as the tumor contact surface area (CSA), according to the formula described by Leslie et al [13]. The CT protocol included precontrast and postcontrast (arterial, venous, excretory phase) im-ages. Slice thickness was 0.5 mm, and volume rendering was performed using the phase (arterial or venous) providing the clearest delineation between the tumor and the sur-rounding renal parenchyma. Expert and dedicated uro-radiologists calculated the tumor CSA applying 3-dimensional rending software at the preoperative CT scan imaging. Spe-cifically, after measurement of tumor volume and percentage of tumor located within the renal parenchyma, the total surface area (TSA) of the tumor is calculated using the for-mula 4πr2 for surface area of a sphere, where r equals tumor radius. The tumor CSA is calculated by multiplying the TSA with the percentage of intraparenchymal component (CSA = TSA x percentage of intraparenchymal tumor/100).
Accepted
Article
Preoperative staging examination included also chest imaging (CT or x-ray), serum creatinine, serum electrolytes and liver function tests. Conversely, bone scan and brain imaging were performed when indicated by symptoms. Patients with bilateral renal tu-mors and/or synchronous metastases were excluded from the present analyses. Moreo-ver, none of the patients received neoadjuvant or adjuvant treatment.
One or two experienced surgeons performed the surgical procedures in each par-ticipant center. In all cases, a traditional PN with the excision of a minimal rime of healthy parenchyma around the capsule or a simple enucleation were performed accord-ing to the surgeon preferences.
For every patient, the following demographic and preoperative variables were extracted from each institutional database: age, gender, body mass index (BMI), Charlson comor-bidities index (CCI), American Society of Anesthesiologists (ASA) score, clinical tumor size, PADUA classification [4] and tumor CSA [13]. Specifically, according to the original PADUA score, tumors were stratified into low-risk (score 6–7), intermediate-risk (score 8– 9), and high-risk groups (score≥10) [4]. The CSA values were categorized in two groups according to the proposed cut-off value of 20 cm2 [13].
Moreover, the following intraoperative variables were recorded: OR time, warm is-chemia time (WIT), estimated blood loss (EBL), and transfusion rate. Three-month post-operative complications were classified according to the modified Clavien system [14]. Postoperative complications were distinguished as minor (grade 1–2) and major (grade 3–4) ones.
Pre- and post-operative eGFR were based on serum creatinine and calculated us-ing the Chronic Kidney Disease Epidemiology Collaboration (CKD-EPI) formula [15]. Renal function was assessed using the most recent eGFR prior to surgery and the eGFR calcu-lated three months after the surgical procedure. Renal function dynamics were repre-sented by the absolute eGFR change (ACE) and percentage eGFR change (PCE). ACE was calculated according the following formula: ACE=eGFRpostoperative - eGFRpreoperative. PCE was calculated by the formula, PCE = (eGFRpostoperative – eGFRpreoperative)/eGFRpreoperative. For each patient the 3-mo PCE greater than 20% was calculated.
Accepted
Article
Excised tumors were staged according to the 2009 version of the TNM classifica-tion [16]. Moreover, the following histologic features were collected: histologic subtypes according to the World Health Organization classification [17], nuclear grade according to the Fuhrman classification [18], and surgical margin status. Positive surgical margin (PSM) was defined as cancer cells at the level of inked parenchymal excision surface.
Patients with negative surgical margins, WIT lower than 20 min and without major complications reached the Margin, Ischemia and Complications (MIC) composite out-come [19].
Statistical analysis
Parametric continuous variables were reported as mean ± standard deviation (SD), whereas median and interquartile range (IQR) was used for nonparametric continuous variables. The Mann–Whitney U-test and the Kruskal-Wallis H-test were used to compare two or more nonparametric continuous variables, respectively. The Pearson chi-square test was used to compare categorical variables.
To simplify the original PADUA classification, the ability of each variable to predict overall complications was tested using the binary logistic regression analysis. The varia-bles which were not statistically significant were excluded from the simplified classifica-tion. The Odds Ratio (OR) values recorded for the variables predicting the overall compli-cations were used to assign the new score for each tested category.
Starting from original and simplified PADUA systems, two other models were generated adding the score assigned to the CSA categories [13]. ROC curve analysis was used to compare the ability of the different 4 models to predict overall complications.
Binary logistic regression was used to perform both univariable and multivariable analyses looking for predictors of overall postoperative complications. Linear regression analysis was used to identify independent predictors of ACE. Beyond the new simplified nephrometry system, the following preoperative covariates were included in multivariate models: age, BMI, comorbidities index, and preoperative eGFR and tumor CSA.
Accepted
Article
For all statistical analyses, a two-sided p < 0.05 was considered statistically signifi-cant. All data were analyzed with SPSS v. 23 statistical software (IBM Corp., Armonk, NY, USA).
Results
Table 1 summarizes the preoperative characteristics of 531 patients included in the present study (Table 1). PNs were performed using an open approach in 237 (44.6%) cases, a pure laparoscopic approach in 152 (28.6%) cases, and a robot-assisted approach in the remaining 142 (26.7%) cases. Perioperative and pathologic outcomes were report-ed in Table 2 (Table 2).
Three-month postoperative complications were recorded in 140 (26.4%) patients, including 110 (20.7%) patients with minor and 30 (5.7%) with major complications. Spe-cifically, minor complication were represented by prolonged fever/infection requiring in-travenous therapy (IV) in 45 (8.4%) patients; hematoma/hematuria requiring blood trans-fusion in 42 (7.9%) cases; cardiovascular diseases requiring medical therapies in 15 (2.8%) cases and deep venous thrombosis in 8 (1.5%) cases. Major complications included arterio-venous fistula requiring percutaneous embolization in 18 (3.3%) cases; urinary leakage requiring ureteral JJ placement in 8 (1.5%) cases; acute renal insufficiency requir-ing temporary dyalisis in 4 (0.7%) cases.
Table 3 shows the ability of each anatomical and topographic variable to predict the risk of overall complications in univariable analysis. A new score for each category was assigned according to the odds ratio value observed (Table 3).
Figure 1 shows the accuracy of different nephrometry systems generated from the original PADUA classification to predict overall complications (Fig. 1). Specifically, the Simplified PAdua REnal nephrometry (SPARE) score including 1) rim location; 2) renal si-nus involvement; 3) exophytic rate and 4) tumor dimension was considered as the sim-plest with AUC value similar to the others (p=0.9). Moreover, adding the tumor CSA to the original or simplified PADUA score did not increased the performance of either
Accepted
Article
models (p=0.8). Notably, the accuracy of tumor size alone was significantly lower than both PADUA classification (p=0.02) and SPARE system (p=0.03) (Fig. 1).
Table 4 reports the most important perioperative outcomes stratified according to the SPARE nephrometry score (Table 4). In details, overall complication were detected in 63/342 (18.4%) patients in the low risk group (score 0-3); in 59/152 (38.8%) patients in-cluded in the intermediate risk group (score 4-7) and in 18/37 (48.6%) patients classified as high risk category (score 8-10) (p<0.001), respectively. Moreover, the new risk stratifi-cation was able to differentiate operative time (p<0.001), cases not requiring ischemia (p<0.001), WIT (p=0.006), EBL (p<0.001), and percentage of patients reaching the MIC composite outcome (p<0.001) (Table 4).
Interestingly, the SPARE system was able to predict the risk of overall complica-tions also in the subgroups of patients treated either by open (p=0.004), laparoscopic (p<0.001) or robot-assisted PN (p=0.009). Similarly the SPARE system predicted overall complications in the subgroups of patients who received a simple enucleation (p=0.002) or a minimal partial nephrectomy (p<0.001) (Table 5).
Multivariable analysis showed that only age (OR 1.0 – 95%CI 1.0-1.1) and SPARE nephrometry score (OR 1.2 – 95%CI 1.1-1.3) were independent predictors of postopera-tive complications. Table 5 reports the univariable and multivariable analyses identifying the preoperative independent predictors of overall complications (Table 6).
The median value of ACE was -6.5 (IQR -18 to +1.5). Three months after surgery 136 (25.6%) patients showed a PCE greater than 20%. Linear logistic regression analysis showed that age (p<0.001); BMI (p<0.001); Charlson index (p=0.02); preoperative eGFR (p<0.001) and tumor CSA (p=0.005) were independent predictors of ACE (Table 7).
Discussion
Rim location, renal sinus involvement, exophytic rate and tumor size can be com-bined in a new Simplified PADUA Renal (SPARE) nephrometry score able to predict over-all complications in patients who underwent PN for renal tumors. Specificover-ally, the SPARE
Accepted
Article
system eases the nephrometry score assignment in the clinical practice maintaining the same accuracy of the original PADUA score. Table 8 summarizes the variables and scores included in original PADUA classification compared to those included in the SPARE sys-tem (Table 8). Moreover, tumor CSA does not increase the accuracy of both original and simplified PADUA score to estimate the risk of complications. Conversely, tumor CSA seems to be more appropriate to predict the absolute 3-mo change of eGFR in compari-son with the SPARE system.
In the last decade, nephrometry systems were widely used in the clinical practice to estimate the complexity of tumors suitable for PN and consequently improve the de-cision-making and patient’s counseling processes. Moreover, the introduction of nephrometry systems increased the quality of clinical researches improving data interpre-tation and comparison between different series. RENAL nephrometry and PADUA classifi-cation were proposed in 2009 and represented together with the Centrality Index the first-generation of nephrometry score [3, 4, 20].
Both PADUA and RENAL nephrometry systems communicate geographic location data of the tumor. Conversely the Centrality Index provides a continuous index based on tumor size and distance from the periphery of the tumor to the center of the kidney. Available studies included in a review published in 2015, showed that RENAL nephrometry score and PADUA classification were the most popular and used in com-parison to Centrality index. Interestingly, validation studies of these first-generation nephrometry systems showed conflicting results, probably as consequence of the heter-ogeneity of the evaluated series [2]. More recently, Cacciamani et al performed a sys-tematic review and meta-analysis of the literature including all surgical series and com-parative studies involving patients treated by robot-assisted PN (RAPN). When. the re-viewed series were stratified according to the RENAL nephrometry score, complex cases showed longer operative time and WIT; higher EBL and overall complications in compari-son with less complex cases. Conversely, the RENAL nephrometry score failed to identify any difference between low and high complex tumors in terms of transfusion rate, major complications, length of hospital stay, renal function, and PSM rates. Similarly, PADUA score stratified appropriately low and high complex cases in terms of all previous periop-erative outcomes with the exception of renal function and PSM rate [5].
Accepted
Article
Interestingly, for the first time, our study showed that the accuracy of original PADUA classification was not diminished removing some features such as polar location and upper collecting system involvement. The polar location was removed because it was not predictive of overall complications in univariable analysis. Similarly, clustering togeth-er in a single variable the renal sinus and UCS involvement, we obstogeth-erved that cases with only UCS involvement were similar to those cases with any involvement. Therefore, UCS involvement was removed from the system. Consequently, the new simplified SPARE system should be easier to calculate considering that the polar location and the UCS in-volvement are two time-consuming steps of the original PADUA score. Dedicated studies analyzing the inter- and intra-observer concordance of original and simplified PADUA score will be needed to confirm such hypothesis.
All the variables included in the new SPARE system were already present in the RENAL nephrometry system with the exception of the tumor location at level of medial or lateral rim of the kidney [3]. Indeed, the exophytic rate and the tumor size are strati-fied using the same cut-off values and the categories identistrati-fied by the variable “(N)earness to the collecting system or sinus” can be easily mutated in absence (≥4 mm) or presence (<4 mm) of renal sinus involvement according to SPARE system.
Other preoperative imaging features have been recently proposed in the Litera-ture beyond the parameters included in the RENAL and PADUA systems. In this context, the tumor CSA is the most extensively investigated and has been externally validated [13; 21-23]. For the first time, our study showed that the addiction of tumor CSA to the orig-inal PADUA score or to the SPARE system did not increase their accuracy in predicting overall complications. However, our study confirmed the role of tumor CSA as independ-ent predictors of renal function impairmindepend-ent in a model adjusted for all the most im-portant patient-related factors such as age, BMI, comorbidity index and preoperative eGFR. Conversely, the SPARE system was not an independent predictor of renal function impairment. These data confirmed other studies showing that original PADUA score was not a predictor of 3-mo renal function impairment [5, 23]. Therefore, tumor CSA could help surgeons to tailor the most appropriate dissection strategy, e.g., preferring simple enucleation instead of a wider resection of healthy parenchyma in patients with values higher than 20 cm2.
Accepted
Article
Limitations of the present study include the retrospective design and the lack of central imaging review to assign the variables included in the PADUA score and calculate the tumor CSA area. Moreover, we did not calculate the amount of sacrificed healthy pa-renchyma during the extirpative phase of the procedure applying specific formulas based on the pre- and postoperative imaging or measuring the rime of healthy parenchyma around the tumor on the surgical specimens. However, in all cases the Authors mini-mized the excisional volume loss performing a simple enucleation or a minimal PN. Last, similarly to the imaging features, the pathology slides review was not centralized. The lack of a validation is a further limitation of the study. Obviously, the SPARE system need to be externally validated in the context of further single and multicenter studies.
Conclusions
Ten years after the proposal of original PADUA score based on six anatomical and topographic tumor-related features, we proposed a new simplified version of this nephrometry system to predict the risk of postoperative complications. Only four fea-tures (rim location, renal sinus involvement, exophytic rate and maximum tumor size) composedt the new Simplified PADUA Renal (SPARE) nephrometry score.
The accuracy of the new simplified system was similar to that recorded for original PADUA score and it is not increased by the addition of the tumor CSA parameter. The SPARE nephrometry score correlated with all the most important perioperative outcomes and was an independent predictor of overall complications. Interestingly, the new simpli-fied system was generated from a multisurgeon, multicenter series including more than 50% of cases performed via a minimally invasive approach. Moreover, about 30% of pa-tients had PN for tumors >4 cm. For those reasons, the SPARE system could replace the original PADUA score to evaluate the complexity of tumors suitable for nephron-sparing surgery. Obviously, large, multicenter studies are needed to obtain an external validation of this simplified nephrometry system. Interestingly, the tumor CSA confirmed to be an important predictors of renal function impairment together with the most relevant pa-tient-related factors.
Accepted
Article
References
1. Ljungberg B, Bensalah K, Canfield S et al. EAU guidelines on renal cell carcinoma: 2014 update. Eur Urol. 2015; 67:913-24.
2. Klatte T, Ficarra V, Gratzke C et al. A literature review of renal surgical anatomy and surgical strategies for partial nephrectomy. Eur Urol 2015; 68: 980-992. 3. Kutikov A, Uzzo RG. The R.E.N.A.L. nephrometry score: a comprehensive
stand-ardized system for quantitating renal tumor size, location and depth. J Urol 2009; 182: 844–53.
4. Ficarra V, Novara G, Secco S et al. Preoperative aspects and dimensions used for an anatomical (PADUA) classification of renal tumours in patients who are can-didates for nephron-sparing surgery. Eur Urol. 2009; 56: 786-93.
5. Cacciamani GE, Gill T, Medina L et al. Impact of host factors on robotic partial ne-phrectomy outcomes: comprehensive systematic review and meta-analysis. J Urol. 2018; 200: 716-30
6. Hew MN, Baseskioglu B, Barwari K et al. Critical appraisalof thePADUA classifica-tion and assessment of the R.E.N.A.L. nephrometry score in patients undergoing partial nephrectomy. J Urol 2011;186: 42–6.
7. Bylund JR, Gayheart D, Fleming T et al. Association of Tumor Size, Location, R.E.N.A.L., PADUA and Centrality Index Score with Perioperative Outcomes and Postoperative Renal Function. J Urol 2012; 188: 1684-89.
8. Zhang ZY, Tang Q, Li XS et al. Clinical analysis of the PADUA and the RENAL scor-ing systems for renal neoplasms: a retrospective study of 245 patients undergo-ing laparoscopic partial nephrectomy. Int J Urol 2014; 21: 40–44.
9. Schiavina R, Novara G, Borghesi M et al. PADUA and R.E.N.A.L. nephrometry scores correlate with perioperative outcomes of robot-assisted partial nephrec-tomy: analysis of the Vattikuti Global Quality Initiative in Robotic Urologic Sur-gery (GQI-RUS) database. BJU Int 2017; 119: 456-63.
10. Simmons MN, Hillyer SP, Lee BH et al. Diameter-axial polar nephrometry: inte-gration and optimization of R.E.N.A.L. and centrality index scoring systems. J Urol 2012; 188: 384–90.
11. Hakky TS, Baumarten AS, Allen B et al. Zonal NePhRO Scoring System: a superior renal tumor complexity classification model. Clinical Genitourinary Cancer 2014; 12: 13-8.
12. Spaliviero M, Poon BY, Karlo CA et al. An arterial based complexity (ABC) scoring system to assess the morbidity profile of partial nephrectomy. Eur Urol 2016; 69: 72–9.
13. Leslie S, Gill IS, de Castro A et al. Renal tumor contact surface area: a novel pa-rameter for predicting complexity and outcomes of partial nephrectomy. Eur Urol 2014; 66: 884-93.
14. Dindo D, Demartines N, Clavien PA. Classification of surgical complications: a new proposal with evaluation on a cohort of 6,336 patients and results of a sur-vey. Ann Surg 2002; 240: 205-13.
15. Levey AS, Inker LA. Assessment of Glomerular Filtration Rate in Health and Dis-ease: A State of the Art Review. Clin Pharmacol Ther. 2017; 102: 405-19. 16. Greene FL, Gospodarowicz M, Wittekend C et al. American Joint Committee on
Accepted
Article
17. Eble JN, Sauter G, Epstein JI et al. Pathology and genetics of tumors of the urinary system and male genital organs. World Health Organization classification of tu-mors. Lyon, France: IARC Press; 2004.
18. Fuhrman S, Lasky LC, Limas L. Prognostic significance of morphologic parame-ters in renal cell carcinoma. Am J Surg Pathol 1982;6: 655-63.
19. Lista G, Buffi N, Lughezzani G et al. Margin, Ischemia, and Complications system to report perioperative outcomes of robotic partial nephrectomy: A European multicenter observational study (EMOS Project). Urology 2015; 85: 589-95 20. Simmons MN, Ching CB, Samplaski MK et al. Kidney tumor location measurement
using the C index method. J Urol 2010; 183: 1708-13.
21. Haifler M, Ristau BT, Higgins AM et al. External Validation of Contact Surface Ar-ea as a Predictor of Postoperative Renal Function in Patients Undergoing Partial Nephretomy. J Urol. 2018; 199: 649-54.
22. Ficarra V, Crestani A, Bertolo R et al. Tumor Contact Surface Area as predictor of postoperative complications and renal function in patients undergoing partial nephrectomy for renal tumors. BJU Int 2019; 123: 639-45.
Accepted
Article
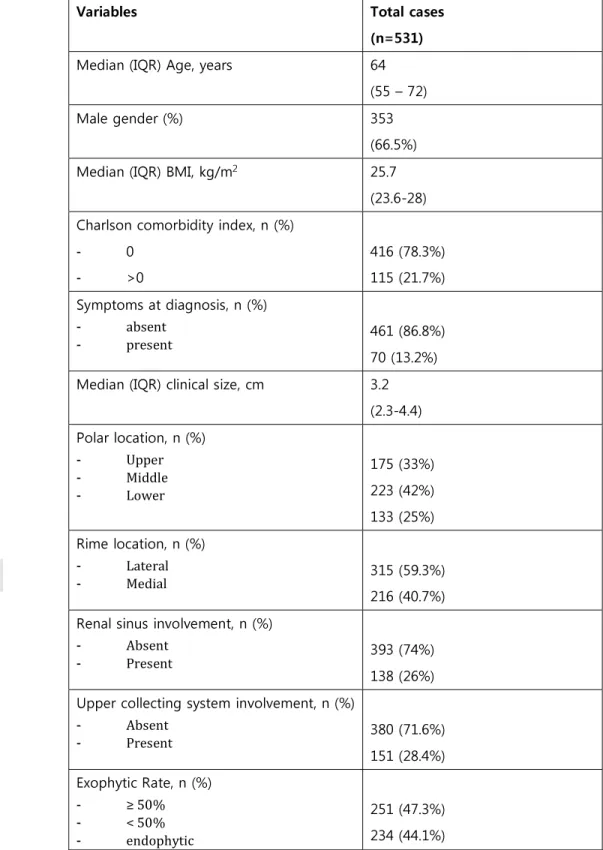
Table 1: Demographic, preoperative and imaging characteristics of 531 Patients included in the analysis
Variables Total cases
(n=531)
Median (IQR) Age, years 64
(55 – 72)
Male gender (%) 353
(66.5%)
Median (IQR) BMI, kg/m2 25.7
(23.6-28) Charlson comorbidity index, n (%)
- 0 - >0 416 (78.3%) 115 (21.7%) Symptoms at diagnosis, n (%) - absent - present 461 (86.8%) 70 (13.2%)
Median (IQR) clinical size, cm 3.2
(2.3-4.4) Polar location, n (%) - Upper - Middle - Lower 175 (33%) 223 (42%) 133 (25%) Rime location, n (%) - Lateral - Medial 315 (59.3%) 216 (40.7%) Renal sinus involvement, n (%)
- Absent
- Present 393 (74%)
138 (26%) Upper collecting system involvement, n (%)
- Absent - Present 380 (71.6%) 151 (28.4%) Exophytic Rate, n (%) - ≥ 50% - < 50% - endophytic 251 (47.3%) 234 (44.1%)
Accepted
Article
46 (8.7%) Tumor size categories (cm), n (%)
- ≤ 4 - 4.1 – 7 - > 7 364 (68.5%) 142 (26.7%) 25 (4.7%)
Median (IQR) PADUA score 8
(7-10) PADUA risk stratification
- low - intermediate - high 198 (37.3%) 197 (37.9%) 136 (25.6%)
Median (IQR) Contact Surface Area (cm2) 14.2
(7.4-25.1) Contact Surface Area (cm2), n (%)
- ≤ 20
- >20 349 (65.7%)
182 (34.3%) Median (IQR) preoperative eGFR ,
Accepted
Article
Table 2: Intraoperative and pathologic features of 531 patients included in the analysis
Variables Total cases
(n=531) Approach, n (% - open - laparoscopic - robot-assisted 237 (44.6%) 152 (28.6%) 142 (26.7%)
Median (IQR) OR, min 119
(90-150) Ischemia, n (%)
- zero
- warm 188 (35.4%)
343 (64.6%) Median (IQR) WIT, min
(n=343) 16 (12-20)
Median (IQR) EBL, ml 100
(50-200)
Median (IQR) LOS, days 6
(5-7) Histologic subtype, n (%)
- benign - clear cell - non clear cell
109 (20.5%) 293 (55.2%) 129 (24.3%) pT, stage, n (%) - pT1a - pT1b - pT2 pT3a 274 (64.9%) 101 (23.9%) 33 (7.8%) 14 (3.3%) Nuclear Grade, n (%) - grade 1 - grade 2 - grade 3 grade 4 56 (13.3%) 248 (58.8%) 99 (23.5%) 19 (4.5%) Surgical margins, n (%) - negative - positive 412 (97.6%) 10 (2.4%)
Accepted
Article
Median (IQR) postoperative eGFR, ml/min 81 (64-100)
PCE greater than 20%, n (%) 136
Accepted
Article
Table 3: Binary logistic regression analysis shows the accuracy of each anatomical and topographic parameter to predict the risk overall complications. A new score for each category was assigned according to the reported odds ratio
Variables OR (95% Confidence
Interval) p Value Score
Polar location - Upper/Lower - Medium Referent 1.3 (0.9-1.9) 0.2 0 1 Rim location - Lateral - Medial Referent 1.8 (1.2-2.6) 0.003 0 2 Renal sinus involvement
- Absent - Present Referent 2.5 (1.6-3.8) <0.001 0 3 UCS involvement - Absent - Present Referent 2.0 (1.3-3.0) 0.001 0 2 Sinus/UCS involvement - Absent - Only UCS - Only renal sinus - Both Referent 1.6 (0.7-3.3) 3.6 (1.6-8.1) 2.5 (1.6-3.9) 0.23 0.003 <0.001 Not applica-ble Exophytic rate - ≥ 50% - < 50% - endophytic Referent 1.3 (0.9-2.0) 0.16 0 1
Accepted
Article
2.0 (1.0-3.9) 0.04 2
Maximum Tumor size
- ≤ 4 cm - 4.1-7 cm - > 7 cm Referent 1.8 (1.1-2.7) 3.8 (1.7-8.8) 0.01 0.001 0 2 4 Tumor CSA -≤ 20 cm2 - > 20 cm2 Referent 2.0 (1.3-3.0) <0.001 0 2
Accepted
Article
Table 4: The most important perioperative outcomes are stratified according to the different risk categories identified according to the Simplified PAdua REnal (SPARE) nephrometry score.
Variables Low risk
(score 0-3) (n= 342) Intermediate risk (score 4-7) (n= 152) High risk (score 8-10) (n=37) P Value
Median (IQR) OR, min 110
(80-140) 130 (100-168) 150 (115-205) <0.001 No ischemia, n (%) 148 (43.3%) 37 (24.3%) 3 (8.1%) <0.001
Median (IQR) WIT, min 15
(12-20) 16 (12-21) 19 (15-27) 0.006
Median (IQR) EBL, ml 100
(50-200) 145 (55-300) 200 (100-425) <0.001 Intraoperative transfusion, n (%) 10 (2.9%) 3 (2%) 0 (0%) 0.5 Overall postoperative complications,
n (%) 63 (18.4%) 59 (38.8%) 18 (48.6%) <0.001
Major (Grade 3-4) postoperative
complications 12 (3.5%) 15 (9.9%) 3 (8.1%) 0.01
Margin, Ischemia, Complications
(MIC) reached, n (%) 258 (75.4%) 87 (57.2%) 15 (40.5%) <0.001
Absolute change in eGFR (ACE) -6
(-15 – 0.02) -7.3 (-21.7 – 5.6) -10 (-26 – 2.3) 0.6
Accepted
Article
Table 5: Correlation between Simplified PAdua REnal (SPARE) nephrometry score and presence of overall complications stratified according to surgical approach and tech-nique.
Variables Cases (%) Median SPARE
value (IQR) P Value
Open Partial Nephrectomy (n= 237)
- no complication - complications 162 75 2 (1-5) 4 (2-5) 0.004
Laparoscopic Partial Nephrectomy (n= 152)
- no complication - complications 109 43 2 (1-3) 3 (2-6) <0.001
Robot-assisted Partial Nephrectomy (n= 142) - no complication - complications 120 22 1 (0-4) 4 (1-7) 0.009 Simple Enucleation (n= 136) - no complication - complications 109 27 1 (0-2) 3 (0-5) 0.002
Minimal Partial Nephrectomy (n= 395)
- no complication - complications 282 113 2 (1-5) 4 (2-6) <0.001
Accepted
Article
Table 6: Univariable and multivariable analyses to predict overall postoperative complications
Univariable analyses Multivariable analysis
Variables OR (95% CI) P Value OR (95% CI) P Value
Gender - male - female Referent 0.9 (0.6-1.4) 0.7 Age (continuous) 1.0 (1.0-1.1) 0.001 1.0 (1.0-1.1) <0.001 BMI (continuous) 1.0 (0.9-1.1) 0.2 1.0 (0.9-1.1) 0.3 Charlson score - 0-1 - > 1 Referent 1.1 (0.7-1.6) 0.8 Referent 1.0 (0.6-1.6) 0.9 Symptoms - absent - present Referent 1.3 (0.8-2.3) 0.30 Clinical tumor size
(continuous) 1.0 (1.0-1.1) <0.001 Preoperative eGRF (continuous) 1.0 (0.9-1.1) 0.1 1.0 (0.9-1.0) 0.8 SPARE° score 1.2 (1.1-1.3) <0.001 1.2 (1.1-1.3) <0.001 SPARE° risk
Accepted
Article
- low (score 0-3) - interm.(score 4-7) - high (score 8-10) Referent 2.8 (1.8-4.3) 4.2 (2.1-8.4) <0.001 <0.001 Tumor CSA (continuous) 1.1 (1.0-1.1) <0.001 1.1 (1.0-1.1) 0.2 Tumor CSA - ≤ 20 cm2 - > 20 cm2 Referent 2.0 (1.4-3.0) <0.001°Simplified PAdua REnal nephrometry system including rime location, exophytic rate, re-nal sinus involvement and tumor size.
Accepted
Article
Table 7: Multivariable (linear regression analysis) analysis to identify independent predictors of absolute change in eGFR (ACE)
Variables B (95% CI) P Value
Age (continuous)
-0.114 (-0.6 / -0.3) <0.001
BMI (continuous)
0.06 (0.3 / 1.1) 0.001
Charlson score
(continu-ous) -0.046 (-3.1 / -0.2) 0.02
Preop eGFR (continuous)
-0.924 (-0.9 / - 0.8) <0.001
SPARE° score (continuous)
0.02 (-0.4/ 1.2) 0.4
Tumor CSA (continuous)
-0.06 (-0.3 / -0.05) 0.005
°Simplified PAdua REnal nephrometry system including rime location, exophytic rate, re-nal sinus involvement and tumor size.
Accepted
Article
Table 8: Comparison between original PADUA classification and new simplified SPARE nephrometry system.
Variables Original PADUA
score SPARE score
Polar location - Upper/Lower - Medium 1 2 Not included Rim location - Lateral - Medial 1 2 0 2 Renal sinus involvement
- Absent - Present 1 2 0 3 UCS involvement - Absent - Present 1 2 Not included Exophytic rate - ≥ 50% - < 50% - endophytic 1 2 3 0 1 2 Maximum Tumor size
- ≤ 4 cm - 4.1-7 cm - > 7 cm 1 2 3 0 2 4
Accepted
Article
Figure 1: ROC Curve analysis shows nephrometry systems generated from complications. The differences betwe (p=0.9). The accuracy of tumor size nephrometry system models (p=0.02 Model 1 (blue) (original PADUA scor Model 2 (green) (original PADUA sco Model 3 (grey) (Simplified PADUA R exophytic rate, renal sinus involveme Model 4 (violet) (Simplified PADUA (0.606-0.711)
Model 5 (orange) (tumor size): AUC
the accuracy (AUC – 95% CI) of different m the original PADUA classification to predict o een the AUCs were not statistically significant
resulted significantly worse in comparison with 2).
re): AUC 0.664 (0.612-0.715)
ore + tumor CSA): AUC 0.661 (0.609-0.713) Renal nephrometry score including rime location
ent and tumor size): AUC 0.657 (0.604-0.710) renal nephrometry score + tumor CSA): AUC 0.6
0.57 (0.52-0.63)
overall
n, 658