B- and T-lymphocyte number and
function in HIV
+
/HIV
−
lymphoma
patients treated with high-dose
chemotherapy and autologous
bone marrow transplantation
Diego Bertoli
1, Alessandro Re
2, Marco Chiarini
1, Alessandra Sottini
1, Federico Serana
1,
Viviana Giustini
1, Aldo M. Roccaro
1, Chiara Cattaneo
2, Luigi Caimi
1, Giuseppe Rossi
2&
Luisa Imberti
1Combination of anti-retroviral therapy, high-dose chemotherapy (HCT) and autologous stem cell transplantation (ASCT) has led to an improved survival of HIV+ non-Hodgkin lymphoma (NHL) patients.
We compared T- and B-cell subset recovery and related capability to respond to in-vitro stimulation, as well as T-cell repertoire modifications of HIV+ and HIV− NHL patients undergoing HCT and ASCT
as first-line consolidation or salvage treatment, using sequential blood samples obtained before and at 3, 6, 12 and 24 months after ASCT. B lymphocyte recovery occurred earlier, reaching higher levels in HIV+ patients as compared to HIV− patients and healthy controls; in particular, immature and
naïve B cells were significantly higher in HIV+ patients who had received rituximab in the pre-ASCT
period. These lymphocytes equally responded to in-vitro stimulation. Newly produced T cells similarly increased in HIV+ and HIV− NHL patients, but their levels remained constantly lower than in healthy
controls. T lymphocytes showed a reduced proliferative capacity, but their repertoire was reassorted by the treatment. The functional and numeric B-cell recovery and the qualitative modifications of T-cell receptor repertoire may explain, at least in part, the success of this aggressive therapeutic approach in HIV+ patients.
The introduction of combination anti-retroviral therapy (cART) has modified the natural history of HIV infec-tion, reducing HIV-related morbidity and mortality, a significant portion of which, however, is still accounted for by HIV-associated lymphoma1. Moreover, immune preservation with cART has changed the therapeutic
approach to HIV-associated lymphoma, allowing the use of aggressive treatment strategies, including high-dose chemotherapy (HDC) with autologous stem cell transplantation (ASCT). This approach has been explored at sev-eral Institutions in patients with refractory or relapsed HIV-associated lymphomas, showing high clinical efficacy with low toxicity and lack of significant increase in opportunistic infections2–9. ASCT has also been used with
encouraging results as early consolidation treatment after first-line therapy in HIV+ patients with lymphoma at
high risk of relapse2,10. The effects of ASCT, used as salvage treatment, were similar between HIV+ and HIV−
sub-jects, and a trend towards a lower probability of relapse after ASCT was observed in HIV+ patients10–12. The initial
concerns related to the possibility that HDC could exacerbate the immune depression already present in HIV+
patients, leading to infection progression, were ruled out by the demonstration that ASCT does not enhance viral replication or the peripheral HIV reservoir in the long term and does not worsen the T-cell impairment13.
Rather, a T-cell recovery has been described, probably related to the maintained thymus capability of transplanted patients to generate new T cells, as demonstrated by the peripheral increase of lymphocytes containing T-cell receptor excision circles (TRECs)+ cells13,14. The post-ASCT immune recovery appears not to be different in
HIV+ versus HIV− patients because total and naïve CD4+-lymphocytes, as well as TRECs, are similarly increased 1Centro di Ricerca Emato-oncologica AIL (CREA), ASST Spedali Civili, Brescia, Italy. 2Hematology, ASST Spedali Civili,
Brescia, Italy. Correspondence and requests for materials should be addressed to L.I. (email: [email protected])
Received: 25 August 2016 Accepted: 02 November 2016 Published: 01 December 2016
OPEN
in both groups of patients15. This suggests that conditioning regimens may create an identically appropriate
lym-phoid niche that can be equally replenished by the transferred cells in both groups of patients15,16. While it has
been reported that the lymphocyte recovery also involves CD8+ and CD19+ cells, which undergo a rapid
expan-sion in both HIV+ and HIV− groups after the period of aplasia15, whether the kinetics of the recovery of CD4+,
CD8+ and CD19+ cells and their subsets differ among HIV+ and HIV− patients remain not fully answered.
Moreover, it is not known whether lymphocytes that replenish the immune system in the post-ASCT period are functional. Finally, whether the T-cell receptor (TCR) repertoire undergoes similar modifications in HIV+ and
HIV− patients has not been explored yet.
Results
Patients’ characteristics and treatment.
Of the 32 enrolled patients (17 HIV+ and 15 HIV−), 20(11 HIV+ and 9 HIV−) were included in the analysis. Twelve patients were not analyzed for immune recovery
either because they relapsed early after ASCT (4 in each group) or because we included in the study only patients whose samples were collected at least at four different time points. At study entry, all HIV+ patients were
receiv-ing cART; median time from HIV diagnosis to cART initiation and from HIV diagnosis to ASCT was 30 (range: 5–192) and 46 (6–336) months, respectively.
The main characteristics of the patients and clinical data are shown in Table 1. The prevalence of men in the HIV+ group reflects the epidemiology of HIV infection in Italy17, while the difference in the lymphoma
histology reflects the different epidemiology of NHL in HIV+ and HIV− populations18. This translates into a
different percentage of patients treated in the pre-ASCT period, with the anti CD20 monoclonal antibody ritux-imab, which was administered only in patients with CD20+ lymphoma. Induction regimens for HIV+ patients
included cyclophosphamide, doxorubicin, vincristine, and prednisone (CHOP) +/− rituximab (n: 8); high dose methotrexate-containing regimens (n: 2); and doxorubicin, cyclophosphamide, vincristine, bleomycin, pred-nisone, and etoposide (VACOP-B; n: 1). Platinum-based regimens were administered to 4 of these patients as salvage therapy. Induction regimens for HIV− patients included CHOP and rituximab (n: 7); intensified CHOP
and rituximab (n: 2). As for HIV+, also two HIV− patients received platinum-based regimens as salvage therapy.
The number of mobilized CD34+ cells were significantly lower in HIV+ compared to HIV− patients, but
similar in rituximab versus non-rituximab-treated HIV+ patients. The observed differences in the number of
mobilized CD34+ cells could be explained on the basis of: (1) heterogeneity in the therapy used for stem cell
mobilization between HIV+ and HIV− patients; (2) different CD34+ mobilization goal19 (3) the depletion of
hematopoietic reservoir in HIV+ patients20,21. However, the number of infused CD34+ cells was comparable and
not statistically different between the two groups of patients.
Patients received antibacterial, antifungal and antiviral prophylaxis until stable engraftment, while trimethop-rim/sulfamethoxazole prophylaxis was suspended after stem cell infusion. None of the HIV+ patients interrupted
cART due to oral mucositis or other toxicities, nor modified the cART due to viral response failure. A single intravenous immunoglobulin injection has been administered to one HIV+ and 3 HIV− patients. Of note, this
was given before engraftment, few days after transplant. A patient with detectable HIV viremia at ASCT became negative early afterwards, while 4 had a short-lasting detectable viremia after ASCT. Before engraftment, 4 HIV+
and 2 HIV− patients had a bacterial documented infection, and 2 HIV+ patients had CMV reactivation. During
the 2 years observation period, 2 herpes zoster infections and 2 CMV reactivations were seen in the HIV+ group,
and 1 episode of pulmonary infection happened in both groups of patients.
Quantitative post-ASCT immune recovery.
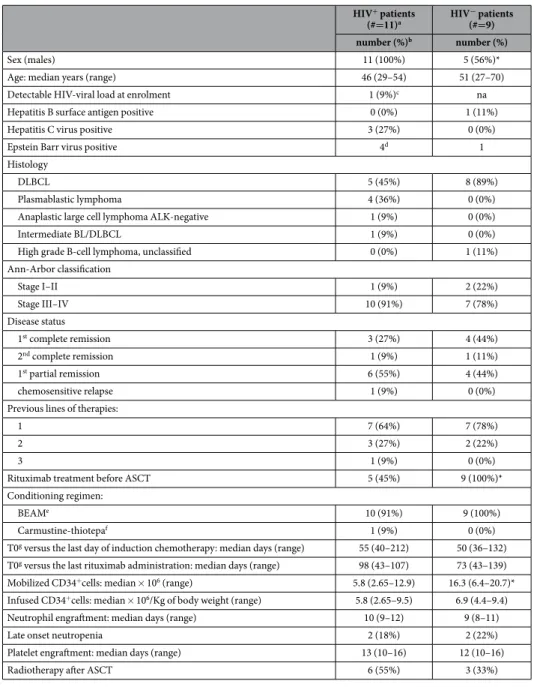
Immediately after ASCT, total CD19+ B lymphocytesof HIV+ and HIV− patients were below the lower values observed in healthy controls (HC), but differentially
increased after ASCT, being significantly and generally higher in HIV+ patients, going beyond the highest
value found in HC after 12 and 24 months (Fig. 1A). Specifically, B-cell number started to increase at 3 months post-ASCT and doubled in the following 3 months only in HIV+ patients, leading to significant differences
between the two groups after 6 months. The mean values of B cells of HIV− patients returned within the normal
range at 12 and 24 months after ASCT. Post-ASCT median values of serum IgG increased preferentially in HIV+
patients (from 654 [range: 338–1680] mg/dL at 3 months since ASCT to 983 [623–1670] mg/dL at 24 months) that in HIV− subjects (from 621 [160–1312] mg/dL to 691 [224–1313] mg/dL).
Before ASCT, the number of CD4+ T lymphocytes of HIV+ and HIV− patients were significantly lower as
compared to HC, but significantly and comparably increased from 12 to 24 months after ASCT (Fig. 1B). The mean CD8+ cell counts were below the lowest values of HC at the pre-ASCT time point in HIV+ individuals only,
significantly increased after 3 months in both groups, and always remained within the reference interval (Fig. 1C).
Quantitative post-ASCT B-cell subset recovery.
The better recovery of total B cells of HIV+individ-uals involved immature CD19+CD10+ cells, which increase was significantly higher but not at a specific time
point (Fig. 2A), and mature CD19+CD10− B cells (Fig. 2B), that grew faster in HIV+ patients starting from 3
months, and becoming significantly higher than in HIV− patients at 12 months after ASCT. The most represented
mature B-cell subset, namely the IgD+CD27− naïve population, showed a significant expansion in HIV+ patients
compared to HIV− patients at 6 and 12 months after transplantation (Fig. 2C). The early and preferential
expan-sion of these B-lymphocyte subsets in HIV+ patients was confirmed by the analysis of K-deleting recombination
excision circles (KRECs), which are the products of B-cell receptor rearrangements and therefore markers of B-cell neo-production. In HIV+ patients, KRECs were significantly higher already at baseline and increased
as soon as 3 months after ASCT, while in HIV− patients the increase was slightly delayed. At 24 months after
ASCT, KRECs become similar in the two groups, and also those of HIV− patients finally moved into the normal
range (Fig. 2D). No significant differences were detected between the two groups of patients for both CD19+
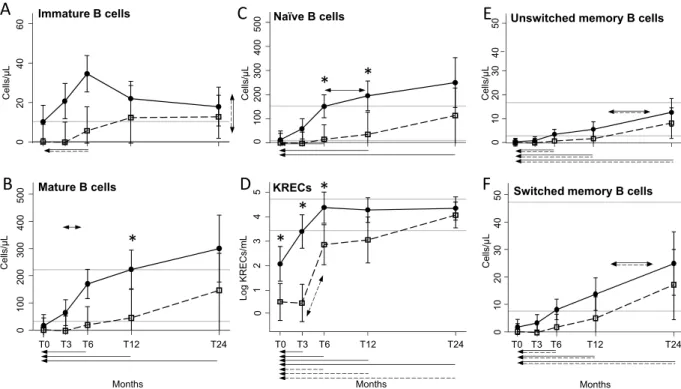
B-cell subset values of rituximab-treated HIV+ and HIV− patients with diffuse large B-cell lymphoma
(DLBCL), were compared with those of rituximab-untrated HIV+ patients with other lymphoma histologic types.
We found that rituximab strongly influenced the levels of B-cell subpopulations and KREC production in HIV+
patients, both before and after ASCT (Fig. 3). In addition, we found that complete or partial remission status did not exert any effect on B-cell recovery in HIV+ patients (data not shown).
Functional post-ASCT B-cell recovery.
In-vivo replication history of B lymphocytes, evaluated by meas-uring the average number of their divisions, was within the normal range in both HIV+ and HIV− patients(Fig. 4A). The only exception was documented within HIV− patient samples collected at 3 months post ASCT,
where the number of B-cell divisions fell below the minimum value of HC, thus resulting significantly lower than that of HIV+ individuals, likely reflecting the lack of B cells early after ASCT. B-cell functional response
HIV+ patients (#=11)a HIV − patients (#=9) number (%)b number (%) Sex (males) 11 (100%) 5 (56%)*
Age: median years (range) 46 (29–54) 51 (27–70)
Detectable HIV-viral load at enrolment 1 (9%)c na
Hepatitis B surface antigen positive 0 (0%) 1 (11%)
Hepatitis C virus positive 3 (27%) 0 (0%)
Epstein Barr virus positive 4d 1
Histology
DLBCL 5 (45%) 8 (89%)
Plasmablastic lymphoma 4 (36%) 0 (0%)
Anaplastic large cell lymphoma ALK-negative 1 (9%) 0 (0%)
Intermediate BL/DLBCL 1 (9%) 0 (0%)
High grade B-cell lymphoma, unclassified 0 (0%) 1 (11%) Ann-Arbor classification Stage I–II 1 (9%) 2 (22%) Stage III–IV 10 (91%) 7 (78%) Disease status 1st complete remission 3 (27%) 4 (44%) 2nd complete remission 1 (9%) 1 (11%) 1st partial remission 6 (55%) 4 (44%) chemosensitive relapse 1 (9%) 0 (0%)
Previous lines of therapies:
1 7 (64%) 7 (78%)
2 3 (27%) 2 (22%)
3 1 (9%) 0 (0%)
Rituximab treatment before ASCT 5 (45%) 9 (100%)*
Conditioning regimen:
BEAMe 10 (91%) 9 (100%)
Carmustine-thiotepaf 1 (9%) 0 (0%)
T0g versus the last day of induction chemotherapy: median days (range) 55 (40–212) 50 (36–132) T0g versus the last rituximab administration: median days (range) 98 (43–107) 73 (43–139) Mobilized CD34+cells: median × 106 (range) 5.8 (2.65–12.9) 16.3 (6.4–20.7)* Infused CD34+cells: median × 106/Kg of body weight (range) 5.8 (2.65–9.5) 6.9 (4.4–9.4) Neutrophil engraftment: median days (range) 10 (9–12) 9 (8–11)
Late onset neutropenia 2 (18%) 2 (22%)
Platelet engraftment: median days (range) 13 (10–16) 12 (10–16)
Radiotherapy after ASCT 6 (55%) 3 (33%)
Table 1. Main characteristics and clinical data of HIV+ and HIV− patients with non-Hodgkin lymphoma
receiving HDC and ASCT. Abbreviations: na, not applicable; ns, not significant; ALK, anaplastic lymphoma
kinase; DLBCL, diffuse large B-cell lymphoma; BL, Burkitt lymphoma. *P < 0.05 (P-value calculations were done by the Fisher exact test for categorical variables and unpaired t test for continuous variables). aThree
patients were intravenous drug users, 4 were men who had sex with men and 4 were heterosexual. Two patients had an AIDS-defining condition other than NHL: 1 cutaneous Kaposi sarcoma and 1 extrapulmonary tuberculosis; bunit of measure is count (percentage) unless differently specified; cviremia: 2.374 copies/mL; dEBV was detected by using immunohistochemistry only in 4 out 7 HIV+ and in 1 out 3 HIV− patients
analysed; ecarmustine 300 mg/m2, cytarabine 800 mg/m2, etoposide 800 mg/m2, and melphalan 140 mg/m2; fcarmustine 400 mg/m2, thiotepa 20 mg/Kg; gT0: the day preceding the conditioning regimen.
was evaluated by CFSE assay, measuring the ability of patient cells to proliferate after combined stimulation with anti-Ig for B-cell receptor cross-linking and CpG, which targets toll-like receptor 9, in presence of interleukin-10, known to increases mRNA expression of toll-like receptor 922, and interleukin-2, which sustains B-cell
prolifera-tion23. The fraction of B cells that divided at least once (Fig. 4B) and the average number of divisions performed
by responding cells (Fig. 4C) did not differ significantly between HIV+ and HIV− patients and HC, indicating that
B lymphocytes displayed an in-vitro capability to proliferate after stimulation.
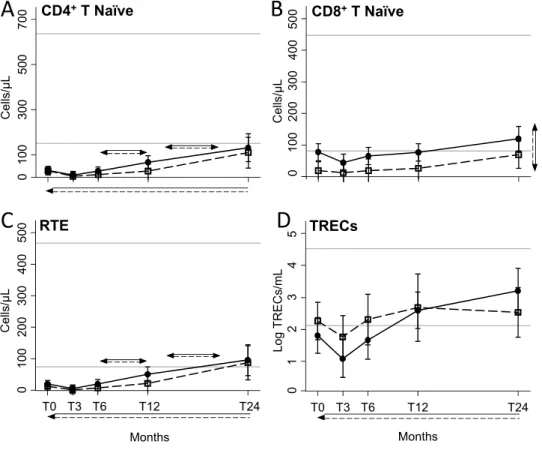
Quantitative post-ASCT T-cell subset recovery.
Naïve CD4 (Fig. 5A), recent thymic emigrants (RTE; Fig. 5C) and TRECs+ (Fig. 5D) lymphocytes similarly and significantly increased starting from 6 months afterASCT in HIV+ and HIV− patients. Of note, naïve CD4 cells never reached the lower limit of the reference range
found in HC. In contrast, the overall level of naïve CD8+ cells was significantly higher in HIV+ patients, where
we observed that cells went above the lowest value obtained in HC after 12 months since ASCT (Fig. 5B). In both groups of patients, CD4+ T
CM significantly increased in respect to the baseline, and especially starting from 12
months of therapy, but the values were always under those of HC (Supplementary Figure 1A). On the contrary, CD4+ T
EM increased in the first 12 months of therapy (Supplementary Figure 1B). The number of CD8+ TCM
was significantly higher in HIV+ patients, with values always close or higher than the top values found in HC
(Supplementary Figure 1C), while CD8+ T
CM similarly increased only in the months immediately after ASCT
(Supplementary Figure 1D).
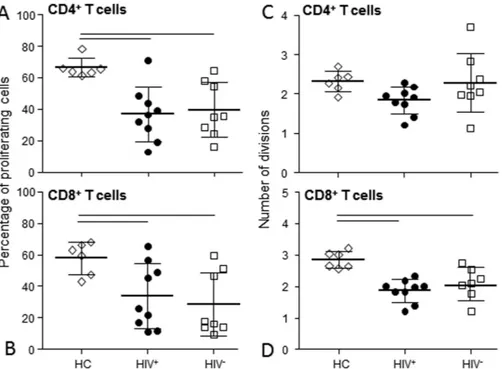
Functional post-ASCT T-cell recovery.
The capability of T cells to respond to in-vitro stimulation was assessed by CFSE assay after stimulation with PHA. The percentage of CD4+ and CD8+ cells that divided at leastonce after 4 days of culture was significantly lower in HIV+ and HIV− patients compared to HC (Fig. 6A and B).
The average number of CD4+ cell divisions upon stimulation was similarly modulated in both patients and HC
(Fig. 6C), while CD8+ cell divisions were reduced compared to HC (Fig. 6D).
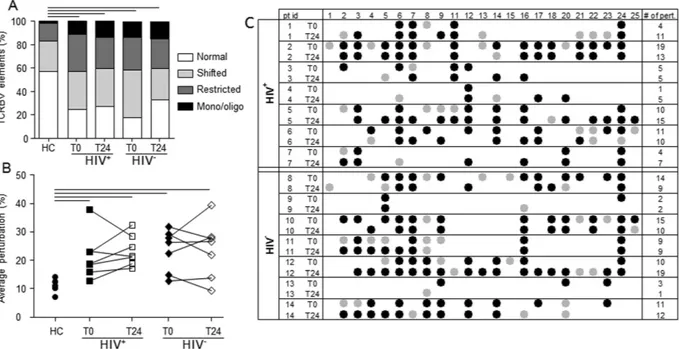
TCR repertoire analysis.
TCR diversity was evaluated before and 24 months after ASCT in 14 (7 HIV+and 7 HIV−) patients. No correlation was found between the extent of therapy-induced lymphopenia and the
degree of repertoire perturbation observed at the pre-ASCT period (data not shown). The mean proportion of TCRBV elements with normal, shifted, restricted and mono/oligoclonal profiles was significantly higher in samples obtained from the two groups of patients both in pre- and post-ASCT periods in comparison to sam-ples of HC (Fig. 7A). Accordingly, the mean percentages of TCRBV perturbations were significantly higher in HIV+ and HIV− patients at both time points (Fig. 7B). However, if TCRBV perturbations were evaluated at
single-TCRBV chain and single-patient level, the types of TCR repertoire restrictions appeared different because certain perturbations of TCRBV families found in the pre-ASCT period were lost 24 months after ASCT. In par-allel, for other TCRBV families, certain over-perturbations became evident only after the treatment (Fig. 7C and Supplementary Figure 2A). Finally, an unsupervised hierarchical clustering of the average perturbation changes, calculated as fold-change between post- and pre-ASCT periods, could group 6 out of the 7 HIV+ patients and 6
out of the 7 HIV− patients (Supplementary Figure 2B).
Figure 1. B- and T-cell recovery. Mean number of peripheral CD19+ (A), CD4+ (B), and CD8+ (C)
lymphocytes at the indicated time points in HIV+ (black dots, solid lines) and HIV− (empty squares, dashed
lines) patients. Error bars represent the 95% confidence interval of the mean. Grey horizontal lines represents the reference range, defined as the highest and lowest values found in HC. Arrows made by double (dashed and solid) lines indicate significant ANOVA main effects, without significant interaction, as follows: horizontal double-headed arrows indicate significant differences between the indicated time-points; single-headed arrows indicate significant differences between the indicated time-points and T0. When interaction is significant, post-hoc comparisons are indicated as follows: * significant differences between HIV+ and HIV− patients at
the indicated time point; double-headed arrows, solid or dashed: significant variation between adjacent means within HIV+ or HIV− patients, respectively; single-headed arrows, solid or dashed: significant variation in
respect to T0 within HIV+ or HIV− patients, respectively. T0: before ASCT (baseline); T3, T6, T12, and T24: at
Discussion
We found that the profound depletion of the B-cell population observed in HIV+ and HIV− NHL transplanted
patients at the pre-ASCT time point was followed by a differential and long lasting expansion of naïve and imma-ture B cells that progressively and significantly increased in HIV+ patients to overcome the values observed in
HC. While there were no differences in B-cell functionality between the two groups, HIV+ patients also showed a
better trend towards an IgG increase after ASCT in comparison to HIV− patients. The observed differences in the
B-cell compartment between HIV+ and HIV− patients, treated or not with rituximab before ASCT, are
intrigu-ing. Previous results obtained in HIV− subjects with NHL demonstrated that an anti-CD20-based treatment
induces a complete depletion of B lymphocytes, followed by a delayed recovery of memory B cells with abnormal function, which leads to a significantly increased incidence of hypogammaglobulinemia, lasting several months after ASCT24,25. However, we found that non-rituximab-treated non-DLBCL HIV+ patients showed a pattern
of B-cell subset increase closer to that of HIV− rituximab treated DLBCL patients, while the highest number of
B-cell increase was preferentially observed in HIV+ rituximab treated DLBCL patients. Possibly, the diverse B-cell
increase in the two groups of HIV+ and HIV− patients could be related to the different molecular characteristics,
cell origin, and prognosis of DLBCL, which are known to be related to a different incidence of EBV infection26.
Indeed, in the pre-cART and pre-rituximab era, this infection was detected in 63% of HIV+, but only in 3% of
HIV− patients. Nevertheless, similar studies have not been performed in patients treated with cART; moreover,
EBV was measured only in a minority of our patients, so we cannot reach any conclusion on the role of EBV in mediating differential B-cell recovery in our HIV+ patients.
Previous data on T-cell recovery obtained by measuring TRECs content in HIV+ patients have been
criti-cized because the results may be altered by the influence of ongoing HIV replication on the rates of cell division, apoptosis, and life span of CD4 cells27,28. This was not the case of our patients because they had a good control
of HIV infection as result of the cART responsible for a reduced cell activation, proliferation, and apoptosis29,30.
In addition, both approaches used to quantify thymic output, namely TREC quantification and RTE phenotyp-ing, confirmed that the kinetics of increase of newly produced CD4+ lymphocytes is not different in our HIV+
Cells/µ L Immature B cells Mature B cells Cells/µL 0 10 02 00 300 400 500 Cells/µ L T0 T3 T6 T12 T24 Months
C
T0 T3 T6 T12 T24 Months KRECsD
A
B
Cells/µL T0 T3 T6 T12 T24 MonthsUnswitched memory B cells
Switched memory B cells
E
F
Cells/µ L Naïve B cells*
*
0 10 20 30 40 50 0 10 0 20 0 30 0 400 500*
Log KRECs/mL*
0 10 20 30 40 50 0 20 40 60 1 2 3 4 5*
*
0Figure 2. B-cell subset recovery. Number of peripheral B-lymphocyte subsets at the indicated time points in
HIV+ (black dots) and HIV− (white squares) patients. Immature B cells (A) are CD19+CD10+ lymphocytes,
mature B cells (B) are CD19+CD10− lymphocytes. Mature B cells can be divided into IgD+CD27− naïve B cells
(C), IgD+CD27+ unswitched memory B cells (E), and IgD−CD27+ switched memory B cells (F). The number of
KRECs is given as log/mL (D). Error bars represent the 95% confidence interval of the mean. Grey horizontal lines represent the reference range defined as the highest and lowest values found in HC. Arrows made by double (dashed and solid) lines indicate significant ANOVA main effects, without significant interaction, as follows: horizontal double-headed arrows indicate significant differences between the indicated time-points; single-headed arrows indicate significant differences between the indicated time-point and T0. When interaction is significant, post-hoc comparisons are indicated as follows: * significant differences between HIV+
and HIV− patients at the indicated time point; double-headed arrows, solid or dashed: significant variation
between adjacent means within HIV+ or HIV− patients, respectively; single-headed arrows, solid or dashed:
significant variation in respect to T0 within HIV+ or HIV− patients, respectively. T0: before ASCT (baseline),
and HIV− patients. However, although increased, these cells always remained at low levels, and the percentage
of CD4+ lymphocytes that responded to stimulation was lower than in HC in both groups. While CD4+ T-cell
recovery following ASCT has been previously characterized, at least partially, in HIV+ patients, potential
fluctu-ations of CD8+ cells are less defined. It has been shown that HIV infection does not influence naïve CD8+ T-cell
levels in lymphoma patients with and without HIV infection candidates for ASCT31, but the kinetic
measure-ments and a phenotypic characterization of CD8 subsets were not previously reported. Phenotypic characteri-zation of CD8+ T-cell-recovery among HIV− lymphoma patients undergoing ASCT has suggested a preferential T0 T3 T6 T12 T24 Months 1 2 3 4 5 Log KRECs/mL T0 T3 T6 T12 T24 Months KRECs T0 T3 T6 T12 T24 Months
E
B
A
C
D
*
*
*
Cells/µ L B cells 0 100 200 300 400 500 Cells/µ L*
*
*
*
*
0 10 02 00 30 0 40 05 00 Mature B cells*
*
*
*
*
Naïve B cells 0 10 0 20 0 30 0 40 0 50 0*
*
*
*
*
0 20 40 60 Immature B cells*
*
*
*
*
*
0Figure 3. Number of peripheral B-cell subsets and KRECs. B-cell subsets and KRECs were evaluated at the
indicated time points in HIV+ patients that have received (black solid lines and dots) or not (grey dashed lines
and dots) adjuvant rituximab, and in HIV− patients (black dashed lines and clear squares), who have all received
rituximab. B cells (A) are CD19+ lymphocytes, immature B cells (B) are CD19+CD10+ lymphocytes, mature B
cells (C) are CD19+CD10− lymphocytes, and naïve B cells are IgD+CD27−CD19+CD10− lymphocytes (D). The
number of KRECs is given as log/mL (E). Grey horizontal lines represent reference range defined as the highest and lowest values found in HC. *Significant differences obtained by planned contrasts between cell subsets of HIV+ patients who received rituximab in comparison to HIV− patients (black asterisks) or to HIV+ patients
who did not receive rituximab (grey asterisks) at the indicated time points. T0: before ASCT (baseline), T3, T6, T12, and T24: at 3, 6, 12, and 24 months after ASCT, respectively.
Figure 4. B-cell functional response. The average number of in-vivo B-cell divisions (A), the percentage
of cells in the final culture that divided at least once (B) and the average number of divisions after in-vitro stimulation (C) were evaluated in HIV+ (black dots) and HIV− patients (white squares) at the indicated
time points and compared with that of HC (rhombi). Error bars represent the 95% confidence interval of the mean. Grey horizontal lines represent the highest and lowest values measured in HC. Two HIV+ and two
HIV− patients were not analyzed for functional study for the lack of cells at the baseline time point. *Significant
differences between HIV+ patients in comparison to HIV− patients at the indicated time-point. Single-headed
dashed arrows: significant variation in respect to T0 in HIV− patients. HC: healthy controls; T0: before ASCT
expansion of antigen-primed CD8+ cells rather than CD8+ naïve cells32. Our findings show that immune recovery
preferentially involved CD8 TCM, as well as naïve CD8+ cells. Moreover, naïve CD8+ cells were more expanded in
HIV+ rather than in HIV− patients, across all the evaluated time points, starting from the pre-conditioning (T0),
going to the 24 months of therapy (T24). The percentage of CD8+ lymphocytes that proliferated upon stimulation
was significantly lower in all patients as compared to HC. Therefore, CD8+ cells are functionally different from
those of HC, and may represent a population of “exhausted” clonal T cells, similar to those found during physi-ological aging33–36. Accordingly, as observed in the elderly, and despite the observed increase in newly produced
diversified T cells in both groups of patients, TCR repertoires at 24 months after ASCT are as restricted as in the pre-transplant period. However, we could also demonstrate relevant therapy-induced modifications of TCRBV chain profiles, including enlargement in TCR heterogeneity of T cells expressing certain TCRBV, and contraction in diversity of cells bearing other TCRBV, as well as disappearance of some clonal expansions and appearance of others. Therefore, our data differ from those reporting that patients undergoing ASCT after HDC regenerate clonal expansions consistent with those found in the pre-treatment period37. Furthermore, these modifications
could be different in HIV+ and HIV− patients as shown by unsupervised hierarchical clustering discriminating
between the two groups. Finally, TCRBV modifications are not merely due to a physiologic repertoire “drift” over time because TCR repertoire of HC is extremely stable38.
Taken together these findings indicate that T- and B-cell recovery following HDC and ASCT is similar or even better in HIV+ than in HIV− patients. Thus, the functional and numeric B-cell recovery and the qualitative
modifications of T-cell repertoire may explain, at least in part, the success of this aggressive therapeutic approach in HIV+ patients, both considering the low number of infectious complications commonly seen in these patients,
and, more intriguing, the high anti-lymphoma efficacy and the very low relapse rate observed after ASCT.
T0 T3 T6 T12 T24 Months
A
B
C
D
0 100 300 500 700 Cells/µ L 0 100 20 03 00 400 500 Cells/µ L CD8+T Naïve Log TRECs/mL T0 T3 T6 T12 T24 Months 0 1 2 3 4 5 TRECs CD4+T Naïve 0 10 0 20 0 30 0 40 0 50 0 Cells/µL RTEFigure 5. Number of peripheral CD4 and CD8 lymphocyte subsets. CD4 and CD8 lymphocytes were
evaluated at the indicated time points in HIV+ (black dots) and HIV− (white squares) patients. The presence
of CD45RA and CCR7 allowed us to identify CD45RA+CCR7+ CD4+ (A) and CD8+ (B) naïve lymphocytes.
RTE were naïve CD4+ lymphocytes expressing the CD31 molecule (C). The number of TRECs was measured
by real-time PCR and is given as log/mL (D). Error bars represent the 95% confidence interval of the mean. Grey horizontal lines represent the reference range, defined as the highest and lowest values found in HC. Arrows made by double (dashed and solid) lines indicate significant ANOVA main effects, without significant interaction, as follows: horizontal double-headed arrows indicate significant differences between the indicated time-points; vertical double-headed arrows indicate a difference between HIV+ and HIV− patients, not
depending on time point; single-headed arrows indicate significant differences between the indicated time-point and T0. RTE: recent thymic emigrants; T0: before ASCT (baseline), T3, T6, T12, and T24: at 3, 6, 12, and 24 months after ASCT, respectively.
Methods
Patients.
From October 2009 to February 2012, all consecutive HIV+ patients with NHL who receivedASCT as first-line consolidation or as salvage therapy at our Institution were enrolled in this prospective study. Patients signed an informed consent and the project was carried out in agreement with Declaration of Helsinki principles. Approval for these studies was obtained by our Institutional Board of Ethics Committee (Institution: ASST Spedali Civili di Brescia, Brescia, Italy; approved protocol no. NP 2352). Blood samples were obtained from patients at different time points: the day before starting the conditioning regimen (T0), and at 3 (T3), 6 (T6), 12 (T12), and 24 (T24) months after ASCT. Results obtained in HIV+ patients were compared with those
of HIV− patients and those of age-matched HC. Peripheral blood mononuclear cells (PBMC) were prepared by
Ficoll-Hypaque gradient centrifugation, and frozen in liquid nitrogen until use.
Quantification of lymphocyte subpopulations.
Newly produced T and B lymphocytes were quantified by measuring TRECs and KRECs in PBMC using a duplex quantitative real-time PCR performed as previously reported39. Results were expressed as copies/mL of blood.For B-cell subpopulation identification, one million PBMCs from HIV+, HIV− and HC were phenotyped
after staining with peridin-clorophyll protein-Cy5.5 anti-CD19, phycoerythrin-Cy7 anti-CD10, fluorescein isothiocyanate anti-IgD, and phycoerythrin anti-CD27 mAbs. The cells were first gated for CD19 expression on lymphocytes and then analyzed for the expression of CD10 marker to identify CD19+CD10+ immature B
cells and CD19+CD10− mature B cells. This last subset was examined for IgD and CD27 molecule expression
in order to recognize IgD+CD27− naïve B cells, IgD+CD27+ unswitched memory B cells, and IgD−CD27+
switched memory B cells. For T-cell subpopulation characterization, one million PBMCs were stained with phy-coerythrin anti-CD3, allophycocyanin-H7 anti-CD4, phyphy-coerythrin-Cy7 anti-CD8, fluorescein isothiocyanate anti-CD45RA, peridin-clorophyll protein-Cy5.5 anti-CCR7, and allophycocyanin anti-CD31 mAbs. PBMCs were first gated on the basis of CD3 expression, analyzed for CD4 and CD8 markers, and then for the expression of CD45RA and CCR7 in order to identify: CD45RA+CCR7+CD4+ and CD45RA+CCR7+CD8+ naïve T
lympho-cytes; CD45RA−CCR7+ central memory (T
CM) and CD45RA−CCR7− effector memory (TEM). RTE were naïve
CD4+ T lymphocytes expressing the CD31 molecule. mAbs were purchased from BD Pharmingen, eBioscience,
BioLegend (San Diego, CA) and Miltenyi Biotec (Bergisch Gladbach, Germany). Data were analysed with the FACS Diva software (BD Bioscience, San Diego, CA), and reported as absolute counts per μL of blood.
Average number of in-vivo B-cell divisions and in-vitro T- and B-cell activation.
The replication history of B lymphocytes was evaluated calculating the differences between the cycle threshold numbers (ΔCt)Figure 6. T-cell functional response. The percentage of CD4+ (A) and CD8+ (B) cells that divided at least
once and the average number of divisions of CD4+ (C) and CD8+ (D) lymphocytes after in-vitro stimulation
with PHA were evaluated in HIV+ (black dots) and HIV− (white squares) patients at the indicated time points
and compared with that of HC (rhombus). Two HIV+ and two HIV− patients were not analyzed for functional
studies due to the lack of cells at the basal time point. One data point for CD8+ cells divisions in HIV+ patients
was considered a significant outlier and removed. Horizontal lines indicated significant differences between cell subsets of HIV+ patients and HIV− patients in comparison to control. HC: healthy controls; T0: before ASCT
obtained by real-time PCR of the signal joint and the coding joint, which are generated during the rearrangement of IGK genes40. For proliferation assay, PBMC (3–5 × 10⁶/mL) prepared using samples obtained at 24 months
since ASCT were labelled with 0.2 μmol/L of carboxyfluorescein succinimidyl ester (CFSE; Invitrogen, Eugene, OR) for 20 minutes. Cells were plated in 96-well U-bottom culture plates and stimulated at 37 °C with 6.25 μg/mL phytohemagglutinin or 10 μg/mL CpG ODN 2006 (InvivoGen, San Diego, CA), 5 μg/mL of F(ab)2 anti-human
IgM/IgG/IgA (Jackson Immunoresearch, West Grove, PA), 40 U/mL interleukin-2 and 50 ng/mL interleukin-10 (Sigma-Aldrich, St Louis, MO), as described elsewhere23,41. T- and B-cell proliferation was measured by flow
cytometry after 5 days of culture. Data were analysed as previously reported42.
TCR repertoire analysis by complementarity-determining region 3 (CDR3) spectratyping.
The diversity of TCR beta variable (TCRBV) families was studied by spectratyping after performing multiplex PCR43.The length distributions of PCR products were analyzed on an ABI 3500 Genetic Analyzer; distribution of frag-ment lengths, number of detectable peaks per TCRBV elefrag-ment, and area under the curve were calculated by Gene Mapper (Applied Biosystems). The CDR3 size distribution of TCRBV families of each subject was classified into four categories: normal (Gaussian distribution and >7 peaks), shifted (deviation from Gaussian distribution and >7 peaks), restricted (prominent deviation from Gaussian distribution), and mono/oligoclonal (1 or 2 domi-nant peaks)43. Furthermore, the distribution of TCRBV perturbations was also calculated using the generalized
Hamming distance method44, in which the CDR3 length distribution of each TCRBV of a patient was subtracted
from the average Gaussian-like CDR3 length distribution obtained by analysing a “reference group” composed of age-matched HC. When a TCRBV family was not represented (no detectable peaks), the condition of maximal perturbation was reached, and its value was arbitrarily set to 100%.
Statistical analysis.
Comparisons between the mean of quantitative variables measured in HIV+ and HIV−subjects at several time points during the follow-up were performed by repeated measures ANOVA using linear mixed-models with a random slope. In particular, comparisons between the mean values of lymphocyte sub-population counts, including log-KRECs and log-TRECs, measured in HIV+ and HIV− subjects at more than
one time point during the follow-up were performed by repeated measures ANOVA using linear mixed-models with a random slope. In these models, HIV serostatus was considered as a covariate and part of an interaction term with time. A similar model was employed to compare immune reconstitution in HIV+ patients, using a
Figure 7. TCR repertoire analysis. (A) Percentage of normally distributed, shifted, restricted, and mono/
oligoclonally expanded TCRBV elements. Displayed bar lengths were calculated as the group proposed categories. The reported significance was obtained comparing the within-patient proportions of pooled shifted, restricted and mono/oligoclonal vs normal TCRBV chains between HIV+ and HIV− patients by analysis of
variance. (B) Average percentages of TCRBV perturbations in HC, and in HIV+ and HIV− patients at the
indicated time points. Each dot represents the global average perturbation of the TRCBV repertoire in one subject. Horizontal lines indicate significant differences between cell subsets of HIV+ and HIV− patients in
comparison to HC. (C) Map representing the complementarity-determining region 3 (CDR3) distribution perturbation at the single-TCRBV, single-patient level. Black and grey dots represent the TCRBV families whose perturbations are respectively higher than the mean + 3 SD and mean + 2 SD of the value seen in the corresponding TCRBV family in HC. The number of these over-perturbed TCRBV elements is indicated in right column. HC: healthy controls; pt id: patient identification; TCRBV: T-cell receptor variable beta chain; T0: before ASCT; T24: 24 months after ASCT.
binary covariate to compare partial vs complete remission. The same technique was used to compare average perturbations (after arcsine data transformation). In this case, the covariate included the HC group. When this interaction was significant, post-hoc comparisons between HIV+ and HIV− subjects at the different time points
were performed by linear contrasts, and Bonferroni corrected p-values were calculated. On the contrary, if the interaction was not significant, but a main effect with more than two levels was significant, Bonferroni corrected post-hoc comparisons were used to compare the differences between the levels. Alternatively, in case the signifi-cant main effect included only two levels, only its p-value was reported (e.g. HIV+ vs HIV−). In the case of
rituxi-mab treatment, only planned contrasts were used to compare the means of the cell population counts between the three subgroups at the different time points. In-vitro patient cell proliferations were compared to those of HC by one-way ANOVA followed by the Dunnett’s test. Comparisons between categorical variables were performed by the Fisher’s exact test. Differences were considered significant when P < 0.05.
References
1. Bonnet, F. et al. Changes in cancer mortality among HIV-infected patients: the Mortalite 2005 Survey. Clin Infect Dis 48, 633–9 (2009).
2. Diez-Martin, J. L. et al. Comparable survival between HIV+ and HIV- non-Hodgkin and Hodgkin lymphoma patients undergoing autologous peripheral blood stem cell transplantation. Blood 113, 6011–4 (2009).
3. Gabarre, J., Azar, N., Autran, B., Katlama, C. & Leblond, V. High-dose therapy and autologous haematopoietic stem-cell transplantation for HIV-1-associated lymphoma. Lancet 355, 1071–2 (2000).
4. Levine, A. M. Acquired immunodeficiency syndrome-related lymphoma: clinical aspects. Semin Oncol 27, 442–53 (2000). 5. Palella, F. J. Jr. et al. Declining morbidity and mortality among patients with advanced human immunodeficiency virus infection.
HIV Outpatient Study Investigators. N Engl J Med 338, 853–60 (1998).
6. Re, A. et al. High-dose therapy and autologous peripheral-blood stem-cell transplantation as salvage treatment for HIV-associated lymphoma in patients receiving highly active antiretroviral therapy. J Clin Oncol 21, 4423–7 (2003).
7. Re, A. et al. High-dose therapy and autologous peripheral blood stem cell transplantation as salvage treatment for AIDS-related lymphoma: long-term results of the Italian Cooperative Group on AIDS and Tumors (GICAT) study with analysis of prognostic factors. Blood 114, 1306–13 (2009).
8. Serrano, D. et al. HIV-associated lymphoma successfully treated with peripheral blood stem cell transplantation. Exp Hematol 33, 487–94 (2005).
9. Zanet, E. et al. Postautologous stem cell transplantation long-term outcomes in 26 HIV-positive patients affected by relapsed/ refractory lymphoma. AIDS 29, 2303–8 (2015).
10. Krishnan, A. et al. Durable remissions with autologous stem cell transplantation for high-risk HIV-associated lymphomas. Blood 105, 874–8 (2005).
11. Krishnan, A. et al. HIV status does not affect the outcome of autologous stem cell transplantation (ASCT) for non-Hodgkin lymphoma (NHL). Biol Blood Marrow Transplant 16, 1302–8 (2010).
12. Re, A. et al. Early Consolidation with High Dose Therapy and Autologous Stem Cell Transplantation in HIV-Associated Non Hodgkin Lymphoma at High Risk (aa-IPI 2–3). Mature Results of a Multicenter Prospective Phase II Trial. Blood 124, 2528 (2014). 13. Simonelli, C. et al. Immune recovery after autologous stem cell transplantation is not different for infected versus
HIV-uninfected patients with relapsed or refractory lymphoma. Clin Infect Dis 50, 1672–9 (2010).
14. Benicchi, T. et al. T-cell immune reconstitution after hematopoietic stem cell transplantation for HIV-associated lymphoma.
Transplantation 80, 673–82 (2005).
15. Klebanoff, C. A., Khong, H. T., Antony, P. A., Palmer, D. C. & Restifo, N. P. Sinks, suppressors and antigen presenters: how lymphodepletion enhances T cell-mediated tumor immunotherapy. Trends Immunol 26, 111–7 (2005).
16. Muranski, P. et al. Increased intensity lymphodepletion and adoptive immunotherapy–how far can we go? Nat Clin Pract Oncol 3, 668–81 (2006).
17. Torti, C. et al. Cohort Profile: Standardized Management of Antiretroviral Therapy Cohort (MASTER Cohort). Int J Epidemiol (2015).
18. Kaplan, L. D. HIV-associated lymphoma. Best Pract Res Clin Haematol 25, 101–17 (2012).
19. Re, A. et al. Stem cell mobilization in HIV seropositive patients with lymphoma. Haematologica 98, 1762–8 (2013).
20. Sloand, E. M. et al. Secondary colony formation after long-term bone marrow culture using peripheral blood and bone marrow of HIV-infected patients. AIDS 11, 1547–53 (1997).
21. Zauli, G. & Capitani, S. HIV-1-related mechanisms of suppression of CD34+ hematopoietic progenitors. Pathobiology 64, 53–8 (1996).
22. He, B., Qiao, X. & Cerutti, A. CpG DNA induces IgG class switch DNA recombination by activating human B cells through an innate pathway that requires TLR9 and cooperates with IL-10. J Immunol 173, 4479–91 (2004).
23. Huggins, J. et al. CpG DNA activation and plasma-cell differentiation of CD27- naive human B cells. Blood 109, 1611–9 (2007). 24. Nishio, M. et al. Delayed redistribution of CD27, CD40 and CD80 positive B cells and the impaired in vitro immunoglobulin
production in patients with non-Hodgkin lymphoma after rituximab treatment as an adjuvant to autologous stem cell transplantation. Br J Haematol 137, 349–54 (2007).
25. Shortt, J. & Spencer, A. Adjuvant rituximab causes prolonged hypogammaglobulinaemia following autologous stem cell transplant for non-Hodgkin’s lymphoma. Bone Marrow Transplant 38, 433–6 (2006).
26. Morton, L. M. et al. Molecular characteristics of diffuse large B-cell lymphoma in human immunodeficiency virus-infected and -uninfected patients in the pre-highly active antiretroviral therapy and pre-rituximab era. Leuk Lymphoma 55, 551–7 (2014). 27. Harris, J. M. et al. Multiparameter evaluation of human thymic function: interpretations and caveats. Clin Immunol 115, 138–46
(2005).
28. Ho Tsong Fang, R., Colantonio, A. D. & Uittenbogaart, C. H. The role of the thymus in HIV infection: a 10 year perspective. AIDS 22, 171–84 (2008).
29. Franco, J. M. et al. T-cell repopulation and thymic volume in HIV-1-infected adult patients after highly active antiretroviral therapy.
Blood 99, 3702–6 (2002).
30. Kolte, L. et al. Association between larger thymic size and higher thymic output in human immunodeficiency virus-infected patients receiving highly active antiretroviral therapy. J Infect Dis 185, 1578–85 (2002).
31. Pratesi, C. et al. Recent thymic emigrants in lymphoma patients with and without human immunodeficiency virus infection candidates for autologous peripheral stem cell transplantation. Clin Exp Immunol 151, 101–9 (2008).
32. Geddes, M. & Storek, J. Immune reconstitution following hematopoietic stem-cell transplantation. Best Pract Res Clin Haematol 20, 329–48 (2007).
33. Buchholz, V. R., Neuenhahn, M. & Busch, D. H. CD8+ T cell differentiation in the aging immune system: until the last clone standing. Curr Opin Immunol 23, 549–54 (2011).
34. Papagno, L. et al. Immune activation and CD8+ T-cell differentiation towards senescence in HIV-1 infection. PLoS Biol 2, E20 (2004).
35. Pawelec, G. & Larbi, A. Immunity and ageing in man: Annual Review 2006/2007. Exp Gerontol 43, 34–8 (2008).
36. Appay, V., Almeida, J. R., Sauce, D., Autran, B. & Papagno, L. Accelerated immune senescence and HIV-1 infection. Exp Gerontol 42, 432–7 (2007).
37. Protheroe, A. S. et al. Persistence of clonal T-cell expansions following high-dose chemotherapy and autologous peripheral blood progenitor cell rescue. Br J Haematol 111, 766–73 (2000).
38. Muraro, P. A. et al. T cell repertoire following autologous stem cell transplantation for multiple sclerosis. J Clin Invest 124, 1168–72 (2014).
39. Sottini, A. et al. Simultaneous quantification of recent thymic T-cell and bone marrow B-cell emigrants in patients with primary immunodeficiency undergone to stem cell transplantation. Clin Immunol 136, 217–27 (2010).
40. van Zelm, M. C., Szczepanski, T., van der Burg, M. & van Dongen, J. J. Replication history of B lymphocytes reveals homeostatic proliferation and extensive antigen-induced B cell expansion. J Exp Med 204, 645–55 (2007).
41. Bernasconi, N. L., Onai, N. & Lanzavecchia, A. A role for Toll-like receptors in acquired immunity: up-regulation of TLR9 by BCR triggering in naive B cells and constitutive expression in memory B cells. Blood 101, 4500–4 (2003).
42. Roederer, M. Interpretation of cellular proliferation data: avoid the panglossian. Cytometry A 79, 95–101 (2011).
43. Chiarini, M. et al. Newly produced T and B lymphocytes and T-cell receptor repertoire diversity are reduced in peripheral blood of fingolimod-treated multiple sclerosis patients. Mult Scler 21, 726–34 (2015).
44. Gorochov, G. et al. Perturbation of CD4+ and CD8+ T-cell repertoires during progression to AIDS and regulation of the CD4+ repertoire during antiviral therapy. Nat Med 4, 215–21 (1998).
Acknowledgements
The study was supported by Regione Lombardia [Piano Regionale Sangue 2009].
Author Contributions
D.B., M.C., A.S., V.G.: perfomed the experimental procedures. F.S.: performed statistical analysis and revised the paper. A.R., C.C., G.R.: provided clinical assistance to patients and provided related samples. L.C.: helped with discussion. A.R., G.R., A.M.R.: helped with discussion and revised the paper. L.I.: conceived, supervised the studies and wrote the paper.
Additional Information
Supplementary information accompanies this paper at http://www.nature.com/srep Competing financial interests: The authors declare no competing financial interests.
How to cite this article: Bertoli, D. et al. B- and T-lymphocyte number and function in HIV+/HIV− lymphoma
patients treated with high-dose chemotherapy and autologous bone marrow transplantation. Sci. Rep. 6, 37995; doi: 10.1038/srep37995 (2016).
Publisher's note: Springer Nature remains neutral with regard to jurisdictional claims in published maps and
institutional affiliations.
This work is licensed under a Creative Commons Attribution 4.0 International License. The images or other third party material in this article are included in the article’s Creative Commons license, unless indicated otherwise in the credit line; if the material is not included under the Creative Commons license, users will need to obtain permission from the license holder to reproduce the material. To view a copy of this license, visit http://creativecommons.org/licenses/by/4.0/