Transcriptomic context of DRD1 is associated with
prefrontal activity and behavior during
working memory
Leonardo Fazioa,b,1, Giulio Pergolaa,1, Marco Papalinoa, Pasquale Di Carloa, Anna Mondaa, Barbara Gelaoa, Nicola Amorosoc,d, Sabina Tangarod, Antonio Rampinoa,e, Teresa Popoliziob, Alessandro Bertolinoa,e, and Giuseppe Blasia,e,2
aDepartment of Basic Medical Science, Neuroscience, and Sense Organs, University of Bari Aldo Moro, 70124 Bari, Italy;bSezione di Neuroradiologia, Istituto di Ricovero e Cura a Carattere Scientifico“Casa Sollievo della Sofferenza,” 71013 San Giovanni Rotondo, Italy;cDipartimento Interateneo di Fisica “M. Merlin,” Università degli Studi di Bari Aldo Moro, 70125 Bari, Italy;dSezione di Bari, Istituto Nazionale di Fisica Nucleare, 70125 Bari, Italy; andeInstitute of Psychiatry, Bari University Hospital, 70124 Bari, Italy
Edited by Solomon H. Snyder, Johns Hopkins University School of Medicine, Baltimore, MD, and approved April 10, 2018 (received for review October 12, 2017)
Dopamine D1receptor (D1R) signaling shapes prefrontal cortex (PFC) activity during working memory (WM). Previous reports found higher WM performance associated with alleles linked to greater expression of the gene coding for D1Rs (DRD1). However, there is no evidence on the relationship between genetic modulation ofDRD1 expression in PFC and patterns of prefrontal activity during WM. Furthermore, pre-vious studies have not considered that D1Rs are part of a coregulated molecular environment, which may contribute to D1R-related prefron-tal WM processing. Thus, we hypothesized a reciprocal link between a coregulated (i.e., coexpressed) molecular network includingDRD1 and PFC activity. To explore this relationship, we used three indepen-dent postmortem prefrontal mRNA datasets (totaln = 404) to char-acterize a coexpression network includingDRD1. Then, we indexed network coexpression using a measure (polygenic coexpression index—DRD1-PCI) combining the effect of single nucleotide polymor-phisms (SNPs) on coexpression. Finally, we associated theDRD1-PCI with WM performance and related brain activity in independent sam-ples of healthy participants (totaln = 371). We identified and repli-cated a coexpression network includingDRD1, whose coexpression was correlated withDRD1-PCI. We also found that DRD1-PCI was associated with lower PFC activity and higher WM performance. Be-havioral and imaging results were replicated in independent samples. These findings suggest that genetically predicted expression ofDRD1 and of its coexpression partners stratifies healthy individuals in terms of WM performance and related prefrontal activity. They also high-light genes and SNPs potentially relevant to pharmacological trials aimed to test cognitive enhancers modulatingDRD1 signaling. gene coexpression network
|
DRD1|
working memory|
fMRI|
polygenic scoreD
ecades of exploration of the relationship between dopamine (DA) and cognition have established a crucial role of pre-frontal D1 receptors (D1Rs) in working memory (WM) (1–8). D1Rs modulate prefrontal synaptic neurotransmission by mediat-ing recurrent excitation in local circuits, which is considered a key WM mechanism (3, 9, 10). Furthermore, increased D1R signaling enhances the signal-to-noise ratio in prefrontal neuronal networks (5) and contributes to improved WM performance in nonhuman primates (11). Further evidence also suggests that extreme hypo- or hyperstimulation of D1Rs is detrimental to prefrontal physiology related to WM and predicts poorer WM performance (1, 6, 12, 13). Taken together, these results suggest that the level of D1R sig-naling in the prefrontal cortex (PFC) is important for efficient WM processing. In particular, functional imaging studies in humans have considered lower prefrontal activity paralleled by higher or unaffected WM performance as a correlate of efficient WM pro-cessing (14).Notably, WM behavior and related prefrontal activity have an estimated heritability around 0.4 (15–17), and the heritable
component of WM is associated with DA-related genetic variation (18). Given the primary role of D1R signaling in WM, it has been hypothesized that, across individuals, differences in WM behavior and brain activity may be related to the genetics of D1R signaling. Consistently, functional single nucleotide polymorphisms (SNPs) of the gene coding for D1Rs (DRD1, located in the 5q35.2 region in chromosome 5) have been associated with cognition and executive function. For example, previous studies have reported that the A allele ofDRD1 rs686 predicts greater in vitro DRD1expression (18– 20). Another DRD1 SNP, rs5326, has been associated with gene expression in the temporal gyrus and withDRD1 transcriptional activity in human neuroblastoma cells (19, 21). Additionally, the A allele, associated with lowerDRD1 expression, predicted poorer executive function estimates. Overall, this evidence sug-gests that DRD1 functional genetic variants may explain part of the interindividual variability in WM performance. These findings
Significance
Dopamine D1receptors in the prefrontal cortex (PFC) are critical for working memory (WM). However, it is unknown how D1-related genetic background mediates differences in WM performance be-tween humans. Furthermore, previous studies did not consider thatDRD1 is likely part of a coregulated molecular network, which may contribute to WM performance and its underlying neural correlates. The key of this research is the identification of a re-lationship between genetically predicted coexpression and WM processing. In particular, genetically predicted greater DRD1-related coexpression was associated with lower PFC activity and higher WM performance, indicating greater WM efficiency. Our findings may help to link gene expression with brain ac-tivity and to develop WM-enhancing drugs by differentiating individuals based on their genetic background.
Author contributions: L.F., G.P., and G.B. designed the research; G.P., S.T., and A.B. pro-vided access to data and research funding; L.F., B.G., and T.P. collected data; L.F., G.P., M.P., P.D.C., A.M., N.A., S.T., and A.R. analyzed the data; L.F., G.P., P.D.C., N.A., S.T., A.R., A.B., and G.B. interpreted the data; L.F. and G.P. wrote the paper; and M.P., P.D.C., A.M., B.G., N.A., S.T., A.R., T.P., A.B., and G.B. revised and edited versions of the paper. Conflict of interest statement: A.B. is a stockholder of Hoffmann–La Roche Ltd. and has also received lecture fees from Otsuka, Jannsen, and Lundbeck and consultant fees from Biogen. A.R. has received travel fees from Lundbeck. G.P. has been the academic super-visor of a Roche collaboration grant (years 2015–2016) that funds his salary and the salary of A.R. All other authors have no biomedical financial interests and no potential conflicts of interest.
This article is a PNAS Direct Submission. Published under thePNAS license.
1L.F. and G.P. contributed equally to this work.
2To whom correspondence should be addressed. Email: [email protected]. This article contains supporting information online atwww.pnas.org/lookup/suppl/doi:10.
1073/pnas.1717135115/-/DCSupplemental.
NEUROSCI
also indicate that alleles associated with greaterDRD1 expression predict higher cognitive performance. However, previous works have fallen short of relating predicted gene expression ofDRD1 in the PFC with WM because the association between genetic variation andDRD1 expression has not been studied in the human PFC. Furthermore, there is no evidence about the relationship between genetically determined DRD1 expression and PFC ac-tivity during WM in humans.
Notably,DRD1 has never been studied in the context of gene networks. Genes are expressed in coregulated networks (20), but little is currently known on (i) the interplay between DRD1 and other genes in terms of gene expression regulation and (ii) the link between coregulated networks of genes includingDRD1 and pre-frontal activity during WM. Therefore, the investigation of gene coexpression networks may yield more information and predictive power compared with those obtained by focusing onDRD1 per se (20, 21). Additionally, recent studies have shown that combining multiple SNPs affords greater power on gene expression prediction studies compared with single SNP studies (22, 23).
On this basis, our aim was to identify a coexpression gene set includingDRD1 in the PFC and the genetic variants associated with the coexpression of theDRD1-related gene set. Furthermore, we investigated how genetically predicted coexpression of the DRD1 gene set is associated with prefrontal WM processing. To this pur-pose, we refined an approach we have reported in a previous proof-of-concept work (21) (Fig. 1). Briefly, in the present work, after identifying a transcriptome-wide coexpression network in post-mortem human dorsolateral PFC (DLPFC) (Brodmann area 46), we selected the coexpression gene set includingDRD1. Then, we identified SNPs associated with coexpression [coexpression quanti-tative trait loci (coeQTLs)] of such a gene set. Thus, we combined the effect of these SNPs on coexpression into an index (polygenic coexpression index—DRD1-PCI) predicting the coexpression of the DRD1-related gene set. Finally, we tested whether the DRD1-PCI was linked with interindividual variation in PFC activity and be-havior during WM in two independent samples of healthy individuals
who participated in an N-back fMRI study. Based on previous studies (14, 18, 19), we expected that alleles predicting coexpression of the DRD1 network and greater DRD1 expression would also be associ-ated with higher WM performance and lower PFC activity esti-mates, i.e., greater PFC efficiency. To account for potential effects ofDRD2 on the target phenotypes, we included our previously publishedDRD2-PCI in the fMRI and behavioral analyses. Results
Weighted Gene Coexpression Network Analysis and Parceling. We used a previously reported gene coexpression network (21), based on the public dataset Braincloud (24) (Tables 1 and 2) of transcriptome-wide dorsolateral PFC gene expression. Using a newly developed technique (25), we parceled the very large Weighted Gene Coexpression Network Analysis (WGCNA) module that includedDRD1 (2,452 genes) to identify a more fo-cused coexpression gene set related with DRD1 expression. The parceling procedure detailed the DRD1 transcriptomic context, and we obtained a smaller coexpression set of 126 genes (SI Ap-pendix, Table S1). We replicated the gene set structure using the BrainEAC dataset (26) and the RNA sequencing dataset published by the CommonMind Consortium (CMC) (27) (Tables 1 and 2) and found that these genes were more strongly connected than chance (BrainEACP = 0.0037; CMC P < 0.0001) (SI Appendix, Fig. S1C). Additionally, we found that, in BrainEAC, 85 of 126 genes contributed to the first principal component of gene expression (module eigengene) in the same direction observed in Braincloud, a higher-than-chance proportion (binomial test,P = 5.7× 10⁻⁶). In CMC, 76 of 106 genes covaried just as observed in Braincloud (binomial test,P = 1.6 × 10⁻⁶). Therefore, both gene connectivity and the direction of gene coexpression was largely preserved in two independent datasets. Neither the large module nor the restricted gene set included theDRD2 gene, and we found no significant correlation between DRD1 and DRD2 (n = 199, Spearman’s ρ = 0.12, P = 0.09). None of the genes in the DRD1 set were in theDRD2 module we previously published (21).
We investigated the biological functions of this gene set and found that protein binding genes (88 hits, 1.38-fold enrichment, Bonferroni correctedP = 0.021) and genes functionally associated with DNA-dependent ATPase activity (6 hits, 12-fold enrichment, Bonferroni correctedP = 0.036) were overrepresented. The first principal component of gene set expression (gene set eigengene, GSE), which we used as a coexpression measure, explained 50% of the gene set expression variance.DRD1 belonged to a minority of 47 genes negatively correlated with the GSE (SI Appendix, Fig. S1B) (R2= 0.38, P < 2.2 10−16), suggesting thatDRD1 expression was higher when the expression of the majority of its partner genes was lower.
DRD1 Polygenic Coexpression Index Computation in Postmortem Tissue. We first assessed whether SNPs in the genomic proximity ofDRD1 were associated withDRD1 expression but found no significant hit (uncorrectedα = 0.05). Then, we identified SNPs associated with the GSE using previously reported methods (21). Out of 3,079 SNPs included in the coexpressed genes and their 100-kbp flanks, we obtained a set of 13 independent significant hits (Table 3 andSI Appendix, Table S3). The ensemble of the 13 SNPs selected and the genetic variants in full linkage disequilibrium with them (R2= 1) included more genetic regulatory elements than expected by chance in the DLPFC (P = 0.03) (28). We used these 13 SNPs to compute a Fig. 1. Concept illustration of the study design. (A) Genome-wide
geno-typing; (B) Weighted Gene Coexpression Network Analysis identified mod-ules of coexpressed genes; (C) prioritization of the coexpression module including DRD1 (DRD1-module); (D) selection of the genes most associated with DRD1 expression within the DRD1-module (DRD1 gene set); (E) com-putation of a DRD1 polygenic coexpression index, using genes within the DRD1 gene set (DRD1-PCI); (F) association of DRD1-PCI with working mem-ory performance and related brain activity.
Table 1. Gene expression datasets used in the study
Datasets Age RIN PMI pH
BC (N199; 139_; AA105) 32[20] 8.4[0.5] 30[15] 6.5[0.3] BrainEAC (N26; 20_; AA0) 62[17] 6.6[0.5] 43[28] 6.3[0.2] CMC (N179; 115_; AA34) 58[17] 8.1[0.6] 16[7] 6.6[0.3] SDs are indicated between square brackets. AA, African American; BC, BrainCloud dataset; CMC, CommonMind Consortium dataset; N, sample size; PMI, postmortem interval in hours; RIN, RNA integrity number.
polygenic coexpression index (PCI) associated withDRD1 gene set coexpression (DRD1-PCI) (SI Appendix, Table S2 reports the weights attributed to all genotypes of these 13 SNPs). Addi-tionally, we performed leave-one-out cross-validation on the SNP selection to estimate the reliability of theDRD1-PCI as a proxy of gene coexpression. We found that the DRD1-PCI significantly predicted the GSE in subjects not included in the training set (R2= 0.024,P = 0.029) (SI Appendix, Fig. S2). SinceDRD1 was negatively correlated with the GSE, we reversed theDRD1-PCI to have it positively correlated withDRD1 expression for the sake of simplicity of graphic representation (SI Appendix, Fig. S2). We also screened possible associations of theDRD1-PCI with confounding variables [age, sex, ethnicity, RNA integrity number (RIN), pH, postmortem interval] and found a significantly higherDRD1-PCI in Caucasians than in African Americans (independentt test, jt198j = 2.9, P = 0.004), likely because of the population stratification of allelic fre-quencies. Analysis of covariance (ANCOVA) on the cross-validated DRD1-PCI revealed no significant main effect of ethnicity on the GSE (F1,195= 0.44; P = 0.51). Instead, the main effect of the leave-one-out cross-validated DRD1-PCI remained significant (F1,195 = 5.23;P = 0.023). There was no significant DRD1-PCI × ethnicity interaction on GSE (F1,195= 0.08; P = 0.77), suggesting no signifi-cant difference in the slope of the association across ethnicities. Indeed, the cross-validatedDRD1-PCI was associated with the GSE both in African Americans and Caucasians with comparable effect sizes (Caucasians:R2= 0.03; African Americans: R2= 0.022) (SI Appendix, Fig. S3). TheDRD1-PCI association with the GSE was replicated in the same direction in BrainEAC (R2= 0.12, one-tailed P = 0.041) (SI Appendix, Fig. S2) and in CMC (R2= 0.017, one-tailedP = 0.043) (SI Appendix, Fig. S2). Notably, the association was significant despite the differences between datasets (including eth-nicity differences) (Tables 1 and 2) and preprocessing procedures. Association Between the DRD1-PCI and WM Processing.We tested the association between theDRD1-PCI and WM processing (29) in a sample of 371 unrelated healthy adult Caucasian volunteers (Tables 1 and 2).
fMRI.A general linear model was used to investigate the association betweenDRD1-PCI and brain activity using both linear and qua-dratic terms of the DRD1-PCI. The quadratic term of the DRD1-PCI was included to assess the documented U-shaped dose– response function betweenDRD1 stimulation and PFC activity (5). We also included as a covariate the linear and quadratic term of the DRD2-PCI (21, 30), to control for potentially confounding effects. We found a negative association of the linear term of the DRD1-PCI with blood oxygen level-dependent (BOLD) response in the left PFC [middle frontal gyrus—Brodmann Area 10: x, y, z = −29, 53, 24; F = 22.25; Z = 4.51; family-wise error (FWE)-corrected cluster extent= 7 voxels, ∼345 mm3, whole brain FWE-correctedP = 0.006] (Fig. 2 A and C). There were no other significant effects or interactions involving theDRD1-PCI. Simi-larly, in the fMRI replication sample, we found a negative associ-ation between theDRD1-PCI and activity in the left PFC, using the same whole brain statistical threshold (middle frontal gyrus— Brodmann Area 46: x, y, z = −40, 34, 5; T = 4.41; Z = 4.26; FWE-corrected cluster extent= 6 voxels, ∼316 mm3; whole brain
FWE-correctedP = 0.02) (Fig. 2 B and D). These findings imply that the BOLD signal was lower in individuals with higher pre-dictedDRD1 expression, corresponding to lower predicted coex-pression of the majority of the gene set.
Behavioral Results.We used differential WM accuracy [accuracy at the greater WM load minus accuracy at the lower WM load (ΔWM)] as a WM performance measure, as suggested by previous work (31). As in the fMRI study, we tested the association between DRD1-PCI and WM performance using both linear and quadratic terms of theDRD1-PCI and of the DRD2-PCI. In the discovery sample, the general linear model revealed a main effect of the linear term of theDRD1-PCI (F1,144= 6.3; P = 0.014; partial η2= 0.041) (Fig. 2E) (see theSI Appendixfor other effects). The DRD1-PCI correlated positively withΔWM, indicating higher WM capacity with greater predicted DRD1 expression. The association of the DRD1-PCI with ΔWMwas also significant in the same direction in the replication sample (t186= 1.91; one-tailed P = 0.029; partial η2= 0.019) (Fig. 2F). Therefore, individuals with alleles associated with higherDRD1 expression and lower coexpression of the gene set had lower BOLD activity and higher behavioral performance.
To investigate the potential relationship betweenDRD1-related physiology, prefrontal activity, and other components of the dopa-minergic system, such asDRD2, we used mediation and moderation analyses. Briefly, the analyses revealed significant mediation of prefrontal BOLD in the relationship between theDRD1-PCI and ΔWM, and such mediation was moderated by the DRD2-PCI. However, the effects detected in the discovery sample failed to replicate and are reported inSI Appendix, Mediation Analysis. Discussion
Multiple lines of evidence suggest that D1R signaling exerts a key effect on WM performance and WM-related brain activity. It has been hypothesized that DRD1 genetic variation may affect D1R signaling, e.g., by affectingDRD1 expression (18, 19). However, to our knowledge, there is no evidence of association ofDRD1 ge-netic variation with gene expression in the PFC. More impor-tantly, there are no previous studies addressing how genetic ensembles related toDRD1 affect prefrontal function during WM. TheDRD1-PCI that we generated in the present study is an index of predicted coexpression of aDRD1-related gene set in the PFC. We found that this polygenic index was associated with WM be-havior and related PFC activity across independent samples. In particular, the greater theDRD1-PCI, the higher the differential accuracy and the lower the PFC response during the N-back. These relationships survived, even considering the effect of Table 2. fMRI and behavioral datasets used in the study
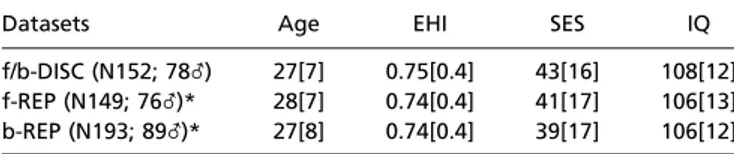
Datasets Age EHI SES IQ
f/b-DISC (N152; 78_) 27[7] 0.75[0.4] 43[16] 108[12]
f-REP (N149; 76_)* 28[7] 0.74[0.4] 41[17] 106[13]
b-REP (N193; 89_)* 27[8] 0.74[0.4] 39[17] 106[12]
SDs are indicated between square brackets. b-REP, behavioral replication sample; EHI, Edinburgh Handedness Inventory; f/b-DISC, fMRI and behavioral discovery sample; f-REP, fMRI replication sample; IQ, intelligence quotient; SES, socioeconomic status.
*f-REP and b-REP are partially overlapping (123 individuals in common).
Table 3. Ranked single nucleotide polymorphisms (SNPs) included in the computation of theDRD1-PCI
SNP (module gene) Association with GSE CG DRD1 rs7487813 (UBE2N) 2.22× 10⁻⁵ 0.003 0.009 rs2267844 (SLC26A6) 1.43× 10⁻⁴ 0.013 0.007 rs663208 (CCDC81) 3.71× 10⁻⁴ 0.013 0.031 rs17005918 (SCOC) 4.51× 10⁻⁴ 0.001 0.002 rs13101217 (SEC22A) 5.35× 10⁻⁴ 0.015 0.006 rs1859464 (PCNX1) 9.22× 10⁻⁴ 0.707 0.002 rs2278214 (MGAT4A) 1.21× 10⁻³ 0.009 0.001 rs7915524 (FAM171A1) 2.05× 10⁻³ 0.207 0.256 rs12509826 (SCOC) 3.67× 10⁻³ 0.004 0.189 rs10134399 (XRCC3) 4.26× 10⁻³ 0.079 0.095 rs10906841 (FAM171A1) 4.52× 10⁻³ 0.003 0.356 rs2306251 (GAK) 4.61× 10⁻³ 0.118 0.12 rs11602122 (TPCN2) 4.83× 10⁻³ 0.221 0.005
The association columns report the P values of the association. The expression of genes reported in bold font is negatively correlated with the gene set eigen-gene, as is also the case of DRD1. CG, closest gene; GSE, gene set eigengene.
NEUROSCI
another component of the dopaminergic system,DRD2, indexed by theDRD2-PCI. Based on previous models positing that greater PFC activity despite similar or lower behavioral proficiency is a correlate of less efficient WM processing (4, 7, 14), these results suggest that greater predictedDRD1 expression and lower coexpression of the DRD1-related gene set are associated with greater WM efficiency. The Genetic Architecture of DRD1 Transcription. The gene set we identified is reproducibly coexpressed, as shown by the replication in two independent datasets (26); further, this gene set seems in-dependent of the transcriptomic context ofDRD2. It is noteworthy that the majority of the genes in this set are down-regulated when DRD1 is up-regulated. Gene ontology analysis revealed that genes related with DNA helicase activity were overrepresented in this set. Additionally, two of the SNPs that we identified as coeQTLs (rs7487813 and rs10134399) map close to genes in the coexpression gene set that are associated with DNA double-strand break repair (UBE2N and XRCC3). Both SNPs are associated, albeit weakly, with the expression of the respective genes (Table 3) (rs10134399 is associated with XRCC3 in an independent study) (32). Double-strand DNA breaks have been highlighted as a mechanism link-ing neuronal activity with transcription regulation (33). Based on this activity–transcription relationship, the fact that DRD1 expres-sion covaries with that of genes related with double-strand DNA break repair may suggest a link between D1R-related neuronal activity and transcription mechanisms of the DRD1-related gene set. Even if this contention is speculative based on the current re-sults, relationships between transcription levels and brain activity are supported by the literature (34). The evidence we report may be used to select partner genes of DRD1 as candidate genes for mechanistic investigations of the link between D1R activity and DRD1 gene set transcription levels in cell biology experiments.
The Role of Prefrontal D1Receptors in Working Memory.D1R sig-naling supports WM-related persistent neural firing in the PFC (3, 10), allowing greater focus of neural resources on the task at hand (5). According to the model put forward by Seamans and Yang (5), D1Rs enhance the signal-to-noise ratio in PFC neurons during WM performance by promoting activity in recurrent cir-cuits. D1Rs are thought to act via a specific block of task-unrelated excitatory inputs in the PFC (6, 10, 35). Consistently, small in-creases in D1R signaling have been linearly correlated with WM behavior (10, 11, 36–38). Furthermore, previous findings indicated poorer WM performance in genetic or clinical conditions associated with reducedDRD1 expression (19, 39, 40). Overall, the present re-sults are consistent with these previous findings. In fact, greater predicted DRD1 expression—as inferred based on its coexpression gene set—was associated with lower PFC activity, which has been consistently interpreted as a correlate of greater prefrontal efficiency during WM (14). Furthermore, greater predictedDRD1 expression was also associated with higher WM behavioral accuracy. These findings also suggest that the regulation of DRD1 expression is polygenic, rather than only based on genetic variants proximal to DRD1, and is embedded in the context of gene network coexpression. Seamans and Yang (5) posited that excessive levels of D1Rs impair WM performance (inverted-U model of WM function). Both animal (35) and human studies (41) support this in-terpretation. However, we found that the quadratic component of the PCI did not provide a significant fit either in brain or in behavioral phenotypes. It should be noted that we evaluated a genetic component associated with physiological variation in DRD1 transcription levels in healthy individuals. Thus, a possible interpretation of our results is that we investigated variation within the physiological portion of the inverted-U curve—phar-macological stimulation or more extreme genotypic configura-tions may be necessary to observe the full inverted-U curve. Limitations.The SNP set we used to compute theDRD1-PCI does not include variants that are significantly associated with coex-pression per se because we used an uncorrected statistical threshold. Instead, we identified a set of 13 SNPs which, together, explain part of the coexpression of theDRD1 gene set. Consistent with a pu-tative role of the SNPs here identified as functional variants, pre-viously reported regulatory variants of gene expression in the DLPFC were overrepresented in this SNP set. Further issues to be addressed are the different localization of the clusters identified in the discovery and replication samples and the lack of replication of the mediation and moderation analyses. Both the discovery and replication clusters were located in PFC regions relevant for WM (2). While relaxing the threshold revealed a substantial overlap between the clusters (P < 0.05, x, y, z = −40, 12, 9; Z = 2.28; k = 37), sample characteristics and study protocols may explain the differ-ence in spatial localization when more stringent statistical thresh-olds are used. It remains noteworthy that the effect of the DRD1-PCI was significant in the PFC in the same direction in two independent samples, despite the different protocols employed. Conclusions
The present results shed light on the understanding of the genetic modulation of WM-related phenotypes via D1Rs and their tran-scriptomic context. Since the functional variants in multiple genes coexpressed with DRD1 allow in vivo prediction of DRD1 ex-pression in the DLPFC, they may be relevant to clinical conditions associated with dysregulation of this gene (40). For example, clinical trials using D1R agonists on patients with schizophrenia failed to demonstrate amelioration of cognitive symptoms (42). Thus, our findings may help in developing WM-enhancing drugs for clinical populations, acting on D1Rs (42, 43), in a personalized medicine framework. Such an approach could be especially rele-vant for clinical conditions characterized by pervasive WM deficits like dementia, schizophrenia, and bipolar disorder (44–46). Fig. 2. Association of the DRD1-PCI with working memory-related prefrontal
activity and working memory performance. (A) Rendering of the brain activity significantly associated in the discovery sample with DRD1-PCI in the dorso-lateral prefrontal cortex, and color bar with the relative Z scores. (B) Rendering of the brain activity significantly associated in the replication sample with DRD1-PCI in the dorsolateral prefrontal cortex, and color bar with the relative Z scores. Left in the figures is left in the brain. (C and D) Scatter plots of the Z scores of the estimated activity in these clusters (y axis) as a function of the Z score of the DRD1-PCI. (C) Discovery sample; (D) replication sample. (E and F) Scatter plots show the Z score of the DRD1-PCI on the x axis and differential accuracy on the y axis. (E) Discovery sample; here the y axis reports the average of the two loads (Δ2–1 andΔ3–2) after marginalization for covariates and standardization. (F) Replication sample; here, the y axis reportsΔ2–1after marginalization for covariates and standardization. Plots show trend lines and 95% confidence intervals of the mean.
Materials and Methods
Gene Coexpression Network Analysis in Postmortem PFC. We used Braincloud (24) (Tables 1 and 2) and Weighted Gene Coexpression Network Analysis (WGCNA) to obtain a transcriptome-wide coexpression network in the post-mortem DLPFC of 199 individuals free of psychiatric and neurologic diseases. We used the same transcriptome-wide coexpression network published in our previous work (21), with the same subjects, without identifying a new network. Briefly, in our previous work, we selected postnatal samples from Caucasian and African American subjects with RNA integrity (RIN)>7.0, to ensure high data quality (47), and preprocessed the data to reduce the effect of confounders [demographical variables (i.e., age, sex, ethnicity) and sample quality features (i.e., RIN, pH, postmortem interval); see theSI Appendixfor details]. DRD1 clustered within a module including 2,452 probes. In this module, DRD1 was not a hub gene (scaled within-module connectivity was close to the median). The module did not include any probes of the gene DRD2. The number of probes in this module was very high and difficult to study as a single unit. Recent evidence shows that further parceling of WGCNA modules can improve the detection of robust gene sets (48). To obtain the parceling, we used the hard-thresholding procedure described by Monaco et al. (49) based on the topological properties of the module (50, 51) (SI Appendix). Throughout the manuscript, we refer to this subset of coexpressed genes within the WGCNA DRD1 module as the“DRD1 gene set.” Then, we in-vestigated the biological functions of this gene set by using the software AMIGO2 (amigo2.geneontology.org/amigo) to assess the overrepresentation of gene ontology labels. Next, we sought to replicate in independent datasets the connectivity between members of the DRD1 parceled gene set. With this aim, we used the publicly available dataset BrainEAC (www.braineac.org/) and the CommonMind Consortium (CMC) RNA sequencing data derived from post-mortem human PFC (27) (Tables 1 and 2 andSI Appendix). We preprocessed BrainEAC and CMC expression values using the remove unwanted variation al-gorithm (RUV) designed to identify and subsequently remove latent confound-ing factors (52) (SI Appendix). We did not use explicit confounders. In Braincloud, we kept the original WGCNA for consistency with our prior work. Then, we used the permutation procedure described by Johnson et al. (53) (10,000 permuta-tions) to test whether the gene–gene relationships between DRD1 coexpression partners was significantly greater than a null distribution of random gene pression in these independent datasets. Finally, we asked whether gene ex-pression covariation in both replication datasets had the same direction observed in Braincloud (SI Appendix).
DRD1 Polygenic Coexpression Index Computation. To assess whether gene-specific eQTLs predicted DRD1 expression, we performed a local eQTL study by associating SNPs within 100 kbp up- and downstream DRD1 with DRD1 expression, as done in previous work (23). Then, we associated the GSE with SNPs to identify a pool of SNPs that, together, reliably predict coexpression. Hence, our aim was not to identify SNPs that, on their own right, predict coexpression—which requires statistics corrected for multiple comparisons. We selected SNPs falling into a window of 100 kbp up- and downstream the start and end position of each gene in the DRD1 gene set (as in previous works) (21, 23) (see theSI Appendixfor further selection criteria). To select SNPs included in the DRD1-PCI, we used the same criterion published by Pergola et al. (21): i.e., uncorrected P< 0.005 in the association with the GSE (SI Appendix). We also assessed the biological significance of the SNP set identified by in-terrogating the software Haploreg v. 4.1 (archive.broadinstitute.org/ mammals/haploreg/haploreg.php) (28). Using Haploreg, we computed the statistics for overrepresentation of DLPFC (BA9/46) regulatory elements in our list of SNPs; note that also Braincloud data were obtained from BA46. Further analyses investigated the association of these SNPs with DRD1 and other module genes (SI Appendix). Once we identified the SNPs associated with coexpression of the related gene set, we generated the DRD1-PCI predicting the combined effect of such SNPs on DRD1 GSE. This index actually refers to the entire gene set, and not just to DRD1; we indicate it by this name because we selected a priori the module including DRD1 to investigate the transcriptomic context of this gene, which is key to WM performance and its underlying brain activity. The index computation is based on the signal detection theory and quantifies the magnitude of the differences between genotypic populations of each of the SNPs selected (SI Appendix). After validating the DRD1-PCI by means of cross-validation (SI Appendix), we replicated the association of the DRD1-PCI with the GSE using BrainEAC/CMC frontal cortex total gene expression data and geno-types. For these replications, we replaced genotypes with the weights detected in Braincloud. Based on the results in the Braincloud sample, we tested the negative correlations between the DRD1-PCI and replication GSEs using one-tailed P values (we were only interested in associations with the same direction in both the discovery and replication samples).
Assessment of WM Processing in Healthy Humans.
Participants. Three hundred and seventy-one unrelated adult Caucasian in-dividuals participated in the study (Tables 1 and 2) (106 of them were also included in our recently published work on the DRD2-PCI) (21) and were genome-wide genotyped using previously published procedures (54). One hundred and fifty-two subjects formed the discovery sample for the fMRI and the behavioral study and performed the 1-, 2-, and 3-Back runs of the N-Back WM task (29). Furthermore, separate cohorts of 149 and 193 partic-ipants formed, respectively, the replication sample for the fMRI study (only 2-Back acquired) and the behavioral study (only 1- and 2-Back acquired). Inclusion criteria and sociodemographic assessments are detailed inSI Appendix. The present study was approved by the local IRB at the University of Bari Aldo Moro. Written informed consent was obtained from all participants after full explanation of all procedures, which were carried out according to the Decla-ration of Helsinki.
Neuropsychological task. We used the widely adopted N-back task to probe WM (14) in both the behavioral and the fMRI studies (SI Appendix). During fMRI, we used three runs of a block design version of the task: 1-Back vs. 0-Back; 2-Back vs. 0-Back, and 3-Back vs. 0-Back (named 01-Back, 02-Back, and 03-Back, re-spectively), each lasting 240 s. Participants in the fMRI replication sample per-formed the 02-Back run only. Participants included in the behavioral discovery sample performed three blocks of all of the three WM conditions, while those included in the behavioral replication sample performed 1-Back and 2-Back. Imaging study. Blood oxygen level-dependent (BOLD) signal was recorded by a GE Signa 3T scanner (General Electric), using a gradient-echo planar imaging sequence to acquire 120 volumes for each N-Back run. We used Statistical Parametric Mapping 12 (SPM12) (www.fil.ion.ucl.ac.uk/spm) to analyze the fMRI data using standard procedures (55) (SI Appendix). Since we developed a continuous predictor of DRD1 expression, we had the opportunity to control for nonlinear effects using the quadratic term of the DRD1-PCI as a covariate both in the behavioral and imaging analyses. In the fMRI discovery sample, we tested the association of the DRD1-PCI with brain activation using a general linear model (see theSI Appendixfor model specification). We used F contrasts to investigate the association between DRD1-PCI and brain activity using both linear and quadratic terms of the DRD1-PCI. We masked results selecting the voxels in which the activity was higher during WM than the baseline to select areas belonging to the WM brain network. This brain network is the most plausible set of regions likely affected by the transcriptomic context of DRD1 during this cognitive process. We generated the WM activity mask by identifying areas significantly activated separately per load (1-back versus 0-back, 2-back versus 0-back, and 3-back versus 0-back) and computed the conjunction null contrast between the three loads (whole-brain P= 0.05, uncorrected) (SI Appendix, Fig. S4). To correct the results of the linear and quadratic terms of the PCI for multiple comparisons, we used the stringent voxel-wise threshold of P< 0.05, whole-brain FWE-corrected, with a minimum extent of five voxels (∼264 mm3). To further detail our results, we displayed these clusters at P< 0.001, uncorrected, in the figures. We addi-tionally explored the relationship between WM-related brain activity, WM performance, and DRD1-PCI, as well as the interaction with DRD2-PCI using mediation and moderation models (SI Appendix). In the replication sample, we computed an ANCOVA on the 2-Back> 0-Back contrast, using the same whole-brain FWE correction. Based on the results in the discovery sample, we com-puted only a t test on the negative linear term of the DRD1-PCI regression slope. Results are shown using the same criteria followed in the discovery sample and masked with the same WM network mask.
Behavioral analyses. We used differential WM accuracy [accuracy at the greater WM load minus accuracy at the lower WM load (ΔWM)] as a WM capacity measure (30, 31). This measure is associated with the increase of cognitive load in N-back sessions performed outside the scanner. It usually takes negative values and is a direct measure of WM capacity: i.e., greater values of differential accuracy indicate consistent WM performance in the face of load increase. In the behavioral discovery sample, we computed the differential ac-curacy between 2-Back and 1-Back (Δ2–1) and between 3-Back and 2-Back (Δ3–2) (31). Thus, we computed a repeated measures general linear model. For the behavioral replication sample, onlyΔ2–1was available, and it was included in a general linear model (see theSI Appendixfor model specification).
ACKNOWLEDGMENTS. Permission to use the CommonMind Consortium dataset was graciously provided to G.P. by the National Institute of Mental Health (NIMH). Brain tissue for the CMC study was obtained from the following brain bank collections: the Mount Sinai NIH Brain and Tissue Repository, the University of Pennsylvania Alzheimer’s Disease Core Center, the University of Pittsburgh NeuroBioBank and Brain and Tissue Repositories, and the NIMH Hu-man Brain Collection Core. The CMC leadership is as follows: Pamela Sklar, Joseph Buxbaum (Icahn School of Medicine at Mount Sinai), Bernie Devlin, David Lewis (University of Pittsburgh), Raquel Gur, Chang-Gyu Hahn (University of Pennsylvania),
NEUROSCI
Keisuke Hirai, Hiroyoshi Toyoshiba (Takeda Pharmaceuticals Company Limited), Enrico Domenici, Laurent Essioux (F. Hoffman-La Roche Ltd.), Lara Mangravite, Mette Peters (Sage Bionetworks), Thomas Lehner, and Barbara Lipska (NIMH). Data acquisition was made possible by Dr. Linda A. Antonucci, Riccarda Lomuscio, Dr. Marina Mancini, Rita Masellis, Dr. Annamaria Porcelli, Tiziana Quarto, Dr. Raffaella Romano, and Dr. Paolo Taurisano (University of Bari Aldo Moro). We also gratefully acknowledge the work by Prof. Roberto Bellotti, Dr. Pierluigi Selvaggi, Dr. Alfonso Monaco, Nicla Manzari, Roberta Passiatore, Graziella Amico, and Nicoletta Trotta (University of Bari Aldo Moro), who contrib-uted to data analysis. Finally, we thank all the volunteers who took part in the study. This work was supported by a“Capitale Umano ad Alta Qualificazione” grant by Fondazione Con Il Sud, by National Alliance for Research on Schizophrenia
and Depression Grant 28935, by“Ricerca Finalizzata” Grant PE-2011-02347951 (to A.B.), and by a Hoffmann–La Roche Collaboration Grant (to G.P.). This project received funding from the European Union Seventh Framework Programme for research, technological development, and demonstration under Grant Agreement 602450. Data were generated as part of the CommonMind Consortium supported by funding from Takeda Pharmaceuticals Company Limited, F. Hoffman-La Roche Ltd., and NIH Grants R01MH085542, R01MH093725, P50MH066392, P50MH080405, R01MH097276, R01-MH-075916, P50M096891, P50MH084053S1, R37MH057881 and R37MH057881S1, HHSN271201300031C, AG02219, AG05138, and MH06692. This paper reflects only the authors’ views, and the European Union is not liable for any use that may be made of the information contained therein.
1. Goldman-Rakic PS (1990) Cellular and circuit basis of working memory in prefrontal cortex of nonhuman primates. Prog Brain Res 85:325–335; discussion 335–336. 2. Rottschy C, et al. (2012) Modelling neural correlates of working memory: A
co-ordinate-based meta-analysis. Neuroimage 60:830–846.
3. Fuster JM, Alexander GE (1971) Neuron activity related to short-term memory. Science 173:652–654.
4. D’Esposito M, Postle BR (2015) The cognitive neuroscience of working memory. Annu Rev Psychol 66:115–142.
5. Seamans JK, Yang CR (2004) The principal features and mechanisms of dopamine modulation in the prefrontal cortex. Prog Neurobiol 74:1–58.
6. Jacob SN, Stalter M, Nieder A (2016) Cell-type-specific modulation of targets and dis-tractors by dopamine D1 receptors in primate prefrontal cortex. Nat Commun 7:13218. 7. Van Snellenberg JX, et al. (2015) Dynamic shifts in brain network activation during supracapacity working memory task performance. Hum Brain Mapp 36:1245–1264. 8. Blokland GA, et al. (2008) Quantifying the heritability of task-related brain activation
and performance during the N-back working memory task: A twin fMRI study. Biol Psychol 79:70–79.
9. Gao WJ, Krimer LS, Goldman-Rakic PS (2001) Presynaptic regulation of recurrent ex-citation by D1 receptors in prefrontal circuits. Proc Natl Acad Sci USA 98:295–300. 10. Arnsten AF, Jin LE (2014) Molecular influences on working memory circuits in
dor-solateral prefrontal cortex. Prog Mol Biol Transl Sci 122:211–231.
11. Vijayraghavan S, Wang M, Birnbaum SG, Williams GV, Arnsten AF (2007) Inverted-U dopamine D1 receptor actions on prefrontal neurons engaged in working memory. Nat Neurosci 10:376–384.
12. Paspalas CD, Goldman-Rakic PS (2005) Presynaptic D1 dopamine receptors in primate prefrontal cortex: Target-specific expression in the glutamatergic synapse. J Neurosci 25:1260–1267.
13. Williams GV, Castner SA (2006) Under the curve: Critical issues for elucidating D1 receptor function in working memory. Neuroscience 139:263–276.
14. Callicott JH, et al. (1999) Physiological characteristics of capacity constraints in working memory as revealed by functional MRI. Cereb Cortex 9:20–26.
15. Blokland GA, et al. (2011) Heritability of working memory brain activation. J Neurosci 31:10882–10890.
16. Fletcher JM, Marks AD, Hine DW, Coventry WL (2014) Heritability of preferred thinking styles and a genetic link to working memory capacity. Twin Res Hum Genet 17:526–534. 17. Hansell NK, et al. (2015) Genetic basis of a cognitive complexity metric. PLoS One 10:
e0123886.
18. Baetu I, Burns NR, Urry K, Barbante GG, Pitcher JB (2015) Commonly-occurring polymorphisms in the COMT, DRD1 and DRD2 genes influence different aspects of motor sequence learning in humans. Neurobiol Learn Mem 125:176–188. 19. Tsang J, et al. (2015) The relationship between dopamine receptor D1 and cognitive
performance. NPJ Schizophr 1:14002.
20. Gaiteri C, Ding Y, French B, Tseng GC, Sibille E (2014) Beyond modules and hubs: The potential of gene coexpression networks for investigating molecular mechanisms of complex brain disorders. Genes Brain Behav 13:13–24.
21. Pergola G, et al. (2017) DRD2 co-expression network and a related polygenic index predict imaging, behavioral and clinical phenotypes linked to schizophrenia. Transl Psychiatry 7:e1006.
22. Gamazon ER, et al.; GTEx Consortium (2015) A gene-based association method for mapping traits using reference transcriptome data. Nat Genet 47:1091–1098. 23. Pergola G, et al. (2016) Combined effect of genetic variants in the GluN2B coding
gene (GRIN2B) on prefrontal function during working memory performance. Psychol Med 46:1135–1150.
24. Colantuoni C, et al. (2011) Temporal dynamics and genetic control of transcription in the human prefrontal cortex. Nature 478:519–523.
25. Monda A, et al. (2017) Topological complex networks properties for gene community detection strategy: DRD2 case study. Emergent Complexity from Nonlinearity, in Physics, Engineering and the Life Sciences: Proceedings of the XXIII International Conference on Nonlinear Dynamics of Electronic Systems, eds Mantica G, Stoop R, Stramaglia S (Springer International Publishing AG, Cham, Switzerland), Vol 191, pp 199–208. 26. Trabzuni D, et al. (2011) Quality control parameters on a large dataset of regionally dissected
human control brains for whole genome expression studies. J Neurochem 119:275–282. 27. Fromer M, et al. (2016) Gene expression elucidates functional impact of polygenic risk
for schizophrenia. Nat Neurosci 19:1442–1453.
28. Ward LD, Kellis M (2012) HaploReg: A resource for exploring chromatin states, con-servation, and regulatory motif alterations within sets of genetically linked variants. Nucleic Acids Res 40:D930–D934.
29. Callicott C (1999) A magnetic field control system for a variable field NMR spec-trometer. Phys Med Biol 44:N193–N199.
30. Selvaggi P, et al. (2018) Genetic variation of a DRD2 co-expression network is asso-ciated with changes in prefrontal function after D2 receptors stimulation. Cereb Cortex, 10.1093/cercor/bhy022.
31. Cassidy CM, et al. (2016) Dynamic connectivity between brain networks supports working memory: Relationships to dopamine release and schizophrenia. J Neurosci 36:4377–4388. 32. Jaffe AE, et al. (2017) Developmental and genetic regulation of the human cortex
transcriptome in schizophrenia. bioRxiv:10.1101/124321.
33. Cholewa-Waclaw J, et al. (2016) The role of epigenetic mechanisms in the regulation of gene expression in the nervous system. J Neurosci 36:11427–11434.
34. Richiardi J, et al.; IMAGEN consortium (2015) BRAIN NETWORKS. Correlated gene expression supports synchronous activity in brain networks. Science 348:1241–1244. 35. Avery MC, Krichmar JL (2015) Improper activation of D1 and D2 receptors leads to
excess noise in prefrontal cortex. Front Comput Neurosci 9:31.
36. Ott T, Jacob SN, Nieder A (2014) Dopamine receptors differentially enhance rule coding in primate prefrontal cortex neurons. Neuron 84:1317–1328.
37. Zahrt J, Taylor JR, Mathew RG, Arnsten AF (1997) Supranormal stimulation of D1 dopamine receptors in the rodent prefrontal cortex impairs spatial working memory performance. J Neurosci 17:8528–8535.
38. Müller U, von Cramon DY, Pollmann S (1998) D1- versus D2-receptor modulation of visuospatial working memory in humans. J Neurosci 18:2720–2728.
39. Huang W, Li MD (2009) Differential allelic expression of dopamine D1 receptor gene (DRD1) is modulated by microRNA miR-504. Biol Psychiatry 65:702–705.
40. Kaalund SS, et al. (2014) Contrasting changes in DRD1 and DRD2 splice variant ex-pression in schizophrenia and affective disorders, and associations with SNPs in postmortem brain. Mol Psychiatry 19:1258–1266.
41. Gibbs SE, D’Esposito M (2006) A functional magnetic resonance imaging study of the effects of pergolide, a dopamine receptor agonist, on component processes of working memory. Neuroscience 139:359–371.
42. Girgis RR, et al. (2016) A proof-of-concept, randomized controlled trial of DAR-0100A, a dopamine-1 receptor agonist, for cognitive enhancement in schizophrenia. J Psychopharmacol 30:428–435.
43. McClure MM, et al. (2010) Pergolide treatment of cognitive deficits associated with schizotypal personality disorder: Continued evidence of the importance of the dopa-mine system in the schizophrenia spectrum. Neuropsychopharmacology 35:1356–1362. 44. Brandt CL, et al. (2014) Working memory networks and activation patterns in schizophrenia
and bipolar disorder: Comparison with healthy controls. Br J Psychiatry 204:290–298. 45. Forbes NF, Carrick LA, McIntosh AM, Lawrie SM (2009) Working memory in
schizo-phrenia: A meta-analysis. Psychol Med 39:889–905.
46. Kirova AM, Bays RB, Lagalwar S (2015) Working memory and executive function decline across normal aging, mild cognitive impairment, and Alzheimer’s disease. BioMed Res Int 2015:748212.
47. Schroeder A, et al. (2006) The RIN: An RNA integrity number for assigning integrity values to RNA measurements. BMC Mol Biol 7:3.
48. Botía JA, et al.; United Kingdom Brain Expression Consortium (2017) An additional k-means clustering step improves the biological features of WGCNA gene co-expression networks. BMC Syst Biol 11:47.
49. Monaco A, et al. (2018) A complex network approach reveals a pivotal substructure of genes linked to schizophrenia. PLoS One 13:e0190110.
50. Barrat A, Barthélemy M, Pastor-Satorras R, Vespignani A (2004) The architecture of complex weighted networks. Proc Natl Acad Sci USA 101:3747–3752.
51. Shannon CE (1948) A mathematical theory of communication. Bell Syst Tech J 27:379–423. 52. Freytag S, Gagnon-Bartsch J, Speed TP, Bahlo M (2015) Systematic noise degrades
gene co-expression signals but can be corrected. BMC Bioinformatics 16:309. 53. Johnson MR, et al. (2016) Systems genetics identifies a convergent gene network for
cognition and neurodevelopmental disease. Nat Neurosci 19:223–232.
54. Rampino A, et al. (2017) Association of functional genetic variation in PP2A with prefrontal working memory processing. Behav Brain Res 316:125–130.
55. Friston KJ, Williams S, Howard R, Frackowiak RS, Turner R (1996) Movement-related effects in fMRI time-series. Magn Reson Med 35:346–355.