2017
Publication Year
2020-08-28T09:23:11Z
Acceptance in OA@INAF
ALMA and GMRT Constraints on the Off-axis Gamma-Ray Burst 170817A from the
Binary Neutron Star Merger GW170817
Title
Kim, S.; Schulze, S.; Resmi, L.; González-López, J.; Higgins, A. B.; et al.
Authors
10.3847/2041-8213/aa970b
DOI
http://hdl.handle.net/20.500.12386/26915
Handle
THE ASTROPHYSICAL JOURNAL LETTERS
Journal
850
ALMA and GMRT Constraints on the Off-axis Gamma-Ray Burst 170817A from the
Binary Neutron Star Merger GW170817
S. Kim1,2 , S. Schulze3, L. Resmi4, J. González-López1 , A. B. Higgins5, C. H. Ishwara-Chandra6, F. E. Bauer1,7,8 , I. de Gregorio-Monsalvo9,10, M. De Pasquale11, A. de Ugarte Postigo12, D. A. Kann12, S. Martín9,10, S. R. Oates13, R. L. C. Starling5, N. R. Tanvir5 , J. Buchner1,7, S. Campana14, Z. Cano12, S. Covino14 , A. S. Fruchter15, J. P. U. Fynbo16 , D. H. Hartmann17, J. Hjorth18 , P. Jakobsson19, A. J. Levan13, D. Malesani18 , M. J. Michałowski20, B. Milvang-Jensen18 ,
K. Misra21, P. T. O’Brien5, R. Sánchez-Ramírez22 , C. C. Thöne12, D. J. Watson16 , and K. Wiersema13 1
Instituto de Astrofísica and Centro de Astroingeniería, Facultad de Física, Pontificia Universidad Católica de Chile, Casilla 306, Santiago 22, Chile
2
Max-Planck-Institut für Astronomie Königstuhl 17 D-69117 Heidelberg, Germany
3
Department of Particle Physics and Astrophysics, Weizmann Institute of Science, Rehovot 761000, Israel;[email protected]
4
Indian Institute of Space Science & Technology, Trivandrum 695547, India;[email protected]
5
Department of Physics and Astronomy, University of Leicester, University Road, Leicester LE1 7RH, UK
6
National Center for Radio Astrophysics, Pune 411007, India
7
Millennium Institute of Astrophysics(MAS), Nuncio Monseñor Sótero Sanz 100, Providencia, Santiago, Chile
8
Space Science Institute, 4750 Walnut Street, Suite 205, Boulder, CO 80301, USA
9
European Southern Observatory, Alonso de Córdova 3107, Vitacura, Santiago 763-0355, Chile
10
Joint ALMA Observatory, Alonso de Córdova 3107, Vitacura, Santiago 763-0355, Chile
11
Department of Astronomy and Space Sciences, Istanbul University, 34119 Beyazıt, Istanbul, Turkey
12
Instituto de Astrofísica de Andalucía(IAA-CSIC), Glorieta de la Astronomía, s/n, E-18008, Granada, Spain
13
Department of Physics, University of Warwick, Coventry CV4 7AL, UK
14INAF—Osservatorio astronomico di Brera, Via E. Bianchi 46, I-23807, Merate (LC), Italy 15
Space Telescope Science Institute, 3700 San Martin Drive, Baltimore, MD 21218, USA
16
Niels Bohr Institute, University of Copenhagen, Juliane Maries Vej 30, DK-2100 Copenhagen Ø, Denmark
17
Department of Physics and Astronomy, Clemson University, Clemson, SC 29634-0978, USA
18
Dark Cosmology Centre, Niels Bohr Institute, University of Copenhagen, Juliane Maries Vej 30, DK-2100 Copenhagen Ø, Denmark
19
Centre for Astrophysics and Cosmology, Science Institute, University of Iceland, Dunhagi 5, 107 Reykjavík, Iceland
20
Astronomical Observatory Institute, Faculty of Physics, Adam Mickiewicz University, ul.Słoneczna 36, 60-286 Poznań, Poland
21
Aryabhatta Research Institute of observational sciencES(ARIES), Manora Peak, Nainital 263 001, India
22
INAF, Istituto Astrofisica e Planetologia Spaziali, Via Fosso del Cavaliere 100, I-00133 Roma, Italy Received 2017 October 13; revised 2017 October 29; accepted 2017 October 30; published 2017 November 21
Abstract
Binary neutron-star mergers (BNSMs) are among the most readily detectable gravitational-wave (GW) sources with the Laser Interferometer Gravitational-wave Observatory (LIGO). They are also thought to produce short γ-ray bursts (SGRBs) and kilonovae that are powered by r-process nuclei. Detecting these phenomena simultaneously would provide an unprecedented view of the physics during and after the merger of two compact objects. Such a Rosetta Stone event was detected by LIGO/Virgo on 2017 August 17 at a distance of ∼44Mpc. We monitored the position of the BNSM with Atacama Large Millimeter/submillimeter Array (ALMA) at 338.5 GHz and the Giant Metrewave Radio Telescope(GMRT) at 1.4 GHz, from 1.4 to 44 days after the merger. Our observations rule out any afterglow more luminous than3 ´1026erg s-1Hz-1in these bands, probing>2–4
dex fainter than previous SGRB limits. We match these limits, in conjunction with public data announcing the appearance of X-ray and radio emission in the weeks after the GW event, to templates of off-axis afterglows. Our broadband modeling suggests that GW170817 was accompanied by an SGRB and that theγ-ray burst (GRB) jet, powered byEAG,iso~1050 erg, had a half-opening angle of ~20 , and was misaligned by ~ 41 from our line of sight. The data are also consistent with a more collimated jet:EAG,iso~1051erg, q1 2,jet~ 5 ,qobs~17. This is
the most conclusive detection of an off-axis GRB afterglow and thefirst associated with a BNSM-GW event to date. We use the viewing angle estimates to infer the initial bulk Lorentz factor and true energy release of the burst. Key words: gamma-ray burst: individual(GRB 170817A) – gravitational waves
1. Introduction
The existence of gravitational waves (GWs) was predicted in 1916 (Einstein 1916, 1918), but it took almost a century to directly observe them(Abbott et al.2016). A type of GW signal readily detectable with the Laser Interferometer Gravitational-wave Observatory (LIGO) is linked to the coalescence of two neutron stars (Abadie et al. 2010). This class of object is also thought to be the progenitor of short γ-ray bursts (SGRBs; duration 2 s; Eichler et al.1989; Nakar2007; Berger2014). In addition, the temperatures and densities in the debris of the merger
are thought to be high enough to also produce radioactive nuclei through rapid neutron capture. Their decays could give rise to faint supernova-like transients, called kilonovae (KNe; e.g., Li & Paczyński 1998; Rosswog 2005; Kasen et al. 2013; for a review see also Metzger2017). Observational evidence for a KN was found in the near-infrared (near-IR) photometry of SGRB 130603B(Tanvir et al.2013) and possibly in optical photometry of GRBs 050709 and 060614(Jin et al. 2015,2016). However, without a spectrum, the conjecture that SGRBs are accompanied by KNe, and therefore that SGRBs are connected with binary neutron-star mergers(BNSMs), is not free of ambiguity. © 2017. The American Astronomical Society. All rights reserved.
On 2017 August 17 at 12:41:04 UTC, the joint LIGO and Virgo observing run detected a BNSM at40-+14
8 Mpc within an
area of 28deg2projected on the sky(Abbott et al.2017b). The precise distance and localization gave the follow-up with optical wide-field imagers a flying start (for a comprehensive review see Abbott et al.2017a). Coulter et al. (2017a) targeted galaxies at this distance and detected a new object, SSS17a (IAU identification: AT2017gfo; Coulter et al. 2017b), at
aJ2000=13 09 48. 09,h m s dJ2000= - ¢ 23 22 53. 3; 10. 3 from NGC 4993 at 43.9Mpc ( =z 0.00984; Levan et al.2017; for a detailed discussion see also Hjorth et al. 2017).23 This discovery was confirmed by several teams including Allam et al.(2017), Melandri et al. (2017), Tanvir & Levan (2017a), and Yang et al. (2017). The transient rapidly faded in the optical, but showed a much slower evolution in the near-IR (Tanvir et al. 2017b). Spectra of AT2017gfo revealed very broad absorption features, due to relativistic expansion velocities (Pian et al. 2017; Smartt et al. 2017; Tanvir et al. 2017b), similar to those expected for KNe (Kasen et al. 2013; Tanaka et al.2014). Such features are unlike any known for supernova spectra and strongly argued for a
connection between AT2017gfo and GW170817 (Siebert
et al.2017).
The Gamma-ray Burst Monitor (GBM) detector aboard the γ-ray satellite Fermi (Blackburn et al. 2017; Goldstein et al. 2017a, 2017b; von Kienlin et al. 2017) as well as the INTErnational Gamma-Ray Astrophysics Laboratory (INTEGRAL; Savchenko et al. 2017a, 2017b) detected a faint 2-s duration GRB (hereafter GRB 170817A), 1.7s after GW170817 (Abbott et al. 2017c). Although the chance coincidence of finding both transients quasi-contemporaneous and in the same region of the sky is very small, the credible region of theγ-ray localization had a size of ∼1100deg2(90% confidence; Blackburn et al. 2017). To firmly establish the connection between GRB 170817A and GW170817 by detecting the afterglow of the GRB in the X-ray and radio bands, numerous groups carried out large follow-up campaigns to very deep limits, but without success (e.g., Alexander et al.2017a; Bannister et al.2017; Cenko et al.2017; Corsi & Kasliwal2017b; De et al.2017; Deller et al.2017; Evans et al. 2017a; Kaplan et al. 2017; Margutti et al. 2017; Resmi et al.2017; Sugita et al.2017). It was not until nine days after GW170817 that a brightening X-ray source was detected at the position of AT2017gfo(Troja et al.2017a). Subsequent X-ray observations confirmed the brightening (Fong et al. 2017; Haggard et al. 2017a). About a week later, Corsi & Kasliwal (2017b) and Mooley et al. (2017) detected an emerging radio source at 3 and 6GHz as well. While these observations might support the SGRB connection, such a behavior is highly atypical for GRB afterglows(e.g., Piran2004).
In this Letter, we examine the afterglow properties of AT2017gfo. We present sub-mm and radio observations obtained with the Atacama Large Millimeter/submillimeter Array (ALMA) and the Giant Metrewave Radio Telescope (GMRT) between 1.4 and 44.1 days after the GW detection. We augment our data set with public X-ray, optical, and radio data and confront GRB afterglow models with observations.
All uncertainties reported in this Letter are given at 1s confidence. Non-detections are reported at s3 confidence, unless stated otherwise.
2. Observations and Data Reduction
We observed the field of AT2017gfo as a part of the observing program 2016.1.00862.T(P.I.: Kim) with ALMA in the Atacama desert(Chile; Wootten & Thompson2009) and as part of the Director’s Discretionary Time (DDT) Proposal DDTB285 with the GMRT, Pune(India; Swarup et al. 1991; P.I.: Resmi).
2.1. ALMA Observations
Our initial ALMA campaign started on 2017 August 18 at 22:50:40 UTC(1.4 days after GW170817) and lasted for eight days(Schulze et al.2017). In addition, we secured a final epoch ∼44 days after GW170817. In total, we obtained six epochs at 338.5GHz (Table1). The integration time of each observation was set to reach a nominal rms of∼40μJy/beam. The initial ALMA observations were performed in the C40-7 con figura-tion, with afield of view of 18. 34 in diameter and an average synthesized beam of » 0. 13´ 0. 07. The observation at 44 days after GW170817 was performed in the most extended ALMA configuration, C40-8/9, yielding a synthesized beam of 0. 026´ 0. 016.
The ALMA data were reduced with scripts provided by ALMA and with the software package COMMONASTRONOMY SOFTWARE APPLICATIONS (CASA) version 4.7.2 (McMullin et al. 2007).24 For each epoch, we created images using TCLEAN, with a pixel size of 0. 01/px. We interactively selected cleaning regions around detected sources (none corresponding to the AT2017gfo counterpart). The cleaning process was repeated until no clear emission was left. The rms was measured in a10 -width box around the central position in the images without primary beam correction.
No significant signal is detected at the position of AT2017gfo. Table1summarizes the s3 detection limits. The galaxy nucleus is well detected and marginally resolved in our data(a d, (J2000)=
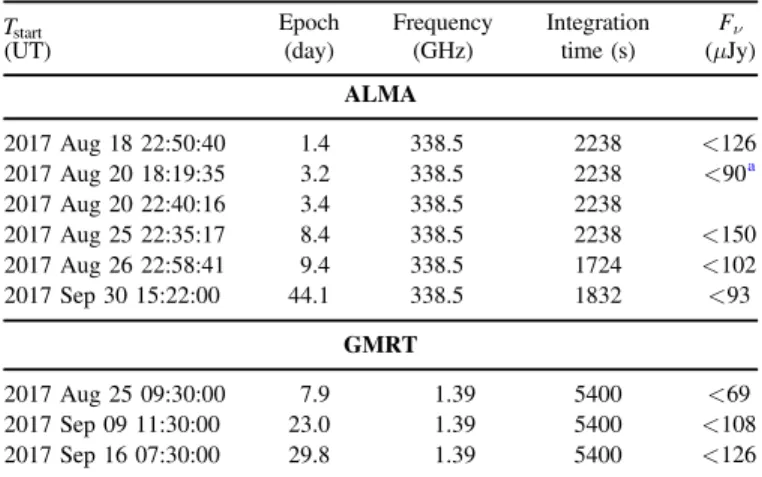
Table 1
Log of Sub-mm/mm and Radio Observations of AT2017gfo
Tstart Epoch Frequency Integration Fν
(UT) (day) (GHz) time(s) (μJy)
ALMA 2017 Aug 18 22:50:40 1.4 338.5 2238 <126 2017 Aug 20 18:19:35 3.2 338.5 2238 <90a 2017 Aug 20 22:40:16 3.4 338.5 2238 2017 Aug 25 22:35:17 8.4 338.5 2238 <150 2017 Aug 26 22:58:41 9.4 338.5 1724 <102 2017 Sep 30 15:22:00 44.1 338.5 1832 <93 GMRT 2017 Aug 25 09:30:00 7.9 1.39 5400 <69 2017 Sep 09 11:30:00 23.0 1.39 5400 <108 2017 Sep 16 07:30:00 29.8 1.39 5400 <126
Note.The epoch is with respect to the time of GW170817.
a
The rms was measured after combining both epochs from 2017 August 20.
23
The luminosity distance was derived for a flat ΛCDM cosmology with W =m 0.315,W =L 0.685,H0=67.3 km s-1Mpc-1 (Planck Collaboration
XVI2014). We use this cosmology throughout the paper. 24https://casa.nrao.edu
- ¢
13 09 47. 69,h m s 23 23 02. 37). We measure 1.07±0.21mJy at 338.5GHz. In addition, we detect a marginally resolved sub-mm galaxy with F338.5 GHz=1.150.21 mJy at a d, (J2000)=
- ¢
13 09 48. 39,h m s 23 22 48. 29. The quasars J1337−1257 and J1427−4206 were used for band and flux calibration, and J1256 −2547, J1937−3958, and J1258−2219 for phase calibration.
2.2. GMRT Observations
The GMRT is one of the most sensitive low-frequency radio telescopes in operation currently. It operates at low radio frequencies from 150MHz to 1.4GHz (Swarup et al. 1991). We secured three epochs in the L band, centered at 1.39GHz, between 2017 August 25 and 2017 September 16(i.e., between
7.9 and 29.8 days since GW170817; Table 1; Resmi
et al. 2017). The observing time was ∼1.5hr for each observation. The first epoch was performed with the new 200 MHz correlator that divides the bandpass into 2048 channels, of which ~70% were usable due to radio frequency interference. The second and the third epoch were performed with the 32 MHz correlator. The synthesized beam sizes were typically 4 ´ 2 . The quasar 3C286 was used as flux and bandpass calibrator, and J1248−199 was used for phase and additional bandpass calibration. Data reduction was carried out
with the NRAO ASTRONOMICAL IMAGE PROCESSING
SOFT-WARE25(AIPS; Wells1985) using standard procedures. While the marginally resolved nucleus of the host galaxy of
AT2017gfo, NGC 4993, was detected with ∼570 μJy in
1.39GHz, no significant signal is detected at the position of AT2017gfo itself. Table1summarizes the s3 detection limits, where the rms level is estimated from source-free regions using the task TVSTAT.
2.3. Other Observations
To augment our data set, we incorporated radio measure-ments from Corsi & Kasliwal (2017a, 2017b, 2017c), Corsi et al. (2017a, 2017b), Hallinan et al. (2017a), Kaplan et al. (2017), Mooley & Hallinan (2017), Mooley et al. (2017; see also Hallinan et al. 2017b), obtained with the Australia Telescope Compact Array (ATCA) and the Very Large Array (VLA). We used the VLA exposure time calculator26to convert the relative measurements of Corsi et al.(2017b) and Mooley et al.(2017) into radio flux densities, adopting rms values 50% higher than nominal to mitigate possible losses due to antennae problems and adverse observing conditions. We also included the X-ray constraints of Evans et al. (2017b), Haggard et al. (2017a), and Troja et al. (2017a) from the Swift satellite and Chandra X-ray Observatory, as reported in Abbott et al. (2017a), as well as optical photometry obtained with the
HubbleSpaceTelescope and ESO’s 8.2 m Very Large
Telescope(VLT) by Tanvir et al. (2017b). 3. Results and Discussion
3.1. GRB 170817A in the Context of Other SGRBs The interaction of the GRB blastwave with the circumburst medium produces an afterglow from X-ray to radio frequen-cies. The peak of the synchrotron afterglow spectrum is, however, expected to be in the sub-mm/mm band and it
rapidly crosses the band toward lower frequencies(n µm t-3 2; Sari et al. 1998). Our initial ALMA 3σ limit of F338.5 GHz<
126μJy at 1.4days after GW170817 corresponds to a luminosity of 3´1026erg s-1Hz-1 at the redshift of
AT2017gfo. Comparing this estimate for the peak flux of GRB 170817A to estimates of other GRBs from de Ugarte Postigo et al. (2012; see Figure 1, top panel), our sub-mm afterglow limits are ∼3–4 orders of magnitude fainter than those associated with any long-duration GRBs (LGRBs) or SGRBs.27
However, the maximum frequency is also correlated with the energy within the jet and the energy release in γ-rays, e.g.,
n µ Em 1 2for a constant density circumburst medium(Piran2004). Abbott et al. (2017c) reported an exceptionally low isotropic-equivalent energy of only Eg,iso=(3.08 0.72)´1046 erg.
Hence, it is conceivable that the peak of the afterglow spectrum was already in the radio band during ourfirst ALMA observation. To get an additional estimate of the peak luminosity, we use results in Corsi et al.(2017a). Their measurement ofF6 GHz~28.5m Jy Figure 1.Peakflux densities of GRB afterglows derived from mm/sub-mm (top) and radio (bottom) observations. Filled circles and open triangles denote detections and 3σ limits, respectively. SGRBs are shown in red and LGRBs in black. Solid and dotted blue curves indicate equal afterglow luminosities. The non-detection in the sub-mm corresponds to a luminosity limit of
´ -
-3 1026erg s 1Hz 1. The faint radio counterpart detected by Corsi et al.
(2017b) suggests a peak luminosity of ~ ´7 1026erg s-1Hz-1.
25http://www.aips.nrao.edu 26
https://obs.vla.nrao.edu/ect/
27
We consider all of the bursts to be SGRBs if the burst duration is <2 s (observer frame) or if the initial pulse complex lasted less than 2s (for a critical reflection on the burst duration criterion, see Bromberg et al. 2013; for distinguishing between short and long GRBs, see Zhang et al.2009and Kann et al. 2011). In total, 127 Swift GRBs, detected until the end of 2017
September, fulfilled this criterion. Among those 35 have reliable redshifts: 050509B, 050709, 050724, 051221A, 060502B, 060614, 060801, 061006, 061210, 061217, 070429B, 070714B, 070724, 071227, 080123, 080905A, 090510, 100117A, 100206A, 100625A, 100816A, 101219A, 111117A, 130603B, 131004A, 140622A, 140903A, 141212A, 150120A, 150423A, 150101B, 160410A, 160624A, 160821B, and 170428A.
at 28.5 days after GW170817 translates to a luminosity of ~ ´7 1025erg s-1Hz-1. Compared to radio measurements of
LGRBs and SGRBs in Fong et al. (2015) and Chandra & Frail (2012), respectively (Figure1, bottom panel), the radio afterglow is 2 orders of magnitude fainter than those of LGRBs and SGRBs.
While sub-mm and radio observations are direct tracers of the peak of the afterglow spectrum, only ~7% of all Swift GRBs were bright enough to attempt sub-mm and radio observations. This observational bias is likely to skew the known population toward the bright end of any luminosity function. On the other hand, almost all of the Swift GRBs are detected at X-rays. The mapping between X-ray brightness and the peak of the afterglow spectrum is more complex. It depends on the location of the cooling break, which is usually between the optical and the X-rays, and the density profile of the circumburst medium. Nonetheless, de Ugarte Postigo et al. (2012) showed that X-ray brightness is a useful diagnostic for comparing afterglow luminosities.
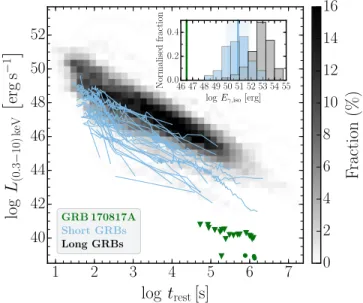
To generate an X-ray diagnostic plot, we retrieved the X-ray light curves of 402 LGRBs and 31 SGRBs with detected X-ray afterglows(at least at two epochs) and known redshift from the Swift Burst Analyzer (Evans et al. 2010). Identical to Schulze et al.(2014), we computed the rest-frame light curves and resampled the light curves of the LGRB sample on a grid (gray shaded region in Figure 2). The individual light curves of the SGRB sample are shown in light blue. Already the Swift non-detections presented in Evans et al. (2017b; downward pointing triangles in Figure 2) revealed that the afterglow is >1.5 dex fainter than the faintest SGRB with detected afterglow(downward pointing triangles in Figure 2). The deep Chandra observation by Troja et al. (2017b) at 2.3days after GW170817 excluded any afterglow brighter than >1039erg s-1, i.e., a factor of 10 below the Swift
upper limits.
To put these limits in context, Evans et al. (2017a) placed 10,000 fake GRBs, generated from the flux-limited SGRB sample in D’Avanzo et al. (2014), at the distance of GW170817. These authors estimated that the Swift X-ray telescope would have detected ~65% of all simulations. The deeper Chandra observations probed a larger portion of the parameter space. However, Rowlinson et al. (2010) showed that a number of SGRBs have extremely rapidly fading X-ray afterglows, which would have evaded detection at the time of the Swift and Chandra observations.
The new quality of the X-ray emission of AT2017gfo is not only its faintness, but actually its emergence more than a week after GW170817. This behavior is inconsistent with known X-ray afterglows. When the X-ray afterglow was detected with Chandra(Haggard et al.2017b; Margutti et al.2017; Troja et al. 2017b), the luminosity of L(0.3 10 keV- ) ~8 ´ 1038 erg s-1
was still 2.6 dex fainter than that of any GRB with detected X-ray afterglow.
This faintness of the afterglow is also reflected in the very low energy release at γ-rays, Eg,iso. The observed Eg,iso
distribution of SGRBs and LGRBs is shown in the inset of Figure2. The vertical blue line and the shaded region display the median [log(Eiso erg)=50.880.18] and the sample dispersion s[ {log(Eiso erg)}=0.99-+0.12]
0.14
of the SGRB sam-ple, computed with (PY)MULTINEST (Feroz et al. 2013; Buchner et al. 2014). With a prompt energy release of
´
3.08 1046 erg (green vertical line the inset of Figure 2),
GRB 170817A was ∼1.5dex less energetic than the least energetic SGRB known so far and its deviation from the distribution median is~4.4 .s
In conclusion, observations of the afterglow revealed an exceptionally under-luminous afterglow at all wavelengths at the position of AT2017gfo. This extremeness is also reflected in theγ-ray properties.
3.2. Modeling the Broadband Afterglow
The previous considerations placed the GRB in the context of LGRBs and SGRBs detected by Swift. The discussion neglected the peculiar evolution of the afterglow: non-detection of the afterglow during thefirst week and its emergence at later epochs. These properties are highly atypical for GRBs, assuming that the GRB jet axis is aligned with our line of sight. In the following, we model the observed evolution from X-rays to radio with templates from two-dimensional relati-vistic hydrodynamical jet simulations usingBOXFIT version 2 with the methods described in van Eerten et al. (2012). The templates are generated from a wide range of physical parameters. Here, we use a nine-parameter model:
q q x
=
n ( )
F L EAG,iso, ,n 1 2,jet, obs, ,p e, B, N,z
where EAG,iso is the isotropic-equivalent energy of the
blastwave (afterglow),28 n is the circumburst density at a distance of 1017cm, p is the power-law index of the electron energy distribution, q1 2,jet is the jet half-opening angle, qobsis
the observer/viewing angle,e andB are the fractions of the internal energy in the shock-generated magnetic field and electrons, respectively, and xN is the fraction of electrons that are accelerated and z is the redshift.
Figure 2.X-ray light curves of GRB afterglows. The parameter space occupied by 402 LGRBs, detected between 2004 December and 2017 September, is indicated by the density plot. Light curves of 31 SGRBs with detected X-ray afterglows are shown in light blue. GRB 170817A lies 2.6 orders of magnitude below the other SGRBs. The inset displays the distribution of energy release at γ-ray energies (SGRBs: blue; LGRBs: gray). The blue vertical line and shaded region indicate the median value and dispersion of the SGRB distribution, respectively.
28
In the discussed models, Eisoalways corresponds to the isotropic-equivalent
energy measured by an on-axis observer.
Wefix the fractions ofeand xNat 0.1 and 1, respectively, and p to 2.43 and the redshift to 0.009854. The other parameters are varied within the following ranges: q1 2,jet= -5 45 , E AG,iso=
1047–1053erg, =10-–10 ,- n=10
-B 5 2 4–10−1cm−3 and
qobs= -0 45. The afterglow was modeled in a homogeneous ISM environment and we apply this model to eight representative frequencies: 1.4, 3, 6, 21, 338.5GHz as well as the optical filters
F606W and F475W and X-rays at 3keV.
A critical aspect of the off-axis afterglow modeling is the resolution in azimuthal direction, in particular for models with large qobsto q1 2,jet ratios. We chose a numerical resolution of
20 and 30, for q1 2,jet> 9 and q1 2,jet< 9 , respectively.
Comparisons to simulations with a numerical resolution in azimuthal direction of 70 show that the lower-resolution templates accurately capture the temporal evolution of the afterglow, and they are also able to recover the absolute flux
scale at maximum to within 20%. The maximum flux of
models with very narrow jet are recovered less accurately in off-axis afterglow models. As we show below, these models are not adequate to describe the observed afterglow evolution independent of the issue of the absolute flux scale. The numerical resolution in azimuthal direction was set to unity if the viewing angle is negligible, as suggested by the BOXFIT manual.
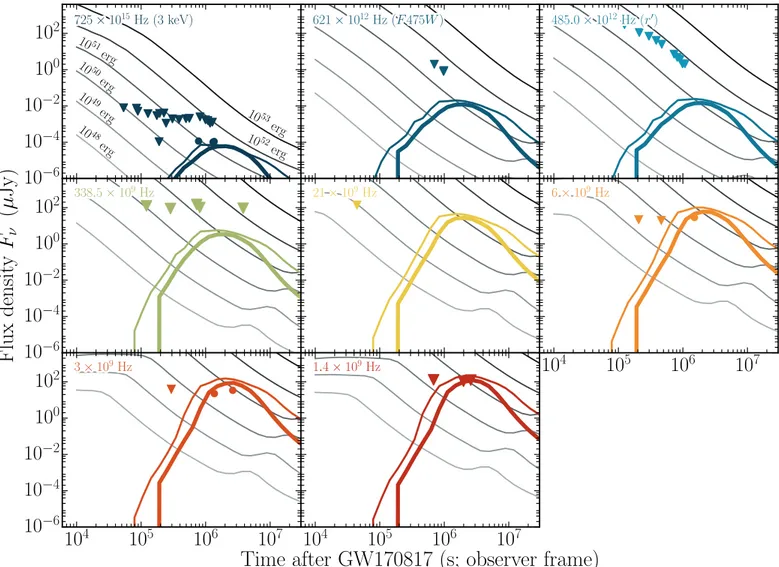
The gray curves in Figure 3 display a set of strict on-axis afterglow models (i.e., q = 0obs ) with a half-opening angle of
= n = -
-5 , B 0.01, 10 2cm 3, and for EAG,iso between 1048
and 1053erg. Common to on-axis afterglow models
(qobs<q1 2,jet) is the strict monotonic decline in X-rays and
the optical, whereas the radio can exhibit a plateau or an initial rise. This evolution is in stark contrast to observations of AT2017gfo. The best-matching templates (colored curves in Figure 3) strongly argue for a GRB seen off-axis (i.e.,
qobs>q1 2,jet; possible off-axis LGRB candidates were dis-cussed in Fynbo et al. 2004; Guidorzi et al. 2009; Krühler et al.2009).
Model 1 (which we call the wide-jet model, thin curves in Figure 3) represents an afterglow with an energy reservoir of ~10 erg50 , an energy fraction stored in magnetic fields of
~10
-B 2, and a moderately collimated outflow with a half-opening angle of q1 2,jet~20, traversing a circumburst medium with a density of 10-2cm-3. The jet axis and the
line of sight are misaligned by 41°. Model 2 (which we call the narrow-jet model, thick curves in Figure 3) represents a more collimated jet with q1 2,jet~ 5 ,EAG,iso~1051erg and
~2 ´10
-B 3, traversing a more tenuous circumburst medium
~ ´ -
-(n 5 10 4cm 3). In this scenario, the line of sight and the GRB jet axis are misaligned by 17°.
The inferred afterglow properties are in both cases very close to the average values of SGRBs in Fong et al. (2015), corroborating that this GRB is not different from the population of known SGRBs. The properties of the wide-jet model are consistent with Alexander et al.(2017b), Granot et al. (2017), Margutti et al.(2017), and Troja et al. (2017b). However, the two distinct models, discussed in this Letter, show that there is significant degeneracy between the afterglow parameters (for a more detailed study of the afterglow parameter space, see Granot et al. 2017). More detections are required to better constrain the parameter space. We note that the derived viewing angles for both models are consistent with the conservative limit of <56 from the LIGO signal. Moreover,
the narrow-jet template (Model 2) is consistent with the even stricter LIGO limit of <28(Abbott et al.2017b).
With the best-match templates in hand, we quantify the contamination of the kilonova by the afterglow. The upper panels in Figure 3 display the light curve in F475W
(6.2´1012 Hz) and ¢r/F606W (4.9´1012 Hz) by Tanvir
et al. (2017b). The contamination by the afterglow in the optical is negligible(<1%) during the week after GW170817 for both models. Hence the inferred KN properties in Tanvir et al.(2017b) do not require any afterglow correction.
3.3. Inferring Jet Parameters fromγ-Ray and Afterglow Emission
The observed energy release of a GRB,Eg,iso,off, measured
by an observer at a viewing angle qobs, depends on qobs,q1 2,jet,
the jet geometry, and the initial bulk Lorentz factor of the jet, G0. Similarly, the observed Epeak,off is a function of the same
quantities. The simplest jet model assumes a uniform jet with a negligible surface and predicts that the ratios betweenEg,iso,off
and on-axis Eg,iso, as well as Epeak,off and on-axis Epeak, are
simple powers of the Doppler factor of the jet (Abbott et al. 2017c; Troja et al. 2017b). However, results already start to change considerably if the finite size of the jet is taken into account(Yamazaki et al.2003a,2003b).
In the following, we assume a top-hat jet, similar to Troja et al. (2017b) and Abbott et al. (2017c), but we take into account thefinite size of the jet. Donaghy (2006) and Graziani et al. (2005) provided analytical expressions for Eg,iso,off and
Epeak,offfor such a geometry that also match well the numerical
calculations in Yamazaki et al.(2003a,2003b). In this model,
g
E ,iso,off and Epeak,off are given by
b b q b q q q q = G - - -= á ñ á = ñ g g [ ( ) ( )] ( ) ( ) E E f f E D D E
2 cos cos cos ,
0 ,
,iso,off
,iso
0
4 obs 1 2,jet obs
peak,off
obs
obs
peak
whereβ the velocity normalized to the speed of light, Γ is the Lorentz factor, the function f(y) is defined as
q q q q = G G - + G + + G -( ) ( ) ( ) ( ) f y y y y
2 1 3 sin 2 cos sin
sin , 0 2 0 2 3 0 2 2
obs obs 2 obs 2
02 2 obs 3 2
and the average Doppler shift is given by
b q b q q b q b q q á ñ = G - - -- - -- ( ) ( ) ( ) ( ) D f f g g
cos cos cos
cos cos cos ,
0
1 obs 1 2,jet obs
obs 1 2,jet obs
with q q = G + + G -( ) ( ) g y y y 2 2 cos sin . 2 obs 2 2 2 obs1 2
The equations for Eg,iso,off and Epeak,off depend on the
unknown Eg,iso,Epeak and the initial bulk Lorentz factor G0.
Considering the complexity of the expressions, we perform a parameter study. We can limit the possible parameter space by using results from other SGRBs and our afterglow modeling. Cenko et al.(2011) reported that the ratio between Eg,iso and
EAG,isovaries between 0.05 and 40(mean value being ∼4). An
g
E ,iso-EAG,isoratio of a few has also been observed for SGRBs
suggests that EAG,iso is between 1050erg and 1051erg,
corresponding to Eg,iso=5´1048-40´1051 erg. The
Epeak distribution of our SGRB comparison sample extends
from∼40 to ∼8400keV (mean peak energy being ∼490 keV). Goldstein et al. (2017a) reported a peak energy of 185±62keV for the main emission of GRB 170817A. Hence, we vary Epeak between 123keV and 8400keV.
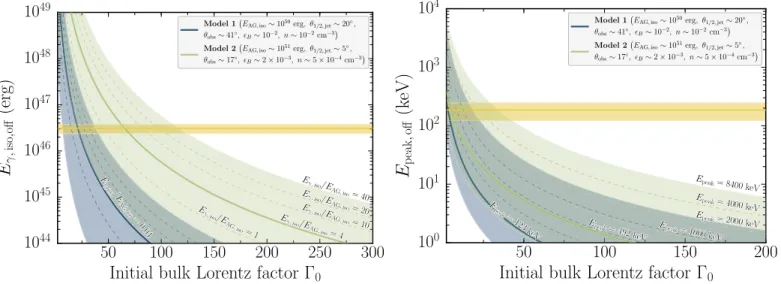
In the left and right panels of Figure 4, we display the g
E ,iso,off and Epeak,off as a function of G0. The expected
parameter spaces for the two afterglow models are shown in blue(wide-jet) and red (narrow-jet). Overlaid in yellow are the observed Eg,iso,off Epeak,iso,off values reported by Goldstein
et al. (2017a). The overlapping regions show the allowed parameter space for the GRB, if seen on-axis, for each afterglow model.
The observed span in theEg,iso and EAG,isoallows an initial
bulk Lorentz factor between 6 and 40, and 20 and 125 for the wide-jet(Model 1) and narrow-jet (Model 2), respectively (left panel in Figure4). However, the highest Lorentz factor would always require Eg,iso EAG,iso10. While such values are not atypical, they are at the upper end of the observed distribution
in Fong et al. (2015). The observed distribution of peak energies of short GRBs narrows the possible parameter space further: G <0 15 and G <0 43 for Model 1 and Model 2,
respectively(right panel in Figure 4), while the required peak energies need to exceed at least several hundred keV. The Lorentz factors are similar to the values in Zou et al.(2017), who assumed a top-jet with negligible surface and used the
Epeak-Eg,iso (derived from SGRBs) and G0–Eg,iso (derived from
LGRBs) correlations.
To understand these results, we reflect upon the assumptions of this calculation. This parameter study of the jet parameters depends upon the jet half-opening angle, the viewing angle, and the jet geometry. The model in Donaghy (2006) and Graziani et al. (2005) assumes that the γ-ray emission is produced via internal shocks in the GRB jet. According to Graziani et al. (2005), systematic uncertainties may exist between the Epeak,offcalculated by the above expression and the
observed peak of the effective GRB spectrum. Therefore, it may not always be a very accurate representation of the observed Epeak. Furthermore, the parameter space is limited
to the observed Epeak distribution of short GRBs and the
Figure 3.Afterglow from radio to X-ray frequencies(detections: •; non-detections: ; our ALMA and GMRT measurements are displayed slightly larger.). The light curves are adequately modeled with two distinct templates: model 1—EAG,iso~1050erg, q1 2,jet~20 , qobs~41 , n~10-2cm-3, andB~10-2(thin curves); model 2—EAG,iso~1051erg, q1 2,jet~ 5 ,qobs~17 , n~5´10-4cm-3, andB~2´10-3(thick curves). The gray curves show the evolution of an on-axis afterglow with q1 2,jet= 5 ,qobs= 0 ,n=10-2cm-3, andB=10-2. The energy in the afterglow was varied between 1048and 1053erg, indicated by the grayscale color pattern. Combining the non-detections at early times and the detections at late-times rules out the entire parameter space of on-axis afterglow models. The rebrightening seen in some on-axis models at >10 s6 is due to the contribution of the GRB counter-jet. For a detailed discussion see Section3.2.
known ratios betweenEg,iso and EAG,iso, and the parameters of
GRB170817 as measured by Fermi.
Our broadband modeling is based on a small number of detections and we showed that there is substantial degeneracy in the model parameters. This degeneracy is also visible in the G0–Eg,iso,off and the G0–Epeak,off parameter spaces(Figure4). A
more sophisticated afterglow modeling and the inclusion of more afterglow observations can reduce the degeneracy. The conclusions of this analysis also depend significantly on the observed γ-ray properties of GRB 170817A. Goldstein et al. (2017b) reported an error of 33% on the peak energy. A substantially lower peak energy would allow higher G0
for lower peak energies (for an independent analysis of the Fermi-GBM data, see Zhang et al.2017).
3.4. Low-frequency Radio Emission from Merger Ejecta Non-relativistic shocks from the merger ejecta are thought to emit at radio frequencies (Nakar & Piran 2011). This model predicts that the emission peaks in the MHz regime and at the epoch of deceleration of the non-relativistic shock, which is expected to be on the order of months to years after the merger. To examine whether this mechanism could produce a bright transient months after GW170817, we use the observed properties of the kilonova and the afterglow. The expected brightness at optically thin GHz frequencies would be
b n = n -⎜ ⎟ ⎛ ⎝ ⎞⎠ ( ) ( ) ( ) f t 655mJyn R t t 10 B e GHz , 01.8 17 3 3.75 0.78 0.55
for an electron index of 2.1, where R(t) is the radius of the shock front (normalized to 1017cm), and b ( )t is the velocity
normalized to the speed of light c. This expression is derived from the peak synchrotron flux and the characteristic synchrotron frequency nm of the power-law electron distribu-tion, and is in agreement with expressions in Nakar & Piran (2011). The radius and the observed time t are related through R t( )=bct. The epoch of deceleration, where
the swept-up mass equals the ejected mass, is given by
b =
-( )
tdec 7 yr Mn 1 3 0 1 ej,0 , where b0 is the normalized initial
velocity.
Tanvir et al. (2017b) concluded that the merger ejected
~ ´
-
M
5 10 4 with a velocity of 0.1 . Along with ac
circumburst medium density,n =0.01 cm-3, we estimate the
brightness at 1.4GHz to be ~60 Jy for a decelerationm timescale of 55 years. A smaller ambient density will further reduce theflux and increase the tdec.
Considering the results of Smartt et al. (2017), where a higher ejected mass of 0.01M was estimated to be released
with a similar β, the deceleration time will be ∼70years, and the observed flux will remain the same as it is insensitive to
Mej. Therefore, the outlook, assuming this model is valid, is
bleak.
The merger remnant, if a magnetar, can inject additional energy into the shock(Metzger & Bower2014). This increased energy will also delay tdec. In this model, from the observed
b = 0.1 and best-fit ambient density n =0.01 cm
-0 3,
=
tdec 260Emag,52 years, where Emag,52 is the energy input
from the magnetar. The peakflux in 1.4GHz attdec~3 mJy for our parameters, which, as in the previous case, scales down as a t3power-law to the current epoch. Therefore, we do not expect any detectable emission at GMRT frequencies at present from the merger ejecta, consistent with our observations.
4. Summary
LIGO/Virgo detected a BNSM at a distance of ∼44Mpc on 2017 August 17. Rapid optical and near-IR follow-up observations detected a new transient, AT2017gfo, in the credible region of GW170817 with properties consistent with KN models. Gamma-ray satellites detected the short GRB 170817A quasi-contemporaneously with GW170817, but owing to the poor localization at γ-rays this did not exclude a chance alignment.
Figure 4.Isotropicγ-ray energy releaseEgiso,offand the Epeakof the prompt emission measured by an off-axis observer, as a function of G0. We use the model in
Donaghy(2006) to predict the allowed loci of the parameter spaces for GRB 170817A. The loci depend on the jet geometry and the viewing angle that we obtained
from the broadband modeling in Section3.2. The known distributions forEg,iso EAG,iso(Cenko et al.2011), as well as the observed peak energy distribution of our
SGRB comparison sample, further limit the possible parameter space to the shaded regions(Model 1: blue; Model 2: red). Curves of particular values are displayed by the dashed curves. The solid curves indicates the location of the distribution mean values. The parameter space is furthermore limited by the results from Fermi reported in Goldstein et al.(2017a), displayed in yellow. The bands encompassing the Fermi measurements indicate the s1 confidence intervals. These constraints limit G0to <15 and <43 for Model 1 and Model 2, respectively.
We observed the position of AT2017gfo with ALMA and GMRT at 338.5 and 1.4 GHz, respectively, from 1.4 days to 44 days after the merger, our objective being to constrain the GRB afterglow component. The afterglow evaded detection at all epochs. Our radio and sub-mm observations allow us to place a firm upper limit of a few1026erg s-1in the sub-mm and radio,
probing a regime >2 4 orders of magnitudes fainter than– previous limits on SGRBs.
The emergence of an X-ray and radio transient at the position of AT2017gfo at 9 and 17 days after GW170817, respectively, is highly atypical for GRBs. Modeling the evolution from radio to X-ray frequencies with templates generated from 2D relativistic hydrodynamical jet simulations excludes all on-axis afterglow models (q1 2,jet>qobs) with sensible physical
para-meters. Adequate models, describing the evolution from X-ray to radio frequencies, require strict off-axis afterglow templates where q1 2,jet<qobs. Model 1 favors a jet, powered by
~
EAG,iso 1050erg, with magnetic equipartition ofB~10-2 and an initial half-opening angle of ~20 , traversing a circumburst medium withn =10-2cm-3. The second model
suggests a more collimated jet:EAG,iso~1051erg, q1 2,jet~ 5 ,
=2 ´10 ,- n =5 ´10- cm
-B 3 4 3. More detections of the
afterglow are needed to reduce the degeneracy in the model parameters. In both cases, our line of sight and the GRB jet axis were misaligned by ~41(wide-jet model) and ~ 20 (narrow-jet model), explaining the emergence of the afterglow only a week after the GRB. The viewing angle measurements are consistent with upper limits by Abbott et al.(2017b).
The jet parameters are, in both cases, consistent with mean values of the Swift SGRB population. Using q1 2,jet,qobs,and
EAG,iso of the blastwave, we inferred the true γ-ray energy
release and initial bulk Lorentz factor(G0) of the flow. We find
evidence for an ultra-relativistic jet with G <0 15 <43 for Model 1/2. The prompt energy release has to be at least a factor of a few higher than the kinetic energy in the afterglow, and peak energies of least several hundred keV that an on-axis observer would have recorded. Therefore, we conclude that a uniform top-hat jet model can broadly explain the observed gamma-ray properties of GRB 170817A. Limiting this parameter study is the degeneracy in the afterglow parameters, due to the limited amount of data, and the large uncertainties of the observed peak energy.
Using the best-match template we assessed if the afterglow contaminated significantly the KN optical emission. The contamination is <1% during the first week after GW170817. We also calculated the expected radio emission from the merger ejecta and found it to be negligible presently.
The afterglow modeling allows us to draw the following conclusions: (i) this is the first robust detection of an off-axis GRB with qobs>q1 2,jet and (ii) AT2017gfo and
GRB170817A have the same progenitor. These findings, in conjunction with the spectroscopic evidence for r-process elements in spectra of AT2017gfo (e.g., Pian et al. 2017; Smartt et al. 2017), demonstrate that some SGRBs are connected with BNSMs andfirmly establishes that AT2017gfo and GRB170817A are the electromagnetic counterpart to GW170817.
We thank the referee for a careful reading of the manuscript and for helpful comments that improved this paper.
We gratefully acknowledge support from: FONDECYT
grant 3130488 (SK), FONDECYT grant 3160439 (J.B.),
CONICYT grants Basal-CATA PFB-06/2007 (S.K., F.E.B., J.B.), FONDECYT Regular 1141218 (F.E.B., J.G.-L.), and Programa de Astronomia FONDO ALMA 2016 31160033 (J.G.-L.); the Ministry of Economy, Development, and Tourism’s Millennium Science Initiative through grant IC120009, awarded to The Millennium Institute of Astro-physics, MAS (F.E.B., J.B.); the Science and Technology Facilities Council (A.B.H., R.L.C.S.); the Spanish research project AYA 2014-58381-P (C.C.T., A.d.U.P., D.A.K.); the Ramón y Cajal fellowship RyC-2012-09975 (A.d.U.P.); the Ramón y Cajal fellowship RyC-2012-09984(C.C.T.); the 2016 BBVA Foundation Grant for Researchers and Cultural Creators (A.d.U.P.); the Juan de la Cierva Incorporación fellowship IJCI-2015-26153(D.A.K.); a VILLUM FONDEN Investigator grant (project number 16599; J.H.); the National Science Centre, Poland through the POLONEZ grant 2015/19/P/ST9/ 04010(M.J.M.); the European Union’s Horizon 2020 research and innovation programme under the Marie Skłodowska-Curie grant agreement No. 665778(M.J.M.); the Leverhulme Trust Early Career Fellowship (S.R.O.); S.C. acknowledge partial funding from ASI-INAF grant I/004/11/3; R.S.-R. acknowl-edges support from ASI (Italian Space Agency) through the contract No. 2015-046-R.0 and from European Union Horizon 2020 Programme under the AHEAD project (grant agreement No. 654215).
ALMA is a partnership of ESO (representing its member states), NSF (USA) and NINS (Japan), together with NRC (Canada), MOST and ASIAA (Taiwan), and KASI (Republic of Korea), in cooperation with the Republic of Chile. The Joint
ALMA Observatory is operated by ESO, AUI/NRAO
and NAOJ.
The GMRT is run by the National Center for Radio Astrophysics of the Tata Institute of Fundamental Research.
L. Resmi thanks Suma Murthy and Swagat R. Das for discussions on radio interferometric analysis.
This work made use of data supplied by the UK Swift Science Data Centre at the University of Leicester.
Development of the Boxfit code was supported in part by NASA through grant NNX10AF62G issued through the Astrophysics Theory Program and by the NSF through grant AST-1009863. Simulations for BOXFIT version 2 have been carried out in part on the computing facilities of the Computational Center for Particle and Astrophysics(C2PAP) of the research cooperation “Excellence Cluster Universe” in Garching, Germany.
Facilities: ALMA, GMRT.
Software: AIPS, Boxfit, CASA, MultiNest, PyMultiNest. ORCID iDs S. Kim https://orcid.org/0000-0001-8332-0023 J. González-López https://orcid.org/0000-0003-3926-1411 F. E. Bauer https://orcid.org/0000-0002-8686-8737 N. R. Tanvir https://orcid.org/0000-0003-3274-6336 S. Covino https://orcid.org/0000-0001-9078-5507 J. P. U. Fynbo https://orcid.org/0000-0002-8149-8298 J. Hjorth https://orcid.org/0000-0002-4571-2306 D. Malesani https://orcid.org/0000-0002-7517-326X B. Milvang-Jensen https://orcid.org/0000-0002-2281-2785 R. Sánchez-Ramírez https: //orcid.org/0000-0002-7158-5099 D. J. Watson https://orcid.org/0000-0002-4465-8264 K. Wiersema https://orcid.org/0000-0002-9133-7957
References
Abadie, J., Abbott, B. P., Abbott, R., et al. 2010,CQGra,27, 173001
Abbott, B. P., Abbott, R., Abbott, T. D., et al. 2016,PhRvL,116, 241102
Abbott, B. P., Abbott, R., Abbott, T. D., et al. 2017a,ApJL,848, L12
Abbott, B. P., Abbott, R., Abbott, T. D., et al. 2017b,PhRvL,119, 161101
Abbott, B. P., Abbott, R., Abbott, T. D., et al. 2017c,ApJL,848, L13
Alexander, K., Berger, E., Fong, W., et al. 2017b,ApJL,848, L21
Alexander, K., Fong, W., & Berger, E. 2017a, GCN, 21589 Allam, S., Annis, J., Berger, B., et al. 2017, GCN, 21530
Bannister, K., Lynch, C., Kaplan, D., & Murphy, T. 2017, GCN, 21537 Berger, E. 2014,ARA&A,52, 43
Blackburn, L., Briggs, N. S., Broida, J., et al. 2017, GCN, 21506 Bromberg, O., Nakar, E., Piran, T., & Sari, R. 2013,ApJ,764, 179
Buchner, J., Georgakakis, A., Nandra, K., et al. 2014,A&A,564, A125
Cenko, S. B., Emery, S. W. K., Campana, S., et al. 2017, GCN, 21572 Cenko, S. B., Frail, D. A., Harrison, F. A., et al. 2011,ApJ,732, 29
Chandra, P., & Frail, D. A. 2012,ApJ,746, 156
Corsi, A., Hallinan, G., Mooley, K., et al. 2017a, GCN, 21815
Corsi, A., Kasliwal, M. M., Frail, D., & Paliyaguru, N. T. 2017b, GCN, 201664 Corsi, A., & Kasliwal, M. M. 2017a, GCN, 21613
Corsi, A., & Kasliwal, M. M. 2017b, GCN, 21614 Corsi, A., & Kasliwal, M. M. 2017c, GCN, 21636
Coulter, D. A., Kilpatrick, C. D., Siebert, M. R., et al. 2017a, GCN, 21529 Coulter, D. A., Kilpatrick, C. D., Siebert, M. R., et al. 2017b, TNS
Astronomical Transient Report,13195
D’Avanzo, P., Salvaterra, R., Bernardini, M. G., et al. 2014, MNRAS,
442, 2342
De, K., Mooley, K., Chandra, P., et al. 2017, GCN, 21708
de Ugarte Postigo, A., Lundgren, A., Martín, S., et al. 2012,A&A,538, A44
Deller, A., Bailes, M., Andreoni, I., et al. 2017, GCN, 21588 Donaghy, T. Q. 2006,ApJ,645, 436
Eichler, D., Livio, M., Piran, T., & Schramm, D. N. 1989,Natur,340, 126
Einstein, A. 1918, Sitzungsberichte der Königlich Preußischen Akademie der Wissenschaften(Berlin),154
Einstein, A. 1916, Sitzungsberichte der Königlich Preußischen Akademie der Wissenschaften(Berlin),688
Evans, P. A., Cenko, S. B., Kennea, J. A., et al. 2017b,Sci,https://doi.org/ 10.1126/science.aap9580
Evans, P. A., Kennea, J., Breeveld, A. A., et al. 2017a, GCN, 21550 Evans, P. A., Willingale, R., Osborne, J. P., et al. 2010,A&A,519, A102
Feroz, F., Hobson, M. P., Cameron, E., & Pettitt, A. N. 2013, arXiv:1306.2144
Fong, W., Berger, E., Margutti, R., & Zauderer, B. A. 2015,ApJ,815, 102
Fong, W., Margutti, R., & Haggard, D. 2017, GCN, 21786 Fynbo, J. P. U., Sollerman, J., Hjorth, J., et al. 2004,ApJ,609, 962
Goldstein, A., Veres, P., von Kienlin, A., et al. 2017a, GCN, 21528 Goldstein, A., Veres, P., Burns, E., et al. 2017b,ApJL,848, L14
Granot, J., Gill, R., Guetta, D., & De Colle, F. 2017, MNRAS, submitted (arXiv:1710.06421)
Graziani, C., Lamb, D. Q., & Donaghy, T. Q. 2005, BAAS,37, 507
Guidorzi, C., Clemens, C., Kobayashi, S., et al. 2009,A&A,499, 439
Haggard, D., Nynka, M., Kalogera, V., et al. 2017a, GCN, 21798 Haggard, D., Nynka, M., Ruan, J. J., et al. 2017b,ApJL,848, L31
Hallinan, G., Corsi, C., Mooley, K., Frail, D. A., & Kasliwal, M. 2017a, GCN, 21929
Hallinan, G., Corsi, A., Mooley, K. P., et al. 2017b, Sci,https://doi.org/ 10.1126/science.aap9855
Hjorth, J., Levan, A. J., Tanvir, N. R., et al. 2017,ApJL,848, L31
Jin, Z.-P., Hotokezaka, K., Li, X., et al. 2016,NatCo,7, 12898
Jin, Z.-P., Li, X., Cano, Z., et al. 2015,ApJL,811, L22
Kann, D. A., Klose, S., Zhang, B., et al. 2011,ApJ,734, 96
Kaplan, D., Murphy, T., Bannister, K., et al. 2017, GCN, 21574 Kasen, D., Badnell, N. R., & Barnes, J. 2013,ApJ,774, 25
Krühler, T., Greiner, J., Afonso, P., et al. 2009,A&A,508, 593
Levan, A. J., Lyman, J. D., Tanvir, N. R., et al. 2017,ApJL,848, L28
Li, L.-X., & Paczyński, B. 1998,ApJL,507, L59
Margutti, R., Berger, E., Fong, W., et al. 2017,ApJL,848, L20
McMullin, J. P., Waters, B., Schiebel, D., Young, W., & Golap, K. 2007, in ASP Conf. Ser. 376, Astronomical Data Analysis Software and Systems XVI, ed. R. A. Shaw, F. Hill, & D. J. Bell(San Francisco, CA: ASP),127
Melandri, A., Campana, S., Covino, S., et al. 2017, GCN, 21532 Metzger, B. D. 2017,LRR,20, 3
Metzger, B. D., & Bower, G. C. 2014,MNRAS,437, 1821
Mooley, K. P., & Hallinan, G. 2017, GCN, 21650
Mooley, K. P., Hallinan, G., & Corsi, A. 2017, GCN, 21814 Nakar, E. 2007,PhR,442, 166
Nakar, E., & Piran, T. 2011,Natur,478, 82
Pian, E., D’Avanzo, P., Benetti, S., et al. 2017,Natur,551, 67
Piran, T. 2004,RvMP,76, 1143
Planck Collaboration XVI 2014A&A,571, A16
Resmi, L., Misra, M., Tanvir, N. R., O’Brian, P., & Schulze, S. 2017, GCN, 21768 Rosswog, S. 2005,ApJ,634, 1202
Rowlinson, A., O’Brien, P. T., Tanvir, N. R., et al. 2010,MNRAS,409, 531
Sari, R., Piran, T., & Narayan, R. 1998,ApJL,497, L17
Savchenko, V., Ferrigno, C., Kuulkers, E., et al. 2017b,ApJL,848, L15
Savchenko, V., Mereghetti, S., Ferrigno, C., et al. 2017a, GCN, 21507 Schulze, S., Malesani, D., Cucchiara, A., et al. 2014,A&A,566, A102
Schulze, S., Malesani, D., Cucchiara, A., et al. 2017, GCN, 21747 Siebert, M. R., Foley, R. J., Drout, M. R., et al. 2017,ApJL,848, L26
Smartt, S. J., Chen, T.-W., Jerkstrand, A., et al. 2017,Natur,551, 75
Sugita, S., Kawai, N., Serino, M., et al. 2017, GCN, 21555
Swarup, G., Ananthakrishnan, S., Kapahi, V. K., et al. 1991, CSci, 60, 95 Tanaka, M., Hotokezaka, K., Kyutoku, K., et al. 2014,ApJ,780, 31
Tanvir, N. R., & Levan, A. J. 2017a, GCN, 21544
Tanvir, N. R., Levan, A. J., Fruchter, A. S., et al. 2013,Natur,500, 547
Tanvir, N. R., Levan, A. J., Gonzalez-Fernandez, C., et al. 2017b, ApJL,
848, L27
Troja, E., Piro, L., Sakamoto, T., et al. 2017a, GCN, 21765 Troja, E., Piro, L., van Eerten, H., et al. 2017b,Natur,551, 71
van Eerten, H., van der Horst, A., & MacFadyen, A. 2012,ApJ,749, 44
von Kienlin, A., Meegan, C., & Goldstein, A. 2017, GCN, 21520
Wells, D. C. 1985, in Data Analysis in Astronomy, ed. V. di Gesu et al.(New York: Plenum),195
Wootten, A., & Thompson, A. R. 2009,IEEEP,97, 1463
Yamazaki, R., Ioka, K., & Nakamura, T. 2003a,ApJ,593, 941
Yamazaki, R., Yonetoku, D., & Nakamura, T. 2003b,ApJL,594, L79
Yang, S., Valenti, S., Sand, D., et al. 2017, GCN, 21531 Zhang, B., Zhang, B.-B., Virgili, F. J., et al. 2009,ApJ,703, 1696
Zhang, B.-B., Zhang, B., Sun, H., et al. 2017, arXiv:1710.05851