DOI 10.1393/ncc/i2020-20121-5
Communications: SIF Congress 2019
Can reference radiosounding measurements be used to improve
historical time series?
Fabio Madonna
Consiglio Nazionale delle Ricerche, Istituto di Metodologie per l’Analisi Ambientale (CNR-IMAA) - Tito Scalo (Potenza), Italy
received 23 January 2020
Summary. — Upper-air radiosounding observations are undoubtedly a primary data source for the study of climate and for the atmospheric reanalysis. Nevertheless, historical radiosounding time series are affected by several systematic uncertainties due to change in the measurement sensors. As an alternative to the few existing approaches, in the frame of the Copernicus Climate Change Service (C3S), a novel approach, named RHARM (Radiosounding HARMonization), has been developed to provide a homogenized dataset of temperature, humidity and wind radiosounding profiles available from the Integrated Global Radiosonde Archive (IGRA) along with an estimation of the total uncertainty for each profile. Estimation of uncertainties has never been developed in previous homogenization algorithms. The homoge-nization is carried out for a substantial subset of IGRA radiosounding stations. Comparisons of trends calculated at 300 hPa over Europe in the period 2000–2018 using ERA5 ECWMF atmospheric reanalysis, IGRA and RHARM datasets show a good agreement for temperature with mutual differences within 0.05 K/da. For relative humidity, ERA5 shows a trend of−0.7%/da, while the trend for IGRA and RHARM is of 0.5%/da and 0.8%/da, respectively. The usefulness of comparing, for the first time, ERA5 and RHARM time series taking advantage of the RHARM uncertainty is also discussed.
1. – Introduction
Radiosonde measurements are primarily made to provide the data needed to constrain weather forecasts and not to detect long-term changes in climate. As a consequence, lit-tle attention has been historically paid to ensuring the long-term homogeneity of the measurement records. A variety of reasons can cause such inhomogeneities: changes in station location and in measurement sensor, calibration issues or drifts, changes in the measurement procedures and undocumented changes in data processing. These inhomo-geneities are enhanced where a long suite of parallel measurements to quantify bias due to sensor changes is both practically and financially unfeasible in the vast majority of
2 FABIO MADONNA
cases. Systematic effects generating inhomogeneities may also randomize over long time periods, i.e., decades, further loosening the reliability of radiosounding time series. As a result, radiosonde data records typically fall short of the standard required to reliably detect changes in climate.
It is therefore important to identify discontinuities in time series to avoid the use of observations affected by undesirable non-climatic effects. Several research groups used reference simulated data, neighboring stations or atmospheric reanalysis to adjust historical radiosounding time series [1-8]. Further innovative solutions have been also proposed and are under investigation [9].
The recent establishment, in 2006, of the Global Climate Observing System (GCOS) Reference Upper-Air Network (GRUAN) [10], responds to the need of providing homo-geneous and fully traceable upper-air measurements with quantified uncertainties. As a reference network, GRUAN plays also the role of providing observations and methods to allow an enhanced interpretation of the results and of the quantification of uncertainties for the baseline observations [11].
Fully exploiting the latter concept, in the frame of the Copernicus Climate Change Service (C3S), a novel approach, named RHARM (Radiosounding HAR-Monization), has been developed to provide a homogenized dataset of tem-perature, humidity and wind profiles along with an estimation of the related uncertainties for a substantive subset of radiosounding stations globally distributed among those available from the Integrated Global Radiosonde Archive (IGRA, https :// www.ncdc.noaa.gov/data-access/weather-balloon/integrated-global-radiosonde-archive). RHARM is the first approach implementing adjustments on single profiles and providing an uncertainty estimate.
In this paper, a short overview of the RHARM approach is presented along with re-sults and examples aiming at showing the novelties brought by RHARM and the benefit obtained from the usage of RHARM homogenized time series. A more detailed descrip-tion of the RHARM approach is provided in Madonna et al. [12].
The paper is structured as follows. In sect. 2, the datasets used to build the RHARM approach are described. In sect. 3, an overview of the approach is provided while in sect. 4 results and examples are presented. A summary and a short discussion close the paper.
2. – Datasets
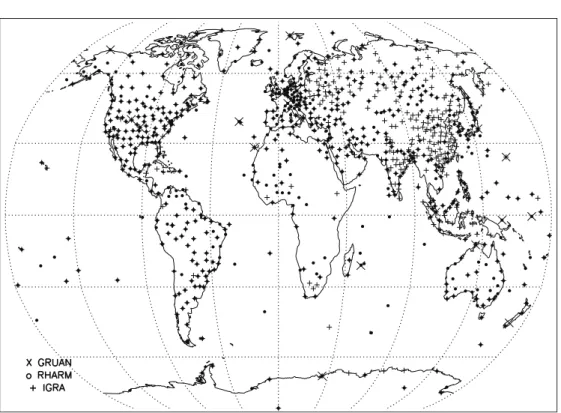
The RHARM approach is applied to the IGRA database which is the most comprehen-sive collection of historical and near-real-time radiosonde and pilot balloon observations from around the globe. The current version of RHARM is applied to a combination of both IGRA v1 [13] and v2 [2] data. The RHARM approach is able to homogenize a subset of 600 radiosounding stations, shown fig. 1 (black dots), which are almost all those with documented metadata since 2000. Figure 1 also shows the GRUAN stations with a substantive data records available since 2010 (× symbol) and all the IGRA sta-tions reporting metadata to the WMO information systems (WIS) on December 2019 (+ symbol). The station distribution for RHARM reveals a reasonable global coverage, with North America, North East Asia and North of Siberia, and East Africa representing the regions with the lowest station density. Further in-depth statistical analysis of the IGRA historical time series, their temporal and spatial coverage, at different pressure levels is also available in [2] and in [14], the latter for relative humidity observations only.
Fig. 1. – Map of stations available from the Integrated Global Radiosonde Archive (IGRA) at NOAA/NCEI in December 2019 (+ symbol), from the the GCOS Reference Upper Air Network, GRUAN (× symbol) and from RHARM homogenization (black dots).
Another statistical analysis of the missing data and of the spatial coverage of the IGRA data is provided in [15].
In sect. 4, IGRA and RHARM are compared with the ERA5 ECWMF atmospheric reanalysis: ERA5 is the latest climate reanalysis produced by ECMWF providing hourly data on regular latitude-longitude grids at 0.25◦× 0.25◦ resolution, with atmospheric parameters on 137 pressure levels. ERA5 is publicly available in the Copernicus Cli-mate Data Store (CDS, https://cds.cliCli-mate.copernicus.eu). ERA5 is one of the most utilized dataset for the study of climate. More details about ERA5 can be found in [16]. The data shown in sect. 4 have been retrieved from the CDS using the C3S toolbox that allows users to build workflows and applications tailored to their needs (https://cds.climate.copernicus.eu/toolbox-editor/).
3. – Methodology: short overview
RHARM is applied to daily (00:00 and 12:00 UTC) radiosonde data on 16 standard pressure levels (10, 20, 30, 50, 70, 100, 150, 200, 250, 300, 400, 500, 700, 850, 925, 1000 hPa) for the IGRA data from 1978 onward. Relative humidity (RH) adjustments are limited to 300 hPa owing to pervasive sensor performance issues at greater altitudes. Profiles are harmonized at these mandatory pressure levels which do not change on a per-profiles basis as for significant levels. Moreover, the frequency of reports below 10 hPa is much lower than above and this largely decreases the performance of the RHARM
4 FABIO MADONNA
approach. The applied adjustments are interpolated to all the other significant levels to retain information contained within each individual ascent profile.
In RHARM, each time series is represented using an additive model, (1) x(p, t) = T r(p, t) + S(p, t) + ε(p, t),
where x is the time series of temperature, RH or wind components, T r is the unknown climate trend, S is the climate variability, and ε ∼ N(0, σε2) represents the residuals and is dependent on the local meteorological variability and on the measurement uncer-tainties. x depends on the pressure (p) and the time (t). Temperature time series are filtered for the presence of “strong outliers” using the quantile method [17], while the large variability characterizing RH and wind time series makes the outliers filtering more difficult.
The homogenized time series, xH(p, t), are obtained using a hybrid approach imple-mented in two consecutive stages:
• Each historical time series of temperature, humidity and wind available at
each IGRA radiosounding station is post-processed to adjust instrumental ef-fects and to quantify uncertainties using a scheme which mimics the GRUAN Data Processing (GDP) [18] and using the 2010 WMO/CIMO radiosonde intercomparison dataset (hereinafter ID2010) [19]. These adjustments can only be applied to the most recent period of the record when these particular radiosonde models have been in operation at each station (typically start-ing between 2004 and 2010 but varystart-ing on a station-by-station basis) and when IGRA metadata containing the radiosonde code (see WMO table 3685, https://www.wmo.int/pages/prog/www/WMOCodes/WMO306 vI2/LatestVERSION/ WMO306 vI2 CommonTable en.pdf) are available. Along with the adjustments, corresponding uncertainties are also estimated. Hereinafter this portion of each time series will be indicated with the acronym PPTS (Post-Processed Time Series).
• The remaining portion of the time series, before about 2004, is then examined for
the presence of systematic effects using a homogenization technique which identifies structural breaks through a scanning of the time series. RHARM uses a LOESS (LOcally Estimated Scatterplot Smoothing) to estimate T r(p, t) in eq. (1) and then applies the CUmulative SUMming method, CUSUM [20], to detect structural breaks. Once the structural breaks are identified, exponential functions are used to estimate the non-climatic signals, starting from the most recent pair of structural breaks. The first step is to fit an exponential trend to the PPTS and use it as the reference to adjust the time series between two breaks. The same procedure, backward in time, is then applied to each pair of breaks but replacing PPTS with the portion of the time series homogenized at the previous step.
Finally, as noted above, a very important aspect of RHARM is that an uncertainty is attributed to each value xH(p, t), at each pressure level, of the homogenized time se-ries. The total uncertainty is estimated using the residuals ε(p, t) of each time series with respect to a predictor model (also in this case obtained using a LOESS smoother). Smoothed time series are obtained by regulating the smoothing parameter, at each single station, to match the residuals with the uncertainty of the PPTS. The obtained smooth-ing parameter is then assumed to be optimal for the entire time series and the final value of the uncertainty is obtained by averaging the residuals on a monthly time scale.
The uncertainty is not estimated for those months with an availability of less than 15 radiosoundings.
As for all the homogenization approaches, there are attendant limitations to the use of RHARM: i) the radiosoundings data processing provided by IGRA stations is based on the manufacturer processing software which is used as a black-box and known to change with time (sometimes documented by the manufacturer, although the timing when in-dividual stations changed software is not often discernible); and ii) raw high resolution profile data from each baseline station are not available to allow the full exploitation of the GDP. Moreover, given the metadata and information available though IGRA for each radiosounding profile, an approximation of the GDP, with simplifying assumptions, must be applied.
The adjustments applied to a time series also impact the total uncertainty budget. In fact, the outcome of bias determination is often ambiguous. In such cases, adjustments should not be done and the associated uncertainty should cover the possible systematic effects, even though the inflated uncertainty might strongly affect the users’ ability to utilize the homogenized data stream. Under these premises and in analogy with previous efforts reported in the literature, the RHARM dataset is calculated assuming that ad-justments of systematic effects do not affect the total uncertainty budget and, therefore, when false positives are detected, the uncertainty may be underestimated.
4. – Example and results
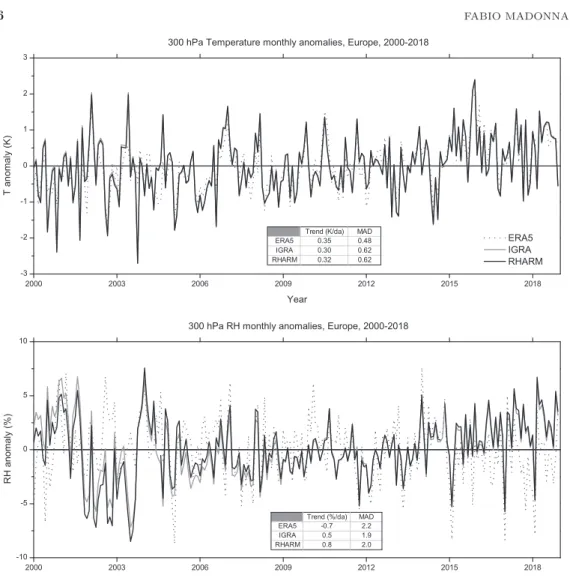
This section shows a few examples of the products provided by the RHARM approach. Figure 2 shows the comparison of the 300 hPa monthly temperature (upper panel) and RH (bottom panel) anomalies in the period 2000–2018 calculated for the ERA5 ECWMF atmospheric reanalysis, IGRA and RHARM. In each panel of fig. 2, a table has been also reported to compare the values of the decadal trends (in K/da and %/da, respectively) and of the median absolute deviation (MAD) for the robust regression method utilized for the estimation. The upper panel of fig. 2 reveals the good agreement among the three datasets with differences in the estimated trends within 0.05 K/da. Compared to the observations, a few differences can be noted both in the magnitude of the ERA5 anomalies and in the extreme values. The difference between IGRA and RHARM is small and its visualization is not easy and this is reflected in the estimated trends with a difference of 0.02 K/da. It is worth stressing that providing an accurate estimate trends may be often challenging, being the estimation uncertainties larger than trends themselves.
For relative humidity (bottom panel), the difference in the monthly anomalies is more pronounced than for temperature and this is likely due to the absence of a bias correction in ERA5 which, instead, is applied for temperature and is able to reconcile the multiple assimilated data sources. For RH, the ERA5 estimated decadal trends (−0.5%/da) is negative compared to both IGRA (0.5%/da) and RHARM (0.8%/da). In particular, it can be noted that ERA5 is drier than the observations from 2015 on. The difference between IGRA and RHARM is mainly due to the solar radiation effect on the measurement sensor [18]: the solar radiation heats the sensor and produces an artificial increase of the measured temperature and a decrease of relative humidity (the latter known as “dry radiation bias”). Past sensors have shown also “wet radiation biases” producing humidity measurements higher than real values. RHARM works to reduce these systematic effects in the measured time series.
6 FABIO MADONNA
Fig. 2. – Top panel, comparison of the monthly anomalies time series at 300 hPa over Europe for temperature (upper panel) and relative humidity (bottom panel) in the period 2000–2019 obtained from ERA5 (dashed line), IGRA (gray line) and RHARM (dark line). In both panels, a table shows the values of the estimated decadal trends and the absolute deviation of the robust regression method.
The autocorrelation among the data of each time series has been estimated and the first-order term, AR(1), has been included in the trend estimation. The autocorrelation coefficient describes the degree of persistence in the time series at the weather timescale,
e.g., day-to-day.
Figure 3 shows the comparison between the relative humidity time series obtained using RHARM (dark grey), shown with its uncertainty (vertical error bar), and ERA5 (nearest grid point, in dark grey and dots) at 300 hPa for the Flagstaff station, US (35.23N, 111.82W, WMO index = 72376) in the first two months of 1996. For ERA5, using the C3S toolbox, the nearest point of the reanalysis grid to station is consid-ered (35.25N, 111.75W). The ERA5 values are in the range 0–120% RH, which includes the supersaturation condition, that cannot be measured using radiosondes (limited to
Fig. 3. – Comparison of a relative humidity time series obtained using RHARM (dark grey), shown with its uncertainty (vertical error bar), and ERA5 (nearest grid point) at 300 hPa for the Flagstaff station, US (35.23N, 111.82W, WMO index = 72376) in the first two months of 1996.
100% RH). The quantification of the uncertainties is important to reveal where discrep-ancies between the observations and the atmospheric reanalysis are not acceptable. The time series in fig. 3 shows that the peak values in the observations time series are often overestimated by ERA5, while in the driest conditions the agreement looks better. The comparison between observations and reanalysis at the level of single station, i.e., single grid point, presents an obvious limitation related to the reanalysis horizontal resolution and to the representativeness of each grid point. An assessment at a broad scale will be provided in upcoming papers [12].
It must be also stressed that in RHARM any type of correlation between the uncer-tainties has been neglected. Were correlation to exist, the unceruncer-tainties would need to be inflated commensurately.
5. – Summary and discussion
The RHARM approach homogenizes radiosounding temperature, relative humidity and wind profiles available from the IGRA historical data archive, fully exploiting the added value recently brought in by the recent availability of reference measurements from GRUAN and “golden dataset” such as the 2010 WMO/CIMO radiosonde inter-comparison. The approach is able to harmonize a substantive subset of the available radiosounding stations globally distributed among those available from the IGRA.
The RHARM dataset provides one homogenization option, complementary to the very few existing datasets of homogenized radiosounding wind measurements, which differs
8 FABIO MADONNA
from previous efforts because it uses “reference measurements” to calculate and adjust for systematic effects instead of using background information provided by reanalysis, autoregressive models or neighboring stations. In addition, and of great practical im-portance, each harmonized data series is provided with an estimation of the uncertainty, provided in the past only as a rough or average estimation in existing homogenization approaches.
The RHARM algorithm also aims to show the importance of the availability of ref-erence data from GRUAN and from WMO/CIMO intercomparison data to quantify the uncertainties in the characterization of present and historical radiosounding datasets.
Future developments of the RHARM approach will try to expand the homogenization approach to a larger number of radiosounding stations where metadata are not available working at a spatial level. A further test will be based on the use of additional information from the ECWMF reanalysis for the adjustment of systematic effects. There is also a plan to adjust not only the mean values of the time series but also the variance. An example of adjustments of all the moments of a time series is provided by Della Marta
et al. [21].
Ideally it would be desirable to be able to directly reprocess the raw data which are very often not preserved at the measurements stations. An alternative could be represented by the post-processing of all the dataset using the data from available inter-comparisons and disclosing corrections used by manufacturers for each sonde type used in the past. At present, it is undoubted that this process is not viable because the lack of metadata does not allow to rebuild the history of each station, even in the case that information from manufacturers would be fully available and usable. Various C3S activ-ities are enriching the number of available metadata which surely will allow to improve the quality of the homogenization of radiosounding time series available to the users in the future and, among the others, RHARM will surely benefit from these metadata which shall be included in the future versions.
∗ ∗ ∗
This work was done on behalf of the European Union’s Copernicus Climate Change Service implemented by ECMWF. Use of data as stated in the Copernicus license agree-ment is acknowledged. Thanks to the GRUAN Lead Center for sharing the look-up table of the Streamer RTM and to Dr. Aldo Amodeo for the useful recommendations. The Yangjiang Intercomparison Dataset (ID2010) has been released upon agreement with the WMO YID protocol, signed by CNR-IMAA and WMO on 27/07/2017.
REFERENCES
[1] Dai A. et al., J. Clim., 24 (2011) 965.
[2] Durr´e I.et al., J. Atmos. Ocean. Technol., 35 (2018) 1753. [3] Free M. et al., J. Geophys. Res., 110 (2005) D07101. [4] Haimberger L. et al., J. Clim., 25 (2012) 8108. [5] McCarthy M. P. et al., J. Clim., 22 (2009) 5820.
[6] Ramella Pralungo L. et al., Earth Syst. Sci. Data, 6 (2015) 185. [7] Sherwood S. C. and Nishant N., Environ. Res. Lett., 10 (2015) 054007. [8] Thorne P. W. et al., J. Geophys. Res., 110 (2005) D18105.
[9] Fass`o A.et al., Stat. Prob. Lett., 136 (2018) 97.
[10] Bodeker G. E. et al., Bull. Am. Meteorol. Soc., 97 (2016) 123.
[12] Madonna F. et al., Radiosounding HARMonization (RHARM): A new homogenized dataset of radiosounding temperature, humidity and wind profiles with uncertainty, https://doi.org/10.5194/essd-2020-183.
[13] Durr´e I.et al., J. Clim., 19 (2006) 53.
[14] Ferreira A. P. et al., Earth Syst. Sci. Data, 11 (2019) 603.
[15] Sy S. et al., Int. J. Climatol., https://doi.org/10.1002/joc.6827 (2020). [16] Hersbach H. et al., ECMWF ERA Report Series, 27 (2018).
[17] Tukey J. W., Exploratory Data Analysis (Addison-Wesley Publishing Company) 1977. [18] Dirksen R. J. et al., Atmos. Meas. Tech., 7 (2014) 4463.
[19] Nash J. et al., WMO intercomparison of high quality radiosonde systems, Yangjiang, China, 12 July - 3 August 2010, Report No. 107, WMO/TD-No. 1580 (WMO) 2011. [20] Aue A. and Horv´ath L., J. Time Ser. Anal., 34 (2013) 1.