Corresponding author Eleonora Nicolai
Department of Experimental Medicine and Surgery University of Rome “Tor Vergata”
Rome, Italy
E-mail: [email protected]
Evaluation of BiesseBioscreen
as a new methodology for bacteriuria screening
Eleonora Nicolai1, Simona Garau2, Cartesio Favalli1,3, Cartesio D’Agostini3,Enrico Gratton4, Guido Motolese2 , Nicola Rosato1,5
1Department of Experimental Medicine and Surgery, University of Rome “Tor Vergata”, Rome, Italy; 2ASI-Apparecchiature Scientifiche Innovative-S.r.l., Milan, Italy;
3Clinical Microbiology Laboratories, Tor Vergata Hospital Foundation, Rome, Italy;
4Laboratory for Fluorescence Dynamics, BME Department, University of California, Irvine, California, USA; 5NAST Centre, University of Rome “Tor Vergata”, Rome, Italy
INTRODUCTION
Urinary tract infection (UTI) is one of the most common infections, in both hospitalized and community patients and its diagnosis requires symptoms, signs and the urinoculture results. These last data are obtained in the clinical mi-crobiology laboratory (Peleg et al., 2010; Stamm
et al., 1993).
For most patients the disease of the infection is minimal but for particular subpopulations may develop serious complications. Urine culture is the standard for diagnosing urinary tract
in-SUMMARy
Received December 17, 2013 Accepted July 3, 2014
Urinary tract infection is a common disease diagnosed from symptoms and clinical signs, and bacterial count per volume of urine. This study have evaluated the BiesseBioscreen analyzer as a new way to analyze urine samples en-abling fast screening of urine, prior to reference standard methods currently utilized in microbiology analysis labo-ratory. We analyzed 962 urine samples from outpatients and inpatients of the Tor Vergata (TV) University Hospital of the University of Rome “Tor Vergata”. All samples were processed both with the BiesseBioscreen and with the standard methodology adopted by the clinical microbiology laboratory of TV Hospital and the results were com-pared. Of the samples analyzed 54.9% were concordant negative with the reference method and 21.6% concordant positive, 23.3% resulted false positive and 0.2% false negative. The results obtained from BiesseBioscreen showed a sensitivity of 99.0%, indicating it as a system suitable to rule out urinary tract infection. BiesseBioscreen could represent a valid method for screening negative samples to exclude from culture test with a potential reduction in time, workload and costs of the diagnosis.
KEY WORDS: Bacteriuria screening, Fluorescent assays, Urinary tract infection, Nucleic probe, Bacterial culture.
fections, even if it is a laborious procedure and produces more than 60% of negative results (Broeren et al., 2011; Brilha et al., 2010; Jolk-konen et al., 2010).
A fast screening method able to reduce the urine culture will have a deep impact on laboratory in term of workload and cost for a clinical anal-ysis. A screening method able to identify and to exclude negative urine samples with a high sensitivity and high negative predicted value, to avoid positive urine samples from being classi-fied as negative, would have a large impact on laboratory economics.
Moreover the exclusion of bacteria infection through a fast test may help to reduce unnec-essary prescriptions and usage of antibiotics. The increased usage of antibiotics indeed has consequences, such as prolonged infections, that may dramatically increase recovery time, hospital stays and health care costs.
Further-more it may also determine the growth of resis-tant micro-organisms which do not respond to conventional treatment, resulting in prolonged illness and greater risk for health.
Our aim is to evaluate the detection of bacteria by BiesseBioscreen, in order to identify nega-tive urine samples, excluding them from urine culture. BiesseBioscreen is an instrument de-veloped by ASI (Milan, Italy) based on a tech-nology patented in collaboration with the Uni-versity of Urbana-Champaign, IL, USA, (patent number: US7, 973, 294 B2; Jul. 5, 2011). The BiesseBioscreen method described in the pat-ent, allows measuring the concentration of flu-orescent particles in a liquid medium (Magde et
al., 1974; Chen et al., 1999a; Chen et al., 1999b;
Duda et al., 2001; Berland et al., 1995; Digman
et al., 2008). The instrument is equipped with a
rotating and translating sample holder. Biesse-Bioscreen uses pattern recognition data analy-sis techniques for measuring the concentrations and for characterizing fluorescent particles on the basis of size, shape, diffusion constant and or composition.
In this study we compared the detection of bac-teria of BiesseBioscreen to the standard meth-odology adopted by the clinical microbiology laboratory of Polyclinic Tor Vergata, Universi-ty hospital of the UniversiUniversi-ty of Rome Tor Ver-gata. The laboratory adopts the HB&L-URO4 Alifax: a kit for a rapid automated bacteriuria screening and for residual antimicrobial ac-tivity (RAA) testing in urinary samples, with results obtainable in 3 hours. (Ballabio et al., 2010; Fortina et al., 2010; Barocci et al., 2010; Ilki et al., 2010; Tessari et al., 2010; Milagro et
al., 1999).
The system uses light scattering technology to detect the growth of bacteria and has been re-cently utilized for the culture of fluid samples, for the detection of antibiotic-resistant bacte-ria, and for antibiotic-susceptibility testing di-rectly on urine samples. (Roveta et al., 2004; Roveta et al., 2006; Fontana et al., 2009).
MATERIALS AND METHODS Patients
A total of 962 urine specimens were collected from both inpatients and outpatients of the
Tor Vergata (TV) University hospital of Rome “Tor Vergata”. The collection was done in two different periods: 481 samples in September 2012 and 481 in March 2013. We collected all the routine samples, sampled by the microbi-ology laboratory in the periods indicated, with no selection. Each sample was identified by a serial code with no patient information such as sex or age. The microbiology screening were performed using the HB&L-Uro4 system by the hospital Clinical Microbiology Laboratory, and using the BiesseBioscreen system by the De-partment of Experimental Medicine and Sur-gery of the University of Rome “Tor Vergata”.
Microbiological analysis with the HB&L-Uro4system
The HB&L-Uro4 test gives information of live bacteria count reported in CFU/ml, using a pat-ented technology based on light scattering mea-surements.
A laser scans sample holder and the detected signals are translated into growth curves. A to-tal of 500 µl of sample was seeded in a 2 ml broth vial, placed in the machine incubation box at 37°C and monitored for 6 h.
The samples were read every 5 minutes. A mag-netic stirrer bar homogenized the vial content before each reading, and growth of microor-ganisms was monitored in real-time by dis-playing growth curves on the computer screen. Furthermore, the HB&L-Uro4 system is also programmed, via the residual antimicrobial activity (RAA) test, to evaluate the RAA in the samples at the time of screening, detecting the residual antimicrobial activity of a drug ad-ministered to a patient before the collection of specimens.
The system employs two vials, a gold-capped vial used for the culture test and a red-capped vial for RAA test. Both vials contain the en-riched medium intended to support the growth of the majority of microorganisms. Upon arriv-al in the laboratory, 500 µl arriv-aliquots of each fluid sample were dispensed in the culture and RAA vials. The RAA vials were inoculated with the reference strain derived from Staphylococcus
epidermidis ATCC 12228 according to the
sup-plier’s instructions. The samples were cultured in the HB&L-Uro4 for 6 hours to achieve a cut-off lower than 50 cfu/ml.
Instrument characteristics
The present instrument comprises an optical analysis device for determining the concentra-tion of particles in a fluid sample. It has a cy-lindrical cuvette (about 1 cm in diameter) for holding the fluid sample, with two motors that provide a rotational (about 2 rev/s) and a slower vertical inversion (about 2.5 centimeters/s) mo-tions. The slow vertical scanning is useful to en-sure statistical independence of the observation volume explored in subsequent vertical sweeps. The excitation light is generated by a 532 nm neodymium-yttrium laser.
A lens focuses the excitation light onto the sam-ple held in the cuvette thereby causing particles in the sample to generate fluorescence, and also collects the fluorescence from an observation volume in the sample.
The illumination focus is centered about 200 µm from the wall of the cuvette inside the sample. The photodetector is in optical com-munication with the confocal microscope and receives a portion of the fluorescence from the observation volume measuring its intensity as a function of time, thereby generating a temporal profile of the fluorescence from the observation volume.
The combination of a confocal microscope and a means for moving the container holding the sample provides an effective means for trans-porting substantial volumes (e.g. milliliters) of the fluid sample through the observation vol-ume without requiring a flowing system. The processor, having a pattern recognition algorithm is in communication with the pho-todetector for receiving an output signal cor-responding to the temporal profile generated by the photodetector. The pattern recognition algorithm analyzes the temporal profile, deter-mining the concentration of the particles in the samples. The algorithm matches features in the temporal profile to predetermined patterns that correspond to the time-dependent fluorescence intensities of particles passing through the ob-servation volume.
The concentration of particles is determined by calculating the number of predetermined pat-terns matched to features in the temporal profile for a given sample scanning period. Concentra-tions are extracted from the analyzed temporal profile by dividing the number of matches by
the volume of sample analyzed during a select-ed sample scanning period, which can be ac-curately calculated with knowledge of the size of the observation volume, rate of movement of the container (e.g. rate of vertical and horizon-tal displacement) and the duration of the sam-ple scanning period.
Microbiological analysis with the BiesseBioscreen system
Analyses with BiesseBioscreen were performed on the same sample processed by the Uro4-HB&L reference method. Samples were stored on ice and examined within 5 hours of receipt in the laboratory. Measurements were performed diluting at first 30 µl of urine samples in 1ml of isotonic solution and incubating for 7 minutes at 80°C. After dilution, 30 µl 0.05 mM of nucle-ic fluorescent probe (SYTOX® Orange Nucleic
Acid Stain, INVITROGEN c.n.: S11368) were added to the samples. Finally before measur-ing, the samples were further diluted up to 3 ml. The cuvette containing the 3 ml sample was inserted in the instrument, measured for 60 seconds at the end of which the operator read directly on the instrument screen the value of the CFU/ml. Each sample was measured five times and the average value was used for the statistical analysis.
Whereas the experiment was performed in two distinct periods, after the results obtained in the first run some changes were added in the second run to improve the measurements pro-tocol. In the first testing the 481 samples were diluted in phosphate buffer (PBS), while in sub-sequent measurements, isotonic solution was used for the other 481 samples. Moreover in the second period of measurements each sample was prepared twice and measured twice to ex-clude a manual error or a pipette malfunction.
Statistical methods
All analyses were performed in comparison with HB&L-Uro4 that was used as the gold standard. The evaluation was performed con-sidering for both methodologies, a sample as positive if it exceeded the 100,000 CFU/ml. This cut-off value was established according to the guidelines of the Italian Association of Clinical Microbiology (AMCLI). Analogous-ly for the BiesseBioscreen screening, samples
were considered positive if exceeding 100,000 bacteria/ml.
We calculated the Sensitivity (Se) of the Biesse-Bioscreen as the proportion of urine specimens contaminated by microorganism in which the test result is positive; and the specificity (Sp) as the proportion of specimens without microor-ganism contamination in which the test result is negative.
We also calculated the likelihood ratio (LR). A positive LR (LR+) indicates how many times a positive result is more likely to be observed in specimens contaminated by microorganisms than in those without contamination. A negative LR (LR-) indicates how many times a negative result is more likely to be observed in specimens contaminated by microorganisms than in those without contamination. The more LR differs from 1, the more accurate the test is. LR above 10 and LR below 0.1 were considered convinc-ing diagnostic evidence (Jaeschke et al., 1994). The diagnostic odds ratio (DOR), defined as the ratio of the odds of positive test results in specimens with microorganism contamination relative to the odds of positive test results in specimens without microorganism contami-nation, was also calculated (Glas et al., 2003). The DOR does not depend on prevalence and its value ranges from 0 to infinity, with high-er values indicating betthigh-er discriminatory test performance. The positive predicted value (PPV) represents the proportion of test-positive specimens that truly present the contaminated specimens, while the negative predicted value (NPV) represents the proportion of test-nega-tive specimens that truly do not present the mi-croorganism contaminations.
RESULTS
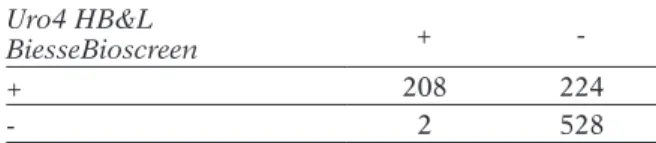
A total of 962 urine samples were analysed us-ing both HB&L-Uro4 system and BiesseBio-screen. 528 samples (54.9%) were classified by BiesseBioscreen as culture negative and 208 (21.6%) as culture positive. In comparing HB&L-Uro4 and BiesseBioscreen values, each sample was classified as follows: true-positive/ negative if positive/negative for both; false-posi-tive if posifalse-posi-tive for BiesseBioscreen but negafalse-posi-tive for HB&L-Uro4; false-negative if negative for
BiesseBioscreen but positive for HB&L-Uro4. According to the criteria described above, 224 (23.3%) specimens of the total were false posi-tive and 2 (0.2%) false negaposi-tive. The results are reported in table 1.
Furthermore the results were analysed con-sidering separately the values obtained from the samples measured in the first and second batches (Table 2a, b). The values reported in ta-ble 2b, where the results were improved using isotonic solution, show that BiesseBioscreen can be used as a screening system, reducing the number of urine culture tests of a 61%, since culture should be performed only on the 185 BiesseBioscreen positive values.
Hence from these results we find consisten-cy between BiesseBioscreen and culture test, therefore 1 of the 2 false negatives should not be considered a false but true negative. In this case, it is plausible that the HB&L-Uro4 gave a wrong result (Cermàk et al., 2009).
The data analysis performed to evaluate Biesse-Bioscreen was done calculating sensitivity, specificity, LR+, LR-, DOR, positive predicted value (PPV), negative predicted value (NPV), false negative rate (FNR), and false positive rate (FPR) according to European Committee
TABLE 1 - Comparison of BiesseBioscreen urine screening results according to TV standard method
(HB&L-Uro4 system). Uro4 HB&L
BiesseBioscreen +
-+ 208 224
- 2 528
TABLE 2 a, b - Comparison of BiesseBioscreen urine screening results according to HB&L-Uro4 results
(the standard diagnosing for urine culture), for samples analyzed in the first (a) and second (b) run. a Uro4 HB&L BiesseBioscreen + -+ 108 139 - 1 233 b Uro4 HB&L BiesseBioscreen + -+ 100 85 - 1 295
on Antimicrobial Susceptibility Testing (www. EUCAST.org/document/sops).
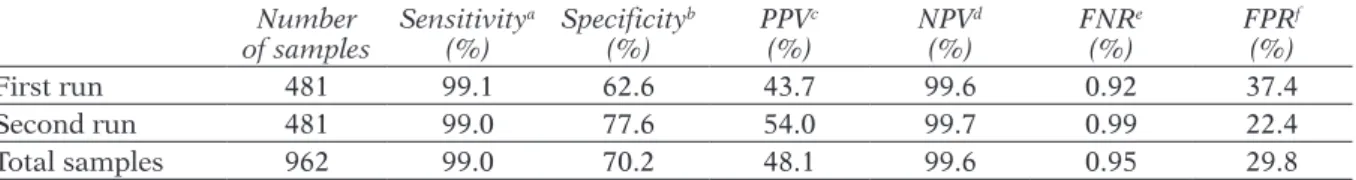
Tables 3 and 4 reports these values considering totally and separately the first and second runs. Data analysis of BiesseBioscreen performance in bacteria screening showed very good test-ing results. FPR, defined as false positives over the sum of (false positive + true negative), de-creased from 37.4% to 22.4% in the second experiment since the number of false positive samples was strongly reduced from 139 to 85 samples, that is less than 15.0%. This reduction can be ascribed to a more accurate protocol in view of the fact that the use of isotonic solution yields a reduction in blank counts, reflecting a more accurate measure. For the same rea-son the PPV, defined as the true positives over the sum of (true positive + false positive), was strongly enhanced from 43.7% to 54.0%, while NPV, defined as the true negatives over the sum of (true-negative + false-negative), results were very high in all cases. NPV was close to unity in both tests as the false negative sam-ples were very few (2 cases) in comparison to the true negative samples (528). FNR defined as false negative over the sum of (real positive
+ false negative), was under 1.0 % in all cases. Sensitivity values were very close to 100%, due to only 2 false negatives, and specificity around 70% with the very high NPV indicating that the method is suitable for identifying negative samples. Analogously the LR results reported in table 4 gave values lower than 0.1 meaning a test excellence in detecting negative samples. On the other hand, the LR+ values obtained between 2 and 5 reveals a lower reliability in diagnosing positive samples, but this is in line with the target of BiesseBioscreen as a method for screening negative samples.
From these results we can conclude that Biesse-Bioscreen performance in bacteria screening is reliable and equivalent to standard methods. The different results between the first and sec-ond batches can be ascribed to the different measurement protocol. Indeed in the second run, two different preparations were made for each sample to minimize the blank counts. Iso-tonic solution (sodium chloride 0.9%) or bidis-tilled water was used as blank solution and the results compared (data not shown). The isoton-ic solution resulted the best choisoton-ice having the lower blank counts, for this reason, only the re-sults with isotonic solution have been reported for the second run (Table 2b). These differences in protocol resulted in improved specificity in the second run, demonstrating that the isotonic solution is the best solvent to use.
DISCUSSION
In the past two decades several instru-ment-based methods have been developed for the detection and identification of microor-ganisms. Most have been focused primarily on
TABLE 3 - Performance of BiesseBioscreen method for bacteriuria screening compared to standard methods in detecting clinically relevant urine infections, considering totally and separately the samples of the first
and the second runs. Number of samples Sensitivity a (%) Specificity b (%) PPV c (%) NPV d (%) FNR e (%) FPR f (%) First run 481 99.1 62.6 43.7 99.6 0.92 37.4 Second run 481 99.0 77.6 54.0 99.7 0.99 22.4 Total samples 962 99.0 70.2 48.1 99.6 0.95 29.8
aSensitivity = number of true positives/(number of true positives + number of false negatives). bSpecificity = number of true
negatives/(num-ber of false positives + numnegatives/(num-ber of true negatives). cPPV= positive predicted value. dNPV= negative predicted value. eFNR= false negative rate. fFPR= false positive rate.
TABLE 4 - Likelihood ratio considering totally and separately the samples of the first
and the second runs. Number of samples LR+ a LR-b DORc First run 481 2.652 0.0146 181.644 Second run 481 4.426 0.0128 345.781 Total samples 962 3.325 0.0136 244.485
aLV+= positive likelihood ratio. bLV- = negative likelihood ratio. cDOR = diagnostic odd ratio.
automated and faster systems. However these systems are generally expensive, time-consum-ing and require a dedicated laboratory area and skilled personnel. The BiesseBioscreen method would have a user-friendly interface and could be easily integrated in small labo-ratories, with a measuring time of less than 10 minutes, much lower than the time needed for a culture response or even for an HB&L re-sult. In the present study the BiesseBioscreen system, compared to the standard method, demonstrated the equivalence of this system versus the traditional approach.
We compared a new way for measuring urine culture to a standard methodology already approved in microbiology. Indeed the HB&L-Uro4 system has been extensively studied in the last 20 years in several publications (Milagro A., 1999; Roveta S., et al., 2004; Roveta S., et al., 2006; Fontana C. et al., 2009; Cermàk P. et al., 2009; Barocci S. et al., 2010; Fortina G., 2009; Kroumova V. et al., 2010; Ilki A., 2010; Tessari
et al., 2010) finding the HB&L-Uro4 a reliable
system for routine use in laboratories giving microbial growth results in 3 hours. As we pro-pose BiesseBioscreen as a screening method to reduce the number of samples to be further in-vestigated with plate culture in a microbiology laboratory, we decided to refer as standard to the HB&L-Uro4 method. Indeed for our aim, we consider HB&L-Uro4 an acceptable refer-ence system.
The comparison between the diagnostic test and the reference standard has been represented in 2x2 contingency tables. Common indicators of test performance derived from such 2x2 tables are: the sensitivity of the test, its specificity, the positive and negative predicted values, and the positive and negative likelihood ratio (Sackett D.L. et al., 1991). Overall the BiesseBioscreen system showed an excellent diagnostic accu-racy, compared with the standard HB&L-Uro4 analysis, in terms of all statistical parameters. The high sensitivity and the high NPV obtained demonstrate that BiesseBioscreen analysis can be used to identify negative samples, which do not need further culture testing. In particular the 45% of positive samples obtained with this methodology implies that 530/962 (55%) sam-ples could be excluded from urine culture af-ter BiesseBioscreen analysis. This reduction of
avoidable urine culture sample examinations could lead to a decrease of laboratory analysis costs. Furthermore the short time (less than ten minutes) needed to identify a negative sample could save on workload and unnecessary anti-biotic therapy.
Moreover, to explore the possibility to improve the statistical performance of BiesseBioscreen, we reinvestigated the false negatives belonging to the second batch of measurements. Initially the BiesseBioscreen value was 35,000 bacteria/ ml while the HB&L-Uro4 result was 150,000 CFU/ml. This sample (stored at 4°C and added with boric acid as preservative) was also re-mea-sured after 3 days with BiesseBioscreen giving 30,000 bacteria/ml, a negative value consistent with the previous measurement. Moreover for this sample the BiesseBioscreen result was also compared with the traditional quantitative cul-ture test result performed by the microbiology laboratory to identify the isolated pathogens. The culture result was negative: 20,000 CFU/ ml, a contrasting value with HB&L-Uro4 result. Nevertheless this sample was classified as posi-tive because the microbiology laboratory of the hospital in case of contrasting results, consid-ers the higher value more reliable.
In conclusion the BiesseBioscreen results are comparable to the standard methodology. The higher negative predicted value NPV (99.6%) and the lower false-negative rate FNR (0.95%) obtained make the method suitable as a screen-ing system, improvscreen-ing the turnaround time, workload and reducing the costs of urine cul-ture.
ACKNOWLEDGEMENTS
The University of Illinois is the owner of patent N: US 2009/0230324 A1. Dr. Guido Motolese is the owner of the company ASI that has a licen-ce agreement with the University of Illinois. All other authors declare no conflict of interest. Par-tial funds for this research for EG were provide by NIH grant GM103540.
REFERENCES
ballabio c.,VeNturi N., roberta Sala M., Mocarelli P., braMbilla P. (2010). Evaluation of an automat-ed method for urinculture screening. Microbiolo-gia Medica. 25, 178-180.
barocci S., giacoMiNi M., reNzi a., PalMa M., latiNi l., QuagliariNi l., Migali a. (2010). HB&L Sy-stem: rapid determination of antibiotic sensi-tivity of bacteria isolated from blood cultures. Microbiologia Medica. 25, 60-63.
berlaNd K.M., So P.t., grattoN e. (1995). Two pho-ton fluorescence correlation spectroscopy: meth-od and application to the intracellular environ-ment. Biophys. J. 68, 694-701.
brilha S., ProeNça h., criStiNo J.M., häNScheid t. (2010). Use of flow cytometry (Sysmex) UF-100 to screen for positive urine cultures: in search for the ideal cut-off. Clin. Chem. Lab. Med. 48, 289-292.
broereM M.a., bahçeci S., Vader h.l., areNtS N.l. (2011). Screening for urinary tract infection with the Sysmex UF-1000i urine flow cytometer. J. Clin. Microbiol. 49, 1025-1029.
cerMàK P., PtàKoVà M., Kubele J., cerMàKoVà r., JedlicKoVà a. (2009). Detection of urinary tract infection using Uro-Quick system and quantita-tive dilution method. Klin. Mikrobiol. Infekc. Lek. 15, 166-170.
cheN Y, Müller Jd, So Pt, grattoN e. (1999 a). The photon counting histogram in fluorescence fluc-tuation spectroscopy. Biophys. J. 77, 553-567. cheN Y., Muller J.d., berlaNd K.M., grattoN e.
(1999 b). Fluorescence fluctuation spectroscopy. Methods. 19, 234-252.
digMaN M.a., dalal r., horwitz a.F., grattoN e. (2008). Mapping the number of molecules and brightness in the laser scanning microscope. Bio-phys. J. 94, 2320-2332.
duda r.o., hart P.e., StorK d.g. (2001). Pattern recognition system. in pattern classification, wi-ley-interscience. 9-13.
FoNtaNa c., FaVaro M., MiNelli S., boSSa M.c., altieri a., FaValli c. (2009). A novel culturing system for fluid samples. Med. Sci. Monit. 15, 55-60.
FortiNa g. (2010). Preliminary indications for anti-biotic susceptibility tests in less than six hour in positive blood cultures. Microbiologia Medica. 25, 24-26.
glaS a.S., liJMer J.g., PriNS M.h., boNSel g.J., boSSuYt P.M. (2003). The diagnostic odds ratio: a single indicator of test performance. J. Clin. Epi-demiol. 56, 1129-1135.
ilKi a., beKdeMir P, ulger N, SoYletir g. (2010). Rap-id reporting of urine culture results: impact of the
uro-quick screening system. New Microbiol. 33, 147-153.
JaeSchKe r., guYatt g.h., SacKett d.l. (1994). User’s guide to the medical literature III. How to use an article about a diagnostic test. B. What are the results and will they help me in caring for my patients? The Evidence-Based Medicine Working Group. JAMA. 271, 703-707.
JolKKoNeN S., PaattiNieMi e.l., KärPäNoJa P., SarKKiN -eN h. (2010). Screening of urine samples by flow cytometry reduces the need for culture. J. Clin. Microbiol. 48, 3117-3121.
KrouMoVa V., gobbato e., MacaluSo P., taMburelli S., MariNi F., PeroNe M., orlaNdi S., ViViaNi M., For -tiNa g. (2010). Preliminary indications for antibi-otic susceptibility tests in less than six hours in positive blood cultures. Microbiologia Medica. 25. Magde d., elSoN e.l., webb w.w. (1974). Fluores-cence correlation spectroscopy II. An experimen-tal realization. Biopolymers. 13, 29-61.
Milagro a., MoleS b., SeoaNe a., NaVaScueS J., blaS -co M., garcia-MoYa J.b. (1999). UTIscreen versus UROQUICK: two semiautomatic systems for bac-teriuria detection. Enferm. Infec. Microbiol. Clin. 17, 398-400.
Peleg, a.Y., d.c. hooPer. (2010). Hospital-acquired infections due to gram-negative bacteria. N. Engl. J. Med. 362, 1804-1813.
roVeta S., MarcheSe a., debbie e.a. (2004). Evalu-ation of the Uro-Quick, a new rapid automated system, for the detection of well-characterized antibiotic-resistant bacteria. J. Chemother. 16, 107-118.
roVeta S., MarcheSe a., debbia e.a. (2006). Antibi-otic susceptibility tests directly on urine samples using Uro-Quick, a rapid automated system. J. Chemother. 18, 12-19.
SacKett d.l., haYNeS r.b., guYatt g.h., tugwell P. (1991). Clinical epidemiology: a basic science for clinical medicine. Boston: Little, Brown and Co. StaMM, w e., hootoN t.M. (1993). Management of
urinary tract infections in adult. N. Engl. J. Med. 329, 1328-1334.
teSSari a., SQuarzoN l., caVallaro a., PariSi S.g., cruciaNi M., Palù g. (2010). Evaluation of the Uro4 HB&L system for the rapid diagnosis of lower respiratory tract infections in intensive care units. Journal of Microbiological Methods. 81, 235-239.