Università Cattolica del Sacro Cuore
ISTITUTO DI POLITICA ECONOMICA
VITA E PENSIERO
Market’s SINS
and the European Welfare State:
theory and empirical evidences
Luigi Campiglio
Quaderno n. 60/settembre 2012
ISBN 978-88-343-2323-6 COP Campiglio 60.qxd:_ 17/09/12 08:44 Page 1
Università Cattolica del Sacro Cuore
ISTITUTO DI POLITICA ECONOMICA
Market’s SINS
and the European Welfare State:
theory and empirical evidences
Luigi Campiglio
Quaderno n. 60/settembre 2012
Luigi Campiglio, Istituto di Politica Economica, Università Cattolica del Sacro Cuore, Milano
I quaderni possono essere richiesti a:
Istituto di Politica Economica, Università Cattolica del Sacro Cuore Largo Gemelli 1 – 20123 Milano – Tel. 02-7234.2921
www.vitaepensiero.it
All rights reserved. Photocopies for personal use of the reader, not exceeding 15% of each volume, may be made under the payment of a copying fee to the SIAE, in accordance with the provisions of the law n. 633 of 22 april 1941 (art. 68, par. 4 and 5). Reproductions which are not intended for personal use may be only made with the written permission of CLEARedi, Centro Licenze e Autorizzazioni per le Riproduzioni Editoriali, Corso di Porta Romana 108, 20122 Milano, e-mail: [email protected], web site www.clearedi.org.
Le fotocopie per uso personale del lettore possono essere effettuate nei limiti del 15% di ciascun volume dietro pagamento alla SIAE del compenso previsto dall’art. 68, commi 4 e 5, della legge 22 aprile 1941 n. 633.
Le fotocopie effettuate per finalità di carattere professionale, economico o commerciale o comunque per uso diverso da quello personale possono essere effettuate a seguito di specifica autorizzazione rilasciata da CLEARedi, Centro Licenze e Autorizzazioni per le Riproduzioni Editoriali, Corso di Porta Romana 108, 20122 Milano, e-mail: [email protected] e sito web www.clearedi.org
© 2012 Luigi Campiglio ISBN 978-88-343-2323-6
Abstract
We analyze the European Welfare State according to a theoretical framawork based on four main social goals – stability, inequality, need, safety (SINS) – which the market mechanism fail to achieve: they are the market’s SINS. We propose a theoretical framework which is based on the distinction between “private goods”, which are the domain of the market, and “common goods”, which are the the domain of the Welfare State and the other lower layers of social institutions. The main result is that a high level of social protection benefits, properly allocated to these goals, can be effective for achieving economic goals, because it allows to amend market’s shortcoming for SINS, while allowing the flexibility for complying with the public budget constraint, given the positive relationship between GDP per-capita and the share of social protection benefits. A cross-section analysis shows that the goals of SINS are better achieved when the social protection benefit focuses on the func-tions of family and children and sickness and health care, because they are the most poverty reduction: they allow to better achieve the goal of reducing inequality and providing families needs. We show that for the families with children the better working ar-rangement – which is associated with higher GDP per-capita and lower inequality – is one parent working full time and one parent part-time. We explain the cross-section variability for the functions of pensions, housing and social exclusions in relationship with the goals of stability and and safety. We analysis a sample of seven major European countries for the period 1995-2009, focusing on the goal of economic stability and the degree of procyciclical or countercyclical relationship between social protection expenditures and GDP per-capita. A number of econometric and numerical re-sults are derived: countries with better economic performances can have both procyclical and countercyclical behavior, but they have in common higher value of social protection benefits on the onset of the cyclical downturn or recession: the flexibility for budget ad-justment come from the political leeway of the high starting value of social protection and the higher share of in-kind benefits. The
GDP per-capita in the year 2000 is a good predictor of the average primary balances for the European countries over the decade. JEL: H34, H53, H62, I38
Key words: Welfare State, household income, poverty reduction, economic recession, government budget
5
Introduction∗
We argue that Welfare State is a necessary condition for economic development because it can amend the market mechanism for its shortcomings: in this paper we focus mainly on the issues of eco-nomic Stability, the consequences of extreme Inequality, the miss-ing care for citizens’ basic Needs, the lack of a Safety net and, notably, of food Security. These issues, which can be aptly named with the acronym SINS, address social goals that the market me-chanism cannot cope with the price system as instrument, because they are not “private goods”, but rather “common goods”. The Eu-ropean Welfare State has evolved, during the XX century, as a so-cial response to the market’s SINS, espeso-cially since the Great De-pression, and other developed countries, like the United States, are following suit, while big emerged countries, like China, start to struggle with the same problems. The evolution of the European Welfare State in a big chunk of the GDP has created new problems for the decision processes of the policy maker, prompting new lay-ers of decision, while valuing the central role of institutions like the family and self-organized entities with social purposes. Most of the Welfare benefits should be entitlements rather than the outcome of political choice and political centralization should give way to a “grass root” decentralization, especially focusing families and children, and subsidiarity: because people “know better” and can provide the right incentives to the providers. The motivation for this paper is to suggest the framework of a theory which, taking stock of the European experience, can provide empirical evidences to support it. We propose a model where total household consump-tion is made up of private consumpconsump-tion and social consumpconsump-tion: private consumption is a function of disposable income, which
∗ I thank Francesca Tartamella for her careful comments on the content
of the paper, its methodology and coherence: another layer of gratitude I owe her. I want also to thank Marta Spreafico in helping me to carry out the regressions in spite of her mind being happily turned to another side. The usual disclaimer applies and the views expressed are only mine.
cludes public income benefits, while social consumption is a func-tion of GDP per-capita and the political process entailed by the economic growth. The size of the Welfare State derives from the demand of “common goods” to amend market’s SINS, given the stage of economic growth and the constrain of the public budget. The allocation of the available resources depends on the political process and is crucial for its efficiency, measured in term of pover-ty and inequalipover-ty reduction. We measure stabilipover-ty, and uncertainpover-ty reduction, with the pattern of countercyclical or procyclical beha-vior for a selection of 7 major European countries, relating it to dynamic of total and private government balances and showing the relevance of in-kind transfers in providing discretionary spending over the business cycle or recession.
1. Welfare State and market’s SINS
The modern Welfare State is an evolving institution, prompted by missing market and market shortcomings and shaped by continous economic and technical changes, which require the support of mar-ket’s SINS amendments. We better define SINS:
a) Stability is central to the process of economic growth, as we harshly learnt during the Great Depression and we experience since the onset of the Great Recession in 2007. Serious lack of stability produce uncertainty, in the Keynesian (or some would suggest Knightian) sense: as Keynes put it there is no scientific basis to measure the probability of the “prospect of a European war … or the price of copper and the rate of interest twenty years hence” (Keynes, 1937). We suggest however that also a different kind of uncertainty is relevant, namely the impossibil-ity of thinking to all the states of the world, which make un-thinkable states the origin of a structural uncertainty, because everyone cannot even think of it. To be concrete, Greek crisis is the origin of Euro crisis because it made thinkable the un-thinkable, starting the betting game on Euro break-up. When faced with the fear of these two kind of uncertainty households
reduce their spending and firms postpone their investments. We can try to detect whether the Welfare State sustains eco-nomic Stability looking to the counter-cyclical pattern of social spending: unemployment insurance is a case in point, together with the level of family income and the presence of one or two income earners.
b) Inequality, if becomes too high or extreme, can be the cause of poverty and hardship for families with low purchasing power and economic crisis for firms with oversupply of production. In the US the underlying force driving extreme inequality was the skyrocketing rewards to the people working in the financial sector, with a sharp increase in risk and uncertainty, but with-out an adequate safety net (Rajan, 2010). The Great Recession stems from different causes in comparison with the Great De-pression, but the two crisis share a peak of extreme inequality as a common onset. A well-crafted Welfare State can therefore speed-up the escape from the crisis by reducing poverty and the imbalances between supply and demand and some Euro-pean countries seem to achieve just that.
c) Needs are the basic incentive for labor supply and a well-functioning family is the only institution where – oddly – the marxist dictum “from each according to his ability, to each ac-cording to his needs” (Marx, 1875) can seemingly work. The family can solve the trade-off between equity and efficiency or, to put it in a different social perspective, family merits and needs, because in a well-functioning family merits and needs coexist and family income is shared according to the needs (Campiglio, 2011): the fundamental reason was neatly pointed out by Ken Arrow (1951), arguing that households’ decision process could be thought as the elementary social choice, pro-ducing rational decisions when based on “common standards of value”, which is also the basis of a well-functioning family. The complementarity of merits and needs within the family is evident in the case of the children, who do not contribute to the family income but receive resources accordind to their needs. When the family income is low or inadequate, the contribution
of the Welfare State becomes crucial and responsability be-comes the link between Welfare and fairness (Fleurbaey, 2008): children should be recognized as a “commons”, being rivalrous (their parents take care of them) but generating non-excludable benefits to all the society. The issue of children, as future citizens without voice in modern democracies, is behind the question “Who’s minding the Kids?” (Curie, 2006), which John Stuart Mill already answered in 1859.1 The problem is that in modern democracies children do not have a real politi-cal weight, because of the unspoken politipoliti-cal rule “no-voice-no-representation”: recent economic literature proves that giv-ing “voice” to the minorites can change the resource allocation, and still more profound transformations have been carried for-ward in women life since their franchise, as it could happen with the children, future citizens (Campiglio, 2005, 2009). d) Safety and Security cover a wide range of economic and social
issues, which the market mechanism cannot address. Firstly, the lack of Safety and Security reminds how tight is the rela-tionship between crime and deviance, well functioning social organization and institutions, well-being and economic devel-opment2. An efficient Welfare State can provide care and pre-vention, supporting families and the communities, improving welfare and reducing the huge social and economic cost of crime and social deviance. On the economic side, the market mechanism cannot cope, as it would be necessary, with the problems of extreme poverty and the deep social consequences of the lack of economic Safety and Security. Perhaps this is
1
John Stuart Mill writes that “Rulers and ruling classes are under a neces-sity of considering the interests and wishes of those who have the suf-frage; but of those who are excluded, it is in their option whether they will do so or not; and however honestly disposed, they are in general too fully occupied with things which they must attend to, to have much room in their thoughts for anything which they can with impunity disregard”. (ital-ics in the original).
2
The Routledge Handbook of Deviant Behavior (2011), edited by Clifton Bryant.
why in the U.S., instead of talking about Welfare State, it is preferred the term Safety net, which captures better the idea that the State should protect people against bad luck or adverse economic shocks. However the Safety net in the U.S. has proved to be a weak protection in face of a sharp and lasting increase of long-term unemployment, the highest recorded since World War II (Rajan, 2010). While health care insurance is easily spotted as the weak link in the U.S. Safety net, there are social programs which should be considered in European Welfare sistem: the Earned Tax Income Credit (EITC) is the program with the largest antipoverty effect3 while the Sup-plementary Nutrition Assistance Program (SNAP) is also criti-cal because half of all SNAP participants were children and both participation and expenditures are strongly countercyclic-al (participants receive their benefits on electronic benefit transfer cards that can be used only to purchase food).4 It is in fact impressing to record 44,7 millions participants to the SNAP in 2011, while they were 28,2 millions in 2008: in 2010 the average household received monthly benefits worth $ 287. Amendments of market shortcomings cover a wide spectrum of programs, in Europe as well as in the U.S., and the Welfare State is an integral part of the fiscal policy, which can help to absorb the adverse consequences of major economic shocks, as the Great Re-cession. The effectivness of amending market’s SINS depends cru-cially on the timing and the extent of its countercyclical impact.
2. The States of the European Welfare: patterns and empirical evidences
The Welfare State is widespread in all the European countries and in this section we try to explain the reasons of its growing share of the GDP and ask whether there are limits or constraint to its
3
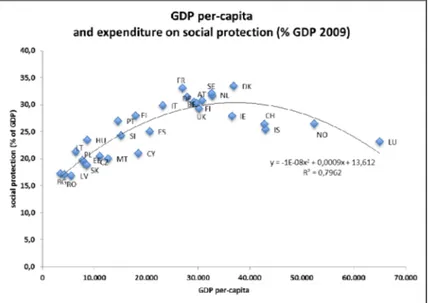
crease. We can consider the Welfare State benefits as a social con-sumption to be added to the private concon-sumption of each house-hold, even if in varying proportions: market provide for private goods while the Welfare State, or the Safety Net, provide for the “common goods”, the market’s SINS which the market mechanism is unable to deliver. While household private consumption is a function of disposable income (net of taxes and including govern-ment benefits) and the aggregate private consumption function re-sults as the amalgama of all the households, for the social con-sumption the opposite holds. The Welfare State starts with an ag-gregate (social welfare) function relating social consumption with GDP per-capita, on which tax receipts depend: the crucial differ-ence with private consumption is that the social consumption for each household is the result of a political decision, concerning the level of public expenditures, their allocation by functions and the eligibility criteria which household have to comply with for access-ing the available resources. We assume that the policy-maker de-cides5, on the basis of citizens’ preferences and their political ap-proval, how and which resources households are entitled to access, while respecting a “tight” or “soft” budget constraint, because the Government can borrow more easily than the households. Con-sumption per-capita and economic growth are related by a simulta-neous and self-reinforcing mechanism which slows down as the variety of private and social needs are saturated. Therefore the first relationship we investigate is between GDP per-capita and social expenditures6 . If we consider, for a large sample of European countries, the relationship between the level of GDP per-capita and the share of social protection expenditures7 (as measured by
5
We could assume a decision process related to a median voter (Meltzer and Richard, 1981).
6
There is a vast literature on the determinant of government size, of which Social protecion expenditures are part of: Mueller provides an ex-tensive review (see Muller (2003)).
7
In the paper we use ther terms “expenditures and benefits” interchange-bility: we point that all the empirical evidences is based on social protec-tion benefits, because expenditures include salso administrative costs.
tat) in 2009 a well-defined quadratic pattern arises (figure 1): in 2009, year of a heavy drop of the GDP, Denmark and France rec-orded the highest share of social protection expenditures with re-spect to the GDP (33%).
Figure 1 - GDP per-capita and Social Protection Expenditures
Source: Author’s calculation on Eurostat
However good the fitting, the relationship should be considered with caution, because it suggests a clear answer to the question about the existence of a maximum value of expenditures for the Welfare State, which relies however on too few small countries. We do not have a reliable comparison with the U.S., but if we try to add the available data, to figure out a reliable estimate, we record that even if public social spending is lower than in Europe,
in the U.S. is, in fact, around half the share of the Netherland, a country with almost the same level of real GDP per-capita in 2009: however one has to note that in 2011 the U.S. Federal Outlays for Health, Medicare, Income Security, Social Security represented about the 14,5% of the GDP, up from the 4,2% in 1966 (figure 2).
Figure 2 - U.S. Federal Social Expenditures
Source: Author’s calculation from “the Economic Report of the President 2012”, table B-1, B-80
It is a slow but steady increase which could bring the U.S. public spending closer and closer to the European levels in 10 to 20 years. It has been suggested that a better comparison between Europe and the U.S. should take into account also the employer-provided bene-fits, like health insurance and pension, increasing substantially the share of social expenditures at a level comparable with the
Euro-pean countries (Garfinkel, Rainwater and Smeedings, 2010): per-haps this comparison is a bit stretched, but we can take this indica-tion as suggestive of the underlying forces behind the growing Welfare State.
A prominent theoretical and empirical interpretation suggests that the increase of welfare spending is a form of social insurance against economic shocks and the uncertainty coming from the world market, which is proxied by the degree of openess of the economies and the terms of trade (Rodrik, 1998). This interpreta-tion fits clearly with the market’s SINS framework, however the relationship between openess and the social protection expendi-tures, while holding for the past, becomes weaker for the 2000’s decade in Europe. We suggest that the pattern of new relationships between European countries – an halfway economic and political union – has also changed the relationship between openess, as a measure of uncertainty, and the demand for social protection. The tighter external constraint coming from a higher openess has been coupled, if not supplanted, by a “thight” or “soft” constraint on the public budget deficit.
Therefore, we averaged over the decade the total public expendi-ture, the social protection and the primary balance deficit or sur-plus, as a share of the (averaged) GDP for all the European coun-tries for which we could find comparable data (Eurostat is our main source). The social protection expenditures shows a close re-lationship with the total general government expenditures (figure 3): the relationship should not be considered as obvious, because social benefits are funded simultaneoulsy by the social contribution and general government contribution. In 2009 social contributions, more sensitive to economic fluctuations, represented 60,1% of the total receipts for the EA-17, with a significant balancing (or throwing off balance) role by the government contributions (39,9%): the share of government contributions varies significantly across European countries, and therefore the question arises whether the public budget constraint have an influence on the so-cial protection expenditures.
Figure 3 - Social protection expenditures and total general
government expenditures
Source: Author’s calculation from Eurostat database
Indeed, the public budget constraint shows up in a positive rela-tionship between the average primary balance and social protection expenditures: this means that, to some extent, the primary public budget balance constraint (net of of interests) is (soflty) binding with respect to social protection expenditures (the sample is made of 28 European countries, excluding Norway, a clear outlier for many variables) (figure 4). As expected, there is a close relation-ship between primary and total government balance, which shows that primary balance is, indeed, a major goal by the economic poli-cy, and therefore a constraint on the government and social protec-tion expenditures (figure 5): both cross-secprotec-tion relaprotec-tionships are however weak and we postpone to section 4 a more detailed time – series analysis on a sample of major countries.
Figure 4 - Primary Balance and Social protection expenditure
Source: Author’s calculation from Eurostat dataset
We ask the question wether the primary balance is related to the GDP per-capita, which, as we have shown, is a main economic va-riable which explains the social protection expenditure: we show that the GDP per-capita in 2000 has a good predicting power on the average primary balance in the following decade, which implicitly also underlines the crucial role of economic growth in relaxing the primary balance constraint on the social protection expenditures (figure 6). This kind of relationship is however thorny because it implies a degree of self-reinforcing dynamic and therefore the need of a structural change in the pattern of social expenditures to modi-fy a negative trajectory, i.e. a public deficit.
Figure 5 - Total and primary general government balance
Source: Author’s calculation from Eurostat dataset
Figure 6 - Primary balance (average 2000-2009) and real GDP
per capita in 2000
3. Coping with market’s SINS: a cross-section analysis
While the primary budget constraint puts a lid on the level of ag-gregate social consumption, the distribution of the resources avail-able between the specific functions mirrors the efficiency in coping with the main goals of the Welfare State, namely market’s SINS, therefore promoting Stability of disposable income, reducing In-equality, taking care of basic Needs, providing Safety and Security. According to the Eurostat statistical classification, the main func-tions are conventionally grouped in the following areas: old-age and survivors, sickness/health care, disability, family/children, un-employment, housing and social exclusion. To analyze the effi-ciency of welfare spending, taking SINS as major goals, we can consider each function in relation with each goal, searching for possible relationships.
With regard to pensions, we find, as reasonably expected, that a crude measure of demography - people 65 and over - explains 40% of the variability in Old-Age and Survivors benefits as a share of GDP in 2009 (45% if we consider only Old-Age): Ireland has the lowest share of population aged 65 and over, and correspondingly the lowest social protection expenditure as a share of GDP (figure 7). In Italy the share of population over 65 is almost three times higher than Irland and the share of GDP for expenditures on Old-Age and Survivors is almost two times higher. We should note that pensions are parts of the resources available to the “generational chain”, defined as the small community of 7-8 persons, made up of grandparents, parents and grandchildren which share a common pool of money and time resources. The relationship between pensions and consumption smoothing and Stability over the life-cycle is confirmed for the individuals, and we suggest also the ge-neratonal chain.
Sickness and health care – the other major expenditure function - is, for the most part, a transfer in-kind, where the expenditures are mainly related with hospitals and drug costs with a direct relation-ship with the goals of Need and Safety: as we show below, the
function of “sickness and health care” has a significant impact on poverty reduction.
Figure 7 - Social expenditure for Old-Age and Survivor and
popu-lation over 65
Source: Author’s calculations from Eurostat database
The functions of housing and social exclusion can be related to some exogenous measure of social disorder like the crime rate or the rate of people in prison and the goals of Safety and Security. The crime rate is measured as the number of criminal offences re-ported to the police, per 100 of population: despite the well-known problem of underreporting associated with this measure, we see a positive relationship between the crime rate and the share public spending for housing and social exclusion (figure 8). Higher crime rates call for a higher of expenditures for housing and social
exclu-sion and we could reasonably say that Sweden and UK spend more because the crime rate is higher. Over the last decade we record a sharp increase of violent crimes, (for which underreporting is a mi-nor problem), in Sweden, England (with an impressive absolute number) and Wales, France, Italy, Netherland.
Figure 8 - Crime rate and social exclusion expenditures
Source: Author’s calculation on Eurostat database
Drug trafficking is the other crime, surely underreported, for which the number of offences has increased the most in Netherland, Swe-den, England and Wales, while in Italy the number of offences is stable, but still the highest after Germany, where it is however de-creasing. Increasing crime has entailed an increase of prisoners (the correlation between crime rates and imprisonment rate is weak, but
the existence of a possible non-linear relationship between social expenditure for housing and social exclusion, which – if confirmed – could be exploited to reduce crime (figure 9). The issue of crime increase begins to be carefully analyzed for its wide social and economic implications, exploring the role of demography, unem-ployment, immigration, incarceration and abortion (Buonanno at al. 2010).
Poverty reduction is a major welfare goal, related to Inequality and Needs, and the efficiency of welfare expenditure can be measured, comparing ante poverty rates, before the social protection ex-penditures, with ex-post poverty rates, after the social protection expenditures: taking the difference (before – after) as a dependent variable, we ask the question of which social expenditure function is most effective in poverty reduction (the poverty threshold is cal-culated in each country as 60% of median disposable income).
Figure 9 - Social expenditure for housing and social exclusion and
prison population
Social expenditures for family/children arises as the function with the biggest impact on poverty reduction (figure 10): in fact if we can show a clear negative relationship between the percentage of families of 2 adults and 2 children at-risk-of-poverty and the social public expenditures for the function family/children as a percen-tage of the in GDP in 2009 (figure 11 - we exclude Luxembourg as a large outlier). To expand the explanation power of this relation-ship we run a stepwise regression (table 1) between the poverty re-duction (before – after) and the percentage of social expenditures for the function of family and children (with respect to GDP) add-ing the function of sickness/health care: the result is significant for both variables while the cross-section variability explained corres-ponds to an R2 (adj) of 0,556 (we note that also the function of disability show a high correlation).
Figure 11 - Family of 2 adults and 2 children at risk of poverty
and family/children benefits
Source: Author’s calculation from Eurostat database
We can therefore conclude that family and health care public ex-penditures (and also disability, to a lighter extent) appear to be the most efficient social expenditures, in the sense of their being the more effective in poverty reduction.
A wider scope for the Welfare State regards the Inequality arising from the presence of one or two earners in families with children, which calls for horizontal equity in fiscal policy and a higher de-mand for labor with good wages. We already know that a higher share of social expenditure is associated with higher GDP per-capita (figure 1) and, at same time, we can show a strong positive relationship between the GDP per-capita and the share of families with one parent full-time and one parent part-time (figure 12).
Table 1 - OLS regression
dependent variable: poverty reduction (before – after)
indipendet variables: family/children and sickness/health care
. sw reg beforeminusafter familychildren health, pr (0.05)
begin with full model p < 0.0500 for all terms in model
Source | SS df MS Number of obs = 29 ---+--- F( 2, 26) = 18.54 Model | .032 2 .016 Prob > F = 0.000 Residual | .022 26 .000 R-squared = 0.587 ---+--- Adj R-squared = 0.556 Total | .055 28 .001 Root MSE = .0296 ---beforeminu~c | Coef. Std.Err. t P>|t| [95% Conf.Interval]
---+---familychil~c | 3.048 .649 4.69 0.000 1.713 4.383 healthdec | .691 .314 2.20 0.037 .045 1.336
_cons | -.023 .023 -0.99 0.329 -.071 .024
Figure 12 - GDP per-capita and % of families with children
Parents one full time, one part-time
Source: Author’s calculations on Oecd family database and Eurostat database
This relationship can be interpreted as a mutual social agreement, between families with children and firms, for more flexible work arrangements, in countries with higher level of GDP per-capita: implicitly it stresses the importance of the Stability of family in-come, through monetary and in-kind transfers, as well as the cru-cial importance of unemployment insurance against economic shocks and recessions.
4. Coping with market’s SINS: the case of 7 major countries, from 1996 to 2009
In this section we focus on a single policy goal – Stability - from a different perspective, asking whether social protection benefits can
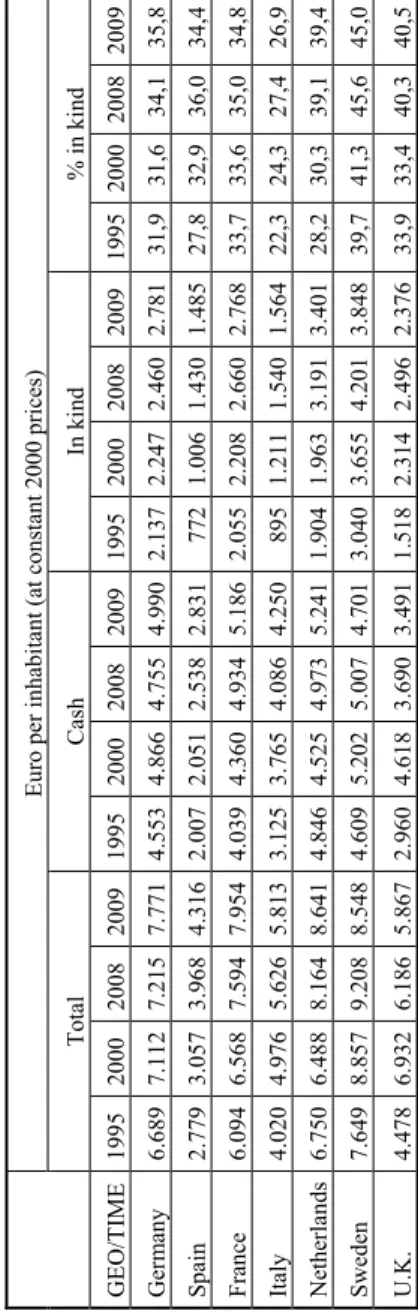
work as an automatic stabilizer, moving countercyclically in eco-nomic recessions, and thus promoting ecoeco-nomic recovery and indi-rectly the other goals. We undertake this analysis selecting 7 major Eurpean countries for which we analyze the relationship between social protection expenditures and GDP variability over the period 1995-2009: the countries selected, on the basis of their economic relevance or because they represent a different growth model, are Germany, Spain, France, Italy, Netherland, Sweden and UK. A summary of the social expenditures for these countries is presented in table 2 (euro per-capita at constant prices) and table 3 (percen-tage of GDP), selecting four years – 1995, 2000, 2008, 2009 – to get a first view of time dynamic, including the crisis: we also com-pute the percentage of in-kind transfer.
If we look to the values per-capita some interesting points arise: the (constant) values of social expenditures increase for all coun-tries between 1995 and 2009, but in 2009 the social expenditures increased in Germany, Spain France, Italy and Netherland, while decreased in Sweden and UK8. A common pattern is the increasing share of in-kind benefits with respect to the total benefits , for which the higher percentages has been reached in Sweden (45%) and U.K. (40,5%), while the lowest has been hitted in Italy (26,9%) and Spain (34,4%). At the same time it crucial to note the differ-ences of the total social protection benefits as a percentage of GDP (2009), ranging from a low of 28,2% in U.K. and 28,4% in Italy to a high of 31,6% in France and 31,5% in Sweden: a range which becomes much wider if we consider the percentage of in-kind transfer, from a low of 7,6% in Italy and 8,4% in Spain to a high of 11,7% in Netherland and 14,2% in Sweden. These differences of the percentage of GDP translate in much wider differences in total benefits per-capita, from a low of 4.316 euro in Spain and 5.813 euro in Italy (at constant 2000 prices) to a high of 8.641 in Nether-land and 8.548 in Sweden.
8
There is a break for the UK data, because of a riclassification by the De-partment of Work and Pensions as from 2007: this change should not
Table 2 - Soci al protection benefits (thou sands euro pe r inhabit ant)
Euro per inhabitant (at
constant 2000 prices) Total Cash In kind % in kind GEO/T IM E 1995 2000 2008 2009 1995 2000 2008 2009 1995 2000 2008 2009 1995 2000 2008 2009 Ger m any 6. 689 7. 112 7. 215 7. 771 4. 553 4. 866 4. 755 4. 990 2. 137 2. 247 2. 460 2. 781 31, 9 31, 6 34, 1 35, 8 Spain 2. 779 3. 057 3. 968 4. 316 2. 007 2. 051 2. 538 2. 831 772 1. 006 1. 430 1. 485 27, 8 32, 9 36, 0 34, 4 France 6. 094 6. 568 7. 594 7. 954 4. 039 4. 360 4. 934 5. 186 2. 055 2. 208 2. 660 2. 768 33, 7 33, 6 35, 0 34, 8 Italy 4. 020 4. 976 5. 626 5. 813 3. 125 3. 765 4. 086 4. 250 895 1. 211 1. 540 1. 564 22, 3 24, 3 27, 4 26, 9 Netherlands 6. 750 6. 488 8. 164 8. 641 4. 846 4. 525 4. 973 5. 241 1. 904 1. 963 3. 191 3. 401 28, 2 30, 3 39, 1 39, 4 Sweden 7. 649 8. 857 9. 208 8. 548 4. 609 5. 202 5. 007 4. 701 3. 040 3. 655 4. 201 3. 848 39, 7 41, 3 45, 6 45, 0 U.K. 4. 478 6. 932 6. 186 5. 867 2. 960 4. 618 3. 690 3. 491 1. 518 2. 314 2. 496 2. 376 33, 9 33, 4 40, 3 40, 5 Source: Au thor’s calcu latio n fro m Eurostat data base
Table 3 - Soci al protection benefits ( % G DP) Percentage of G D P Total Cash In kind GEO/TIME 1995 2000 2008 2009 1995 2000 2008 2009 1995 2000 2008 2009 Germany 27,2 28,6 26,9 30,1 18,5 19,5 17,7 19,3 8,7 9,0 9,2 10,8 Spain 20,9 19,5 21,6 24,5 15,1 13,1 13,8 16,1 5,8 6,4 7,8 8,4 France 28,7 27,7 29,5 31,6 19,0 18,4 19,2 20,6 9,7 9,3 10,3 11,0 Italy 23,2 23,8 26,5 28,4 18,1 18,0 19,2 20,8 5,2 5,8 7,3 7,6 Netherlands 28,9 24,7 26,9 29,7 20,8 17,2 16,4 18,0 8,2 7,5 10,5 11,7 Sweden 33,1 29,3 28,9 31,5 19,9 17,2 15,7 17,3 13,1 12,1 13,2 14,2 U.K. 26,4 25,5 25,3 28,2 17,5 17,0 15,1 16,8 9,0 8,5 10,2 11,4 Source: Au thor’s calcu lation fro m Eurostat
The first question which we now address is the dynamic of social protection benefits with respect to GDP growth and fluctuation, to assess whether social protection benefits are procyclical or coun-tercyclical: to obtain a simple, but complete, understanding we computed the simple correlation coefficient of the annual rate of change of social protection benefits per-capita for each function and the annual rate of change of the GDP per-capita, over the pe-riod 1996-2009. Quite different patterns emerge, across the coun-tries and the functions (table 4). The unemployment insurance is the only function for which a countercyclical behavior with nega-tive correlation, marked by the Great Recession, arises for all the countries: the value of the coefficient is however low for France and Sweden. France and Germany are the only two countries showing a countercyclical behavior for all the social protection functions, while Sweden and UK are procyclical for almost all the social protection functions (excluding unemployment). The pattern for each function varies markedly across the countries: sickness and health care is countercyclical in Germany (-0,5475) and pro-cyclical in Sweden (0,6545) and UK (0,6941). Family and children benefits are (mildly) countercyclical in France (-0,3872) procyclic-al in Sweden (0,44486) and UK (0,5817). In Itprocyclic-aly, apart from un-employment, disability is the only function which is (mildly) tercyciclical (-0,3534). Within the specific funtions of each coun-tries comovents tend to prevail, with a wide range of correlations. The correlation of the total social protection expenditures with the GDP per-capita cannot be taken as such, because of the distorsion due to the inclusion of social protection expenditures in the GDP: the correlation with the rate of change mitigate but do not correct a posssible bias, given the high percentage of social protection ex-penditures in the GDP.
Table 4 -
Simple correl
ation coeffici
ents: rate of annu
al change of social protection benefits
per-capita and G D P per capita (1996-2009) Sim ple correlati on coeff icient : r ate of growth of GDP per-capit a and soci al protection b enefits 1996-2009 Germany Spain France Italy Netherland Sweden UK All functions -0,6595 -0,6903 -0,4610 0,0356 -0,5213 0,5487 0,4532 Sickness/Heal th care -0,5475 -0,0888 -0,2463 0,4096 -0,2527 0,6545 0,6941 Old-Age -0,2376 -0,4878 -0,2320 0,1018 -0,1376 0,4158 0,2540 Survivors -0,4962 0,2496 -0,1868 -0,0229 -0,1224 0,4618 0,2343 Fa mi ly /c hi ld re n -0,2532 0,2640 -0,3872 0,0525 -0,0786 0,4486 0,5854 Disability -0,3301 -0,0129 -0,1837 -0,3534 -0,2267 0,7507 0,5817 Unemplo y ment -0,8759 -0,9224 -0,5439 -0,9188 -0,9409 -0,3753 -0,4665 Housing -0,1067 -0,1770 -0,2387 0,1926 0,2337 0,4289 0,1230 Social exc lusion -0,2373 -0,0941 -0,4415 -0,0230 -0,0219 -0,0549 0,3685 Source: Au thor’s calcu latio n fro m Eurostat data base
A straightforward procedure is to subtract the social protection ex-penditures from the GDP per-capita9, comparing the result with the original data. We make this correction for Sweden (figure 13) and Germany (figure 14), whose patterns are representative: the dy-namic is similar to the ones without correction, but with better fit-ting values.
Figure 13 – Sweden – social benefits and GDP (1996-2009)
Source: Author’s calculation from Eurostat database
9
We subtract the social protection benefits per-capita (constant 2000 prices) from the GDP per capita (constant 2005 prices) and then we ana-lyze the relationship between these two new aggregates. There are two implicit assumptions: first, the two aggregates can be considered separa-ble, while a wider theoretical model should allow for some form of com-plementarity or substitutability, and second, the two series (source Euros-tat), while being both at constant prices, have two different references years, which methodologically should have only a slight effect on the cal-culation of the rate of change, over short periods.
Figure 14 - Germany – social benefits and GDP (1996-2009)
Source: Author’s calculation from Eurostat database
We also run a regression, pooling the data corrected for Germany plus France (28 annual observations), with and without fixed effect (1996-2009): the estimates are similar and with the expected coun-tercyclical sign in both cases (table 5 – only for fixed effect). The estimates (fixed effect) are still significant if we exclude the years 2008-2009, but enlarge the dataset to Germany, France, Sweden and UK (48 annual observations): however the R2 decreases and the coefficient on the GDP increase, still retaining the negative countercyclical sign (table 6).
Table 5 - Social protection expenditures (SPE) and GDP
per-capita (less SPE)
Germany and France (Fixed Effect) Rates of annual change 1996-2009
FE panel regression
Fixed-effects (within) regression Number of obs = 28 Group variable: country Number of groups = 2 R-sq: within = 0.550 Obs per group: min = 14 between = 1.000 avg = 14.0 overall = 0.545 max = 14 F(1,25) = 30.67 corr(u_i, Xb) = 0.062 Prob > F = 0.000
varspe | Coef. Std.Err. t P>|t| [95% Conf. Interval] + -varpilmeno~e | -.513 .092 -5.54 0.000 -.703 -.322 _cons | 1.987 .291 6.82 0.000 1.387 2.587 + sigma_u | .446 sigma_e | 1.476
rho | .083 (fraction of variance due to u_i) ---F test that all u_i=0: ---F(1, 25)= 1.28 Prob > ---F = 0.2694
Table 6 - Social protection expenditures (SPE) and GDP
per-capita (less SPE)
Germany, France, Sweden, UK (Fixed Effect) Rates of annual change 1996-2007
FE panel regression
. xtreg varspe varpilmenospe if country==France | country==Germany|country==Sweden |country==UK, fe
Fixed-effects (within) regression Number of obs = 48 Group variable: country Number of groups = 4 R-sq: within = 0.451 Obs per group: min = 12 between = 0.206 avg = 12.0 overall = 0.339 max = 12 F(1,43) = 35.36 corr(u_i, Xb) = -0.299 Prob > F = 0.000 varspe | Coef. Std.Err. t P>|t| [95% Conf. Interval] ---+--- --- varpilmeno~e | -1.566 .263 -5.95 0.000 -2.097 -1.035 _cons | 5.670 .811 6.99 0.000 4.033 7.306 sigma_u | 2.089 sigma_e | 3.576
rho | .254 (fraction of variance due to u_i) ---F test that all u_i=0: ---F(3, 43) = 3.73 Prob > ---F = 0.0181
However, the Fixed Effect procedure neutralize the possibility to identify the specific pattern of each country, selecting subgroups. Indeed, it is instead useful to group the countries as follows:
a) Germany and Spain show a significant countercyclical rela-tionship: in 2009 the percentage of general government con-tributions to total receipts for social protection is 37% in Ger-many and 44,5% in Spain (the share of social contributions be-ing the complement to 100).
b) France and Netherland show a weaker countercyclical relation-ship: the percentage of general government contribution to to-tal receipts is 35,4% in France and 34,6% in Netherland. c) Italy does not show any detectable pattern, with a percentage
of general government contribution to total receipts of 45,4% d) Sweden and United Kingdom show a countercyclical pattern
from 1996 to 2007, while from 2007 to 2009 the pattern is pro-cyclical: the percentage of general government contributions to totale receipts is 54% in Sweden and 56,1% in UK.
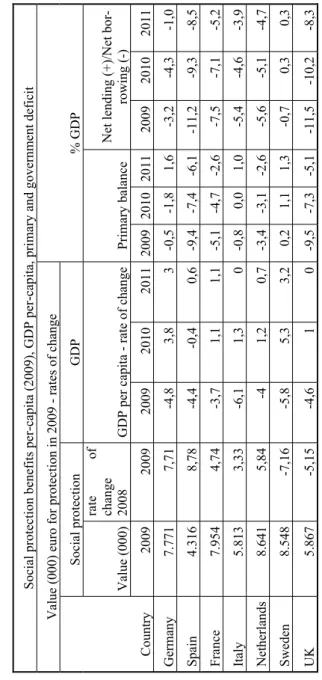
We can ask which is the better economic policy, countercyclical rather procyclical, in terms of the economic growth and govern-ment balances following the sharp drop in social spending in 2009, with the advantage of knowing ex-post the economic performances (table 7). The outcomes are mixed because:
a) Germany improves growth and public balances while Spain worsens both significantly.
b) France and Netherland show weaker improvements of growth and public balances.
c) Italy improves its primary balance and deficit, but growth does not recover.
d) Sweden show a significant recovery and a surplus of primary and total government balance while UK show a much worse performance.
Table 7 -
Crisis and af
ter: social protecti
on, growth and government bal
ance Social protection benef its p er-cap ita (2009), GDP per-cap ita, p rimar y and governm ent d eficit Value (000) eur o for protection in 2009 rates of change % GDP Countr y Social protection GDP Value (000) rate o f change 2008 GDP per cap ita rate of ch ange Primar y b alan ce Net lending (+)/Net bor-rowing (-) 2009 2009 2009 2010 2011 2009 2010 2011 2009 2010 2011 German y 7.771 7,71 -4,8 3,8 3 -0,5 -1,8 1,6 -3,2 -4,3 -1,0 Spain 4.316 8,78 -4,4 -0,4 0,6 -9,4 -7,4 -6,1 -11,2 -9,3 -8,5 France 7.954 4,74 -3,7 1,1 1,1 -5,1 -4,7 -2,6 -7,5 -7,1 -5,2 Italy 5.813 3,33 -6,1 1,3 0 -0,8 0,0 1,0 -5,4 -4,6 -3,9 Netherlands 8.641 5,84 -4 1,2 0,7 -3,4 -3,1 -2,6 -5,6 -5,1 -4,7 Sweden 8.548 -7,16 -5,8 5,3 3,2 0,2 1,1 1,3 -0,7 0,3 0,3 UK 5.867 -5,15 -4,6 1 0 -9,5 -7,3 -5,1 -11,5 -10,2 -8,3 Source: Au thor’s calcu latio n fro m Eurostat data base
Sweden (procyclical) seems to record the best results during the mild recovery of 2010-2011, together with Germany (countercyc-lical): France and Netherland show improving, but slower perfor-mances, while Spain (countercyclical) and even more UK (cyclic-al) record the worst performances among the selected European countries. No clear pattern arises, except that best performing countries recorded the highest social protection expenditure per-capita in 2009, while the worst – Spain, Italy and UK – recorded the lowest.
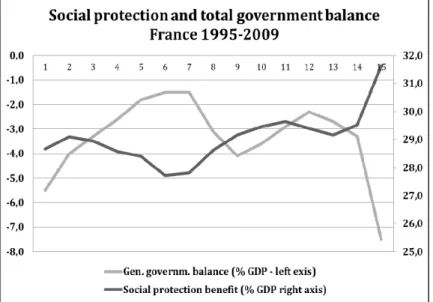
The procyclical behavior for Sweden and UK during the Great Cri-sis leaves open the question of explaining the pattern of benefits reductions. To understand it we consider the years 2008 and 2009 for the selected countries and the main social protection functions. We can check that in Sweden and UK the procyclical decrease in 2009 regards all the social functions with the exception of the un-employment benefits (table 8): for Sweden we should however note that in 2009 the level of real social protection benefits per-capita was among the highest in Europe, despite the GDP decrease. This suggests that a high level of social protection benefits per-capita can give political leeway during a recession, being itself an policy instrument for budget adjusment. It is in the UK that the procyclical behavior is really at variance, because the social protec-tion benefits are instead relatively low: both countries have in common a higher share of generale government contributions, 52% in Sweden and 49% in UK. In both countries the Great Recession is the cause of a government deficit in 2009: -0,7% in Sweden and a much wider -11,5% in UK – prompting a policy of public ex-penditure reduction. In the case of Sweden we have a peculiar countercyclical movement of social public expenditure in the op-posite direction of the general government budget deficit or surplus (figure 15), which has been officiallly implemented as a fiscal pol-icy, targeting 1% percent of public budget surplus over the busi-ness cycle (OECD, 2008): the general budget balance is therefore a “tight” constraint, with a margin of fluctuation for the social pro-tection expenditures, around the 30% of GDP, to abide by this rule.
Table 8 -
Soci
al protection
benefits by function: value
s 2009
and change on 2008
Social protection benefits by
function
- 2009
Country
Euro per inhabitant (at
constant 2000 prices) and ra te of change over 2008 Total Health Old Age Survivors Fa m il y /children Disability Unem p loy m ent Housing Social exclusion Ger m any 2009 7. 771 2. 493 2. 573 557 819 626 490 167 47 change 7, 7 13, 2 2, 9 1, 7 6, 4 3, 1 26, 4 7, 9 3, 0 Spain 2009 4. 316 1. 286 1. 350 381 267 303 647 35 47 change 8, 8 2, 6 6, 2 4, 4 6, 6 4, 2 40, 7 -0 ,1 10, 4 France 2009 7. 954 2. 359 3. 118 505 665 470 484 213 140 change 4, 7 4, 3 4, 2 3, 1 3, 9 3, 7 10, 8 2, 7 23, 1 Italy 2009 5. 813 1. 495 2. 954 540 287 355 164 5 15 change 3, 3 0, 8 2, 0 3, 3 7, 4 6, 5 49, 9 6, 2 25, 7 Netherland 2009 8. 641 3. 011 3. 040 361 378 729 421 110 592 change 5, 8 5, 8 4, 0 -1 ,2 5, 5 1, 5 34, 1 -0 ,6 12, 1 Sweden 2009 8. 548 2. 171 3. 439 158 872 1. 233 353 129 192 change -7 ,2 -9 ,6 -6 ,5 -11, 2 -9 ,3 -9 ,9 27, 4 -11, 5 -2 ,3 United Kingdo m 2009 5. 867 1. 807 2. 500 33 379 621 175 307 45 change -5 ,2 -6 ,3 -5 ,5 -4 ,1 -8 ,0 -7 ,7 21, 2 2, 3 -6 ,0 Source: Au thor’s calcu lation
Figure 15 - Social protection benefits and and total government
bal-ance - Sweden 1965-2009
Source: Author’s calculation from Eurostat database
In the case of the UK, the budget deficit was simply too high to man-age a similar adjustment, given the low starting level of social pro-tection expenditures. The pattern for France is quite similar to that of Sweden, the main difference being that primary budget seems to be the target and the binding constraint, while for Sweden it is the total budget (figure 16). Choosing total rather primary constraint seems to be the crucial question in defining the size of the welfare state, given the GDP per-capita, which in turn depends on the size of debt servic-ing, the public debt/GDP ratio and the share of payments to non-residents.
Figure 16 - France social protection benefits and total government
balance
Source: Author’s calculation from Eurostat database
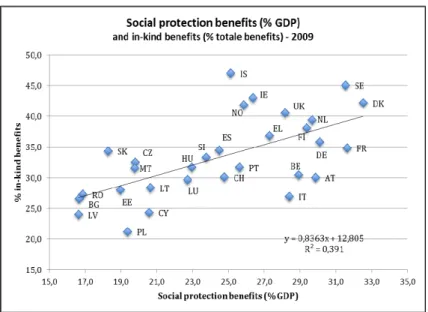
Cyclicality of the social protection benefits to GDP ratio means an adequate share of discretionary spending, which is very difficult to achieve with regard to the entitlement to cash transfers, while it seems more plausible that the central (or local) government can tem-porary “ration” supply and spending of in-kind transfer, like health care supply. This hypothesis is partly confirmed by a positive cross-section relationship between the level of social protection benefits, as share of GDP, and the share of in-kind transfers (figure 17), as well by the steady increase over the time of in-kind transfers for the ma-jority of European countries. The shift toward in-kind transfers al-lows a better targeting of the needs and the social cost of “paternal-ism” can be balanced by a better chance of political approval: at the
of temporary discretionary expenditures over the business cycle or during serious economic crises. Another way to limit the access to social protection benefits is to make them conditional on income le-vels, as a part of fiscal policy with income progressivity, without ne-cessary making them conditional on a means-testing.
Figure 17 - Social protection benefits and % in-kind
Source: Author’s calculation from Eurostat database
Conclusions
We suggest that we can better understand the European Welfare State as the primary institution necessary to cope with the unavoida-ble shortcomings of the market mechanism, which we relate to issues of stability, inequality, needs and safety, for which we use the acronym market’s SINS.
We show the existence of a positive (perhaps quadratic) relationship between the social protection benefits, as a share of GDP, and the GDP per-capita: we argue that to understand the increasing aggregate demand of social protection we need to disaggregate it with respect to the main goals and functions. Pensions and health care are clearly related to the achievement of Stability and Need, while the benefits for housing and social exclusion are related to the goal of Safety and Security. Need and extreme Inequality, measured through poverty reduction, are clearly related to the benefits for the functions of fami-ly and children, sickness and health care, disability. We show the close relationship between social benefits and public balance, total and primary, and we discriminate the countercyclical or procyclical behavior for a sample of 7 major European countries. European Wel-fare State shows different patterns in the process of public budget ad-justment: we discuss the case of Sweden, a country with very good economic performances and a procyclical behavior allowed by the highest social protection benefit per-capita: the political leeway of high social protection expenditure seems to be an overlooked instru-ment of stabilization. Sweden officially targets a total balance sur-plus of 1%, France seems to target, implicitly, the primary balance. Sweden and Germany rebounded 7-8% compounded growth in 2010 and 2011 , given a high level of social spending; France and Nether-land rebounded more than 2% also with the same high level of spending; Spain, Italy and UK, with a low level of social spending, rebounded much less, between 0 and 2%, with only a slight im-provement in total public balance. This pattern is confirmed in the first semester of 2012: Sweden and Germany record a significant GDP growth, France and Netherland are flat or with a slight increase, while Spain, Italy and UK are technically in recession, with the third straight quarter of GDP decrease. The role of economic growth in fostering an improvement of primary balances is quite clear, espe-cially in Spain, Italy and UK: indeed we show that the GDP per-capita in 2000 is a strong predictor of the average primary balance in the period 2000-2009. We show a positive relationship between the level of social protection benefits and the percentage of in-kind bene-fits on total benebene-fits: this pattern has many implications. It underlines
a more comprehensive approach of the Welfare State, which includes the greater political flexibility of in-kind benefits, and the chance of smooth and quick “rationing” schemes when the budget balance is in deficit.
References
Arrow, K. (1951) “Social Choice and Individual Values”, Third edi-tion, Yale University Press.
P. Buonnano, F. Drago, R. Galbiati and G. Zanella (2010) “Crime in Europe and in the US: Dissecting the Reversal of Misfortune”, Eco-nomic Policy, Fifty-Second Panel Meeting, 22-23 October.
L. Campiglio (2005) “Prima le donne e i bambini. Chi rappresenta i minorenni?”, Il Mulino.
L. Campiglio (2009) “Children’s Right to Vote: The Missing Link in Modern Democracies”, in Qvortrup J. (ed.) “Structural, Historical, and Comparative Perspectives”, Emerald Books, UK, August, pp. 211-247.
L. Campiglio (2010) “La ricchezza (economica) delle famiglie“, in “La ricchezza delle famiglie”, edited by E. Scabini and G. Rossi, Vi-ta e Pensiero, pp. 57-73.
J. Currie (2006) “The invisible safety net. Protecting the Nation’s Poor Children and Families”, Princeton University Press.
M. Fleurbaey (2008) “Fairness, Responsability, and Welfare”, Ox-ford University Press.
K. Marx (1875) “Critique of the Gotha Program”, retrived.
I. Garfinkel, L. Rainwater, T. Smeeding (2010) “Wealth & Welfare States. Is America a Laggard or a Leader ?”, Oxford University Press.
J. M. Keynes (1937) “The General Theory of Employment”, Mac-millan, Quarterly Journal of Economics 51, pp. 209-223.
A. Meltzer and S. Richard (1981) “A Rational Theory of the Size of Government”, Journal of Political Economy, 89, October, pp. 914-927.
J. S. Mill (1859) “Representative Government”, in “On Liberty and Other Essays”, Oxford World’s Classics.
OECD (2008) “Sweden Economic Survey”, decembre 2008/20. R. G. Rajan (2010) “Fault lines”, Princeton University Press.
D. Rodrik (1998) “Why Do More Open Economies Have Bigger Governments ?”, Journal of Political Economy, vol. 106, no. 5, octo-ber, pp. 997-1032.
Elenco
Quaderni già pubblicati
1. Capitalismo senza capitale. Il capitalismo italiano delle
diversità. L. Campiglio, luglio 1993.
2. Credibility and Populism in the Management of a Public
Social Security System. L. Bonatti, luglio 1993.
3. Il ruolo delle Nonprofit Organizations nella produzione di
servizi sanitari. R. Creatini, dicembre 1993.
4. Technological Change, Diffusion and Output Growth. M.
Baussola, dicembre 1993.
5. Europe: the Trademark is Still on the Mark.
L.
Campig-lio, gennaio 1994.
6. A Cointegration Approach to the Monetary Model of the
Exchange Rate. M. Arnone, febbraio 1994.
7. Gli effetti del debito pubblico quando la ricchezza è un
fi-ne e non solo un mezzo. V. Moramarco, maggio 1994.
8. Emissioni inquinanti, asimmetria informativa ed efficacia
delle imposte correttive. R. Creatini, settembre 1994.
9. La disoccupazione in Europa. L. Campiglio, novembre
1994.
10. The Economics of Voting and Non-Voting: Democracy and
Economic Efficiency. L. Campiglio, gennaio 1995.
11. The Banking Law and its Influence on the Evolution of the
Italian Financial System. C. Bellavite Pellegrini, maggio
1995.
12. Monetary Authorities, Economic Policy and Influences in
the Capital Market in Italy 1960-1982. C. Bellavite
13. A General Model to Study Alternative Approaches to
Eco-nomywide Models in a Transaction Values (TV) Context.
F. Timpano, giugno 1995.
14. Economia legale ed economia illegale: schemi
interpreta-tivi della coesistenza. D. Marino, F. Timpano, luglio 1995.
15. Il problema del cambiamento dei coefficienti nel contesto
di una matrice di contabilità sociale regionalizzata. F.
Timpano, settembre 1995.
16. La dimensione transnazionale dell’inquinamento marino:
le convenzioni internazionali tra teoria e pratica. G.
Ma-lerba, giugno 1996.
17. Efficienza, stabilità degli intermediari e crescita del
reddi-to: un modello teorico. C. Bellavite Pellegrini, novembre
1996.
18. Innovation and the World Economy: How will our (Grand)
Children Earn a Living?, L. Campiglio, P. J. Hammond,
gennaio 1997.
19. Evaluating Private Intergenerational Transfers between
Households. The Case of Italy. F. Tartamella, febbraio
1997.
20. Qualità e regolamentazione. R. Creatini, maggio 1997.
21. Wage Differentials, the Profit-Wage Relationship and the
Minimum Wage. G. Quintini, giugno 1997.
22. Potere e rappresentatività nel Parlamento Italiano: una
prospettiva economica. L. Campiglio, luglio 1997.
23. Exchange Rate, Herd Behaviour and Multiple Equilibria.
M. Arnone, settembre 1997.
24. Rank, Stock, Order and Epidemic Effects in the Diffusion
of New Technologies in Italian Manufacturing Industries.
E. Bartoloni, M. Baussola, dicembre 1997.
25. Stabilità ed Efficienza del Sistema Finanziario Italiano:
una Verifica Empirica. M. Manera, C. Bellavite Pellegrini,
26. Endogenous Uncertainty and Market Volatility. M. Kurz,
M. Motolese, aprile 1999.
27. Famiglia, distribuzione del reddito e politiche familiari:
una survey della letteratura degli anni Novanta. Parte
prima: I nuovi fenomeni e i vecchi squilibri delle politiche
sociali. G. Malerba, aprile 2000.
28. Modelli di Agenzie di sviluppo regionale: analisi teorica
ed evidenza empirica. M. Arnone, C. Bellavite Pellegrini,
F. Timpano, aprile 2000.
29. Endogenous Uncertainty and the Non-neutrality of Money.
M. Motolese, maggio 2000.
30. Growth, Persistent Regional Disparities and Monetary
Policy in a Model with Imperfect Labor Markets. L.
Bon-atti, maggio 2001.
31. Two Arguments against the Effectiveness of Mandatory
Reductions in the Workweek as a Job Creation Policy. L.
Bonatti, maggio 2001.
32. Growth and Employment Differentials under Alternative
Wage-Setting Institutions and Integrated Capital Markets.
L. Bonatti, maggio 2001.
33. Attività innovativa e spillovers tecnologici: una rassegna
dell'analisi teorica. A. Guarino, maggio 2001.
34. Famiglia, distribuzione del reddito e politiche familiari:
una survey della letteratura italiana degli anni Novanta.
Parte seconda: La riforma del Welfare e le sue
contraddi-zioni. G. Malerba, giugno 2001.
35. Changeover e inflazione a Milano. L. Campiglio, V.
Ne-gri, giugno 2002.
36. Prezzi e inflazione nel mercato dell’auto in Italia. L.
Cam-piglio, A. Longhi, ottobre 2002.
37. Interessi economici, potere politico e rappresentanza
par-lamentare in Italia nel periodo 1948-2002. L. Campiglio,
38. Dai consumi interni a quelli dei residenti: una stima
pre-liminare a livello regionale. C. Corea, giugno 2003.
39. Studio delle relazioni tra spesa familiare e caratteri
socia-li, demografici ed economici delle famiglie italiane:
un’analisi a livello sub-nazionale. A. Coli, giugno 2003.
40. L’utilizzo delle indagini su redditi e consumi nella
deriva-zione di indicatori per scomporre i dati di Contabilità
Na-zionale. Un caso riferito all’analisi regionale. F.
Tartamel-la, giugno 2003.
41. Segnali di disagio economico nel tenore di vita delle
fami-glie italiane: un confronto tra regioni. G. Malerba, S.
Pla-toni, luglio 2003.
42. Rational Overconfidence and Excess Volatility in General
Equilibrium. C.K. Nielsen, febbraio 2004.
43. How Ethnic Fragmentation And Cultural Distance Affect
Moral Hazard in Developing Countries: a Theoretical
Analysis. T. Gabrieli, febbraio 2004.
44. Industrial Agglomeration: Economic Geography, Technological
Spillover, and Policy incentives. E. Bracco, ottobre 2005.
45. An Introduction to the Economics of Conflict, a Survey of
Theoretical Economic Models of Conflict. R. Caruso,
otto-bre 2005.
46. A Model of Conflict with Institutional Constraint in a
two-period Setting. What is a Credible Grant?, R. Caruso,
ot-tobre 2005.
47. On the Concept of Administered Prices. L. Gattini,
dicem-bre 2005.
48. Architecture of Financial Supervisory Authorities and the
Basel Core Principles. M. Arnone, A. Gambini, marzo
2006.
49. Optimal Economic Institutions Under Rational
Regime and the Design of Social Security. C.K. Nielsen,
aprile 2006.
50. Indicatori di vulnerabilità economica nelle regioni
italia-ne: un’analisi dei bilanci familiari. G. Malerba, giugno
2006.
51. Risk Premia, Diverse Beliefs and Beauty Contests. M.
Kurz, M. Motolese, gennaio 2007.
52. Le disuguaglianze regionali nella distribuzione del
reddto. Parte prima: Un’analisi della povertà delle famiglie
i-taliane. G. Malerba, dicembre 2009.
53. What do we know about the link between growth and
insti-tutions?, M. Spreafico, maggio 2010.
54. Economic Institutions and Economic Growth in the
For-mer Soviet Union Economies. M. Spreafico, maggio 2010.
55. Famiglia, figli e sviluppo sostenibile. L. Campiglio,
set-tembre 2011.
56. Le determinanti politico-economiche della distribuzione
interregionale della spesa pubblica. V. Moramarco,
otto-bre 2011.
57. Le disuguaglianze regionali nella distribuzione del
reddi-to. Parte seconda: Un’analisi delle famiglie italiane a
ri-schio di povertà. G. Malerba, ottobre 2011.
58. Libertà del vivere una vita civile e deprivazione
economi-ca. L. Campiglio, ottobre 2011.
59. Europa, crescita e sostenibilità: “E Pluribus Unum”. L.
Campiglio, Vita e Pensiero, febbraio 2012 (ISBN
978-88-343-2215-4).
60. Market’s SINS and the European Welfare State: theory
and empirical evidences. L. Campiglio, Vita e Pensiero,
Printed by Gi&Gi srl - Triuggio (MB)
Università Cattolica del Sacro Cuore
ISTITUTO DI POLITICA ECONOMICA
VITA E PENSIERO
Market’s SINS
and the European Welfare State:
theory and empirical evidences
Luigi Campiglio
Quaderno n. 60/settembre 2012
ISBN 978-88-343-2323-6 COP Campiglio 60.qxd:_ 17/09/12 08:44 Page 1