1
1) Introduction
1.1) Purinergic Receptors 1.1.1) P2 receptors 1.1.2) P2Y receptors 1.1.3) P2X receptors 1.2) P2X7 receptor 1.2.1) P2X7 receptor pharmacology1.2.2) Factors influencing P2X7 receptor expression 1.2.3) P2X7 and cell cytotoxicity
1.2.4) P2X7 and Apoptosis 1.2.5) P2X7 and cell growth 1.2.6) P2X7 and Cancer
1.3) Cell metabolism in cancer – Warburg Effect 1.4) Glucose deprivation and Warburg Effect
1.5) Activation of proteins, involved in metabolism progression,
can act as check points 1.5.1) Glycolysis enzymes 1.5.2) Glucose transporters
1.5.3) Activation of PI3K/Akt pathway supports cell proliferation in cancer
2
3) Materials and Methods
3.1) Cell maintenance
3.2) Transfection of HEK293 Cells and Selection of Stable Clones
3.3) Cell lines and proliferation assay 3.4) Treatment and drugs
3.5) Measurement of extracellular ATP 3.6) Lactate measurement
3.7) Real-Time PCR
3.8) Western Blot Analysis
3.9) Visualization of mitochondria and semi- quantitative evaluation of mitochondrial potential
3.10) Glycogen store detection 3.11) Data analysis
4) Results
4.1) Growth promotion effect of P2X7 in serum and glucose deprivation
4.2) ATP production in HEK293, transfected with P2X7R, decreases during glucose depletion
4.3) Lactate release in HEK293, transfected with P2X7R, increases during glucose depletion
3
4.4) Stimulation of P2X7R mediates lactate release increase in HEK293
4.5) Blockade of P2X7R mediates lactate release decrease in ACN neuroblastoma cells
4.6) G3PDH is up-regulated in HEK293 during glucose depletion
4.7) PK-M2 expression is enhanced in HEK293 during glucose depletion
4.8) PDHK1 is more activated in HEK293 during glucose depletion
4.9) Glucose depletion causes mitochondria depolarization and swelling in HEK293
4.10) Glucose depletion increases glucose uptake by enhancing GLUT-1 transporter expression in HEK293 4.11) HEK293 cells use intracellular glycogen stores to support glycolysis during glucose depletion
4.12) Serine/Threonine Kinase Akt is more expressed and phosphorylated in HEK293
5) Discussion and Conclusions
1) Introduction
1.1) Purinergic Receptors
Purinergic receptors were firstly classified by Gordon in 1986 on the basis of their pharmacological profile. In 1997 the International Union of Basic and Clinical Pharmacology (IUPHAR) amended the classification by including the molecular structure. Accordingly, purinergic receptors are currently classified in two groups: P1 and P2 receptors.
Physiological agonist of P1 receptors is adenosine, while physiological agonist of P2 receptors agonist are ATP (adenosine-5'-triphosphate) and other nucleotides. This thesis focuses on P2 receptors.
1.1.1) P2 receptors
P2 receptors are divided into two subgroups: P2Y and P2X (Apasov et al. 1995; Ralevic and Burnstock, 1998).
1.1.2) P2Y receptors
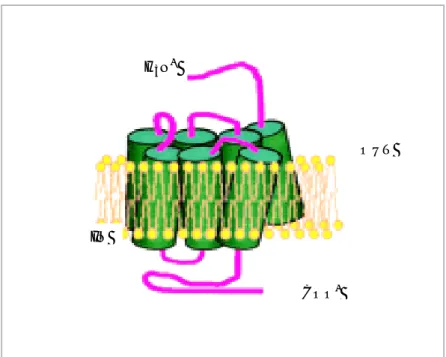
P2Y receptors also referred to as “metabotropic”, G protein-coupled receptors, of about 41 KDa MW, with a cytoplasmic C-terminal and an extracellular N-terminal domain (fig.1).
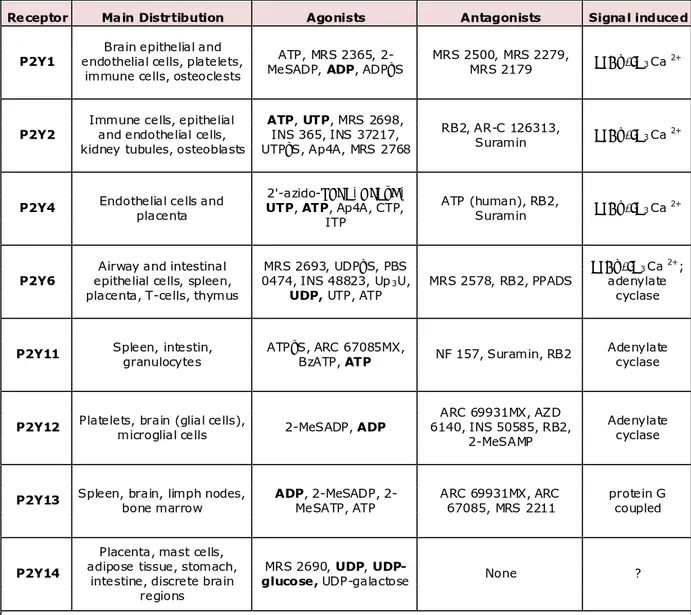
Nucleotide binding triggers a conformational change, that switches on the G protein which in turns stimulates a phospholipase C, that drives the inositole 3-Phospate (InsP3) and diacylglycerole (DAG) accumulation in the cytoplasm. InsP3 releases Ca2+ from the intracellular stores and triggers activation of cellular Ca2+ -dependent responses. Eight P2Y receptor subtypes have been cloned and characterized: P2Y1, P2Y2, P2Y4, P2Y6, P2Y11, P2Y12, P2Y13, P2Y14.
In general all P2Y receptors are activated by ATP, although UTP (uridine 5'-triphosphate) is a better agonist at P2Y4 and P2Y6 receptors, while ADP
(adenosine 5′-diphosphate) is a better agonist at P2Y1, P2Y12 and P2Y13 and UDP-glucose (uridine 5'-diphosphate-glucose) activates P2Y14.
All P2 receptors trigger phospholipase C activation through protein G. In particular P2Y1, P2Y2 induce phospholipase Cβ activation and inhibit adenylate cyclase (AC) through Gq/11 and Gi respectively (Table 1).
Fig. 1. P2Y receptors structure
H3N+
COO -IN
Receptor Main Distrtibution Agonists Antagonists Signal induced
P2Y1 endothelial cells, platelets, Brain epithelial and immune cells, osteoclests
ATP, MRS 2365,
2-MeSADP, ADP, ADPβS MRS 2500, MRS 2279, MRS 2179 PLCβ/IP3 Ca 2+
P2Y2 Immune cells, epithelial and endothelial cells, kidney tubules, osteoblasts
ATP, UTP, MRS 2698, INS 365, INS 37217, UTPγS, Ap4A, MRS 2768
RB2, AR-C 126313,
Suramin PLCβ/IP3 Ca 2+
P2Y4 Endothelial cells and placenta UTP, ATP, Ap4A, CTP, 2'-azido-dUTP, UTPγS, ITP
ATP (human), RB2,
Suramin PLCβ/IP3 Ca 2+
P2Y6 epithelial cells, spleen, Airway and intestinal placenta, T-cells, thymus
MRS 2693, UDPβS, PBS 0474, INS 48823, Up3U,
UDP, UTP, ATP MRS 2578, RB2, PPADS
PLCβ/IP3 Ca 2+; adenylate
cyclase
P2Y11 Spleen, intestin, granulocytes ATPγS, ARC 67085MX, BzATP, ATP NF 157, Suramin, RB2 Adenylate cyclase
P2Y12 Platelets, brain (glial cells), microglial cells 2-MeSADP, ADP 6140, INS 50585, RB2, ARC 69931MX, AZD 2-MeSAMP
Adenylate cyclase
P2Y13 Spleen, brain, limph nodes, bone marrow ADP, 2-MeSADP, 2-MeSATP, ATP ARC 69931MX, ARC 67085, MRS 2211 protein G coupled
P2Y14
Placenta, mast cells, adipose tissue, stomach,
intestine, discrete brain regions
MRS 2690, UDP,
UDP-glucose, UDP-galactose None ?
2-MeSATP: 2-metiltioadenosin -5'-triphosphste; α,β-MeATP: α,β-metilenadenosin-5'-triphosphate; TNP-GTP: 2'(3')-O-(2,4,6-trinitrophenil)guanosin-5'-triphosphate; BBG: Brilliant Blue G
Table 1. Agonists, antagonists, tissues of distribution and signal transducted by P2Y receptors
1.1.3) P2X receptors
P2X are ligand-gated ionotropic receptors (Ligand-gated ion channel, LGICs) (Khakh et al., 2001). Receptor activation leads to cationic (NA+, K+, Ca2+, Mg2+) fluxes through the plasma membrane. In general, P2X receptors are characterized by about 400 aa long, with two transmembrane hydrophobic units and a large extracellular region, with 10 cystein and 2-6 sites of glycosilation. Both the N-terminal and C-terminal ends are cytoplasmic (fig.2) (North et al., 1997).
P2X receptor family includes seven subtype named P2X1, P2X2, P2X3, P2X4, P2X5, P2X6 and P2X7. They were originally characterized in excitable tissue, but it is now clear that they are virtually ubiquitous (Table 2).
Fig. 2. P2X receptors structure
IN OUT
Receptor Main Distrtibution Agonists Antagonists Signal induced
P2X1 Smooth muscle, platelets, cerebellum, dorsal horn spinal neurons
ATP, BzATP, 2-MeSATP, α,β-MeATP (rapid
desensitization)
NF 449, TNP-ATP, NF
279, TNP-GTP, IP5I I Na/K/Ca2+
P2X2
Smooth muscle, brain, pancreas, retina, chromaffin cells, autonomic
and sensory ganglia
ATP, BzATP, 2-MeSATP,
α,β-MeATP RB2, PPADS, Suramin I Na/K
P2X3 neurons, NTS, some nociceptive sensory sympathetic neurons ATP, 2-MeSATP, α,β-MeATP (rapid desensitization), Ap4A TNP-ATP, PPADS, A317491, NF110, TNP-GTP, IP5I I Na/K/Ca 2+
P2X4 microglia, testis, colon, endothelial cells ATP, α,β-MeATP, CTP, Invermectin (potentiates)
5-BDBD, TNP-ATP,
PPADS, BBG I Na/K
P2X5
proliferating cells in skin, gut, bladder, thymus, spinal cord, heart, adrenal
medulla
ATPγS, ATP, α,β-MeATP PPADS, BBG, Suramin I Na/K/Ca2+
P2X6 Brain, motor neurons in spinal cord homomultimer no functional None I Na/K/Ca2+
P2X7 microglia, pancreas, skin, macrophages, mast cells, endocrin organs
ATP, BzATP, 2-MeSATP,
α,β-MeATP KN 62, BBG I Na/K/Ca
2+; pore formation
2-MeSATP: 2-metiltioadenosin -5'-triphosphste; α,β-MeATP: α,β-metilenadenosin-5'-triphosphate; TNP-GTP: 2'(3')-O-(2,4,6-trinitrophenil)guanosin-5'-triphosphate; BBG: Brilliant Blue G
Table 2. Agonists, antagonists, tissues distribution and signal transducted by P2X receptors
1.2) P2X7 receptor
P2X7 receptor is one of the most interesting members of the P2X family. It was originally cloned from a rat cervical ganglion cDNA library (Surprenant et al., 1996), but further evidences revealed P2X7 expression in many other tissues such as macrophages, monocytes, microglial cells and spleen (Table 2).
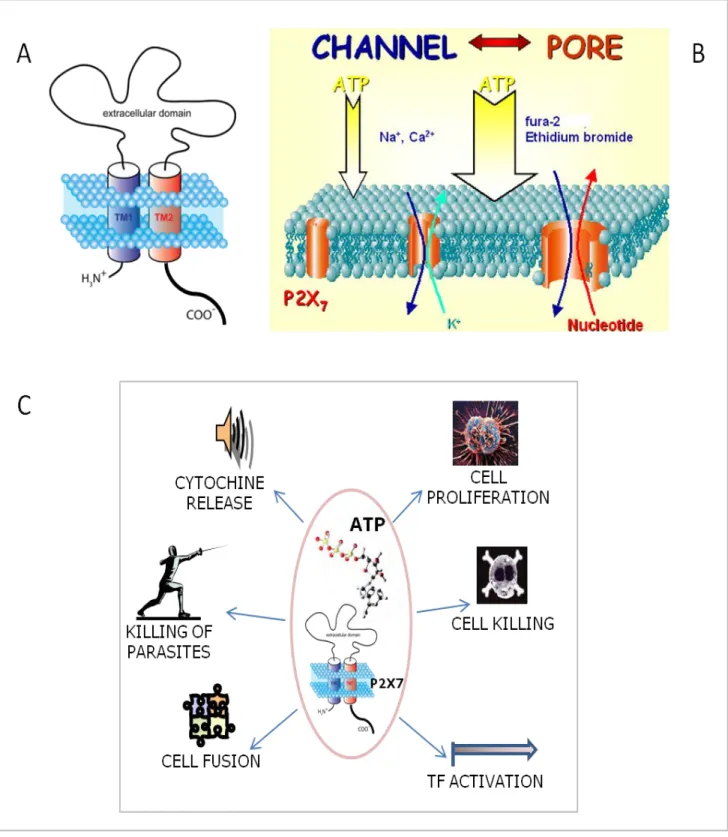
Unlike the other P2X receptors, P2X7 receptor has an unusually long cytoplasmic C-terminal end (fig. 3A), that endows P2X7 with the ability to generate a non selective membrane pore that allows transmembrane fluxes to cations, nucleotides and other small hydrophilic molecules of MW up to 900 Da (fig 3B). Truncation of the cytoplasmic tail prevents the channel-to-pore transition (Surprenant et al., 1996). Channel-to-pore transition is hastened by prolonged stimulation with ATP or by stimulation with high (hundred micromolar) ATP concentrations. ATP removal or hydrolysis causes the pore to close. Since P2X7 does not inactivate, i.e. remains open so far it is boun to its ligand, high ATP concentration may cause cell death by causing sustained pore opening (Di Virgilio et al., 1998). Experimental evidence suggests that maximal activation induces a P2X7 channel diameter expansion from a 0,8 to 2-5 nm in HEK293-transfected cells (Virginio et al., 1999), as well as in mast cells (Cockcroft and Gonperts, 1979), mouse peritoneal macrophages (Steinberg et al., 1987), human macrophages (Falzoni et al., 1995), dendritic cells (Mutini et al., 1999), J774 and BAC1.2F5 macrophage cell lines (Steinberg et al., 1987; El-Moatassim and Dubyak, 1992), mouse microglial cells (Ferrari et al., 1996). Pore size is smaller in human fibroblasts (Solini et al., 1999), mouse spleen and thymus cells (Di Virgilio et al. 1989) and human lymphocytes (Wiley et al., 1993).
Accordingly, B lymphocytes from CLL (Chronic Lymphoid Leukemia) patients show ATP-stimulated Na+, K+, Ca2+ and ethidium (394 Da) fluxes,
but are impermeable to propidium (414 Da) flux, as well as other to larger molecules (Wiley et al., 1993).
P2X7 expression is modulated during cell growth and differentiation as well as by the treatment with cytokines. In fact P2X7 is expressed by only 15% of monocytes isolated from peripheral blood, and by 40-60% of those differentiated in vitro (Hickman et al., 1994; Blanchard et al., 1991). Interferon-γ (INF- γ) and Concanavalin A (ConA), but not lipopolysaccharide (LPS) enhance P2X7 expression, does not (Blanchard et al., 1991; Falzoni et al., 1995). Increased P2X7 expression enhances ATP sensitivity (Falzoni et al., 1995).
Fig. 3. (A) P2X7 receptor structure. (B) P2X7 channel-to-pore conversion. (C) P2X7-mediated cell responses.
1.2.1) P2X7 receptor pharmacology.
The favorite P2X7 receptor ligand is ATP, but its activity can be modulated by other pharmacological ATP analogues.
2’,3’-(4-benzoil)-benzoil-ATP (BzATP) is the most common P2X7 receptor agonist, but it is not absolutely selective for P2X7 as it can act on P2X1 and P2X3 receptors (Evans et al., 1995).
Various antibiotics can modulate directly or indirectly P2X7 receptor activity: geldanamycin (GA) has been showed to potentiate P2X7-dependent response, by binding the amino-terminal ATP-binding pocket of “Heat-Shock” protein 90 (HSP90), thus preventing its interaction with P2X7 itself (Adinolfi et al., 2003). Polimixin B (PMB), known for its ability to neutralize bacterial endotossin (LPS), potentiates P2X7 stimulation by ATP, thus lowering the cytotoxic threshold of otherwise ineffectual ATP doses (Ferrari et al., 2004).
Oxidized ATP (oATP) is largely used as a P2X7 antagonist, even though this covalent reagent is likely to have low selectively has its highly reactive aldehide group can generate a Shiff base with any unprotonated lysine close to any ATP-binding site on the plasma membrane (Murgia et al., 1993; Beigi et al., 2003; Di Virgilio et al., 2004).
One of the first, potent and selective P2X7 inhibitors was KN-62 (Garget and Wiley, 1997). More recently, a family of highly selective and potent KN-62 pharmacologic analogs with a strong interleukin-1β (IL-1β)-blocking activity have been synthesized (Baraldi et al., 2003).
Other inhibitors have been synthesized by Pharma industry:
1. A 438079 hydrochloride is a competitive P2X7 receptor antagonist. The compound is devoid of activity at other P2 receptors and possesses antinociceptive activity in models of neuropathic pain in vivo (Donnelly-Robersts and Jarvis, 2007; McGaraughty et al., 2007).
2. A 740003 is a potent, selective and competitive P2X7 receptor
antagonist (EC50 values are 18 and 40 nM for rat and human
respectively). This compound displays selectively over a variety of P2X and P2Y receptors up to concentration of 100 µM. Nevertheless, it reduces nociception in animal models of persistent neuropathic and inflammatory pain (Honore et al., 2006; Donnelly-Roberts et al., 2009).
3. AZ 10606120 dihydrochloride is another potent P2X7 receptor antagonist. Differently from those described in advance, AZ 10606120 binds in appositive cooperative manner to sites distinct from, but coupled to, the ATP binding site and act as a negative allosteric modulator (Michel et al., 2007; Michel et al., 2008a). 4. AZ 11645373 is also available to selectively antagonize P2X7
receptor, without effecting all the other P2X subtypes. It inhibits BzATP mediated calcium influx and ATP mediated IL1 release in vitro (Alcaraz et al.; 2003).
Recently new allosteric modulator have been introduced: GW 791343 hydrochloride is one of those already synthesized. This compound exhibits species-specific activity and acts as a negative allosteric modulator of human P2X7 and a positive allosteric modulator of rat P2X7 (Michel et al., 2008a; Michel et a., 2008b).
1.2.2) Factors influencing P2X7 receptor expression
P2X7 expression is modulated during macrophages differentiation and by treatment with cytokines (Hickman et al., 1994; Blanchard et al., 1991). P2X7 over-expression is also a consequence of INF-γ as well as Con-A or granulocyte macrophage colony-stimulating factor (GM-CSF) treatment (Blanchard et al.; 1991, Falzoni et al.; 1995, Lemaire et al.; 2011).
Mutations in the COOH tail (i.e. Ala>Glu 496) cause loss of function.
Macrophages bearing this mutation recover receptor function if treated with INF-γ (Gu et al.; 2001).
1.2.2) P2X7 and cell cytoxicity
In ‘90s it was suggested that P2X7 was involved in cytotoxic T-cell mediated cytotoxycity, using a perforine independent mechanism (Di Virgilio et al.; 1989, Filippini et al.; 1990, Di Virgilio et al.; 1990).
Later, further studies showed that extracellular ATP via P2X7 was able to trigger killing of ingested bacillus Calmette Guérin (BCG) as well as of the phagocyte by apoptosis. Interestingly, apoptotic death of the phagocyte was required to kill the ingested pathogen, as if the phagocyte died by necrosis, ingested pathogens were quickly released and infected nearby cells (Molloy et al.; 1994).
These intriguing findings implicating P2X7 in the elimination of intracellular parasites were later confirmed by Lammas and colleagues that further extended Molloy’s findings by pharmacologically modulating P2X7 receptor activity with oxidized-ATP or KN-62 (Lammas et al.; 1997). The peculiar mode of operation (as an ion channel and as a non-selective pore) of P2X7 has intrigued investigators even since this receptor was cloned.
P2X7 is a non-desensitizing receptor, in that it remains open during the application of extracellular ATP, but quickly shuts as soon as ATP is
removed. This lack of desensitization generates a reversible plasma membrane pore that can be opened and closed simply by adding or removing ATP from the incubation medium. In general, if the length of the permeabilization is limited to 10–15 min, macrophages recover after resealing and remain capable of performing physiological tasks, including phagocytosis. However, prolonged activation of P2X7 unavoidably leads to cell death (Di Virgilio et al.; 1990). This mechanism determines trans-membrane ion fluxes, trans-membrane depolarization and cellular swelling (Chiozzi et al.; 1997). These changes lead to stimulation stress-responding proteins (Adinolfi et al.; 2003) and caspases (1,3 and 8) (Ferrari et al.; 1999).
Ion fluxes have a main role in P2X7 mediated cytotoxicity, as uncontrolled Na+ and Ca2+ entry trigger apoptotic or necrotic pathways, while K+ efflux is thought to be the main mechanism by which P2X7 drives pro-IL-1β processing.
1.2.3) P2X7 and Apoptosis
We previously mentioned the role played by P2X7 in caspases activation. Caspases are very important proteins in cellular physiology for their key role in cell death and cytokine maturation.
ATP was demonstrated to activate, via P2X7, cleavage of both pro- apoptotic caspases 3 and 8 (Ferrari et al.; 1999) through two different and independent pathways.
Besides, ATP also triggers caspase-1 ICE (Interleukin-1 converting enzyme) activation, via P2X7.
P2X7 also triggers fast activation of stress-activated protein kinase SAPK/JNK in a caspase-indipendent fashion (Humpreys et al.; 2000). SAPK triggers phosphorilation and transcription of factors, such as ATF2, Ets and c-Jun by means of phosphorilation in response to cell stress or cytokine stimulation.
1.2.4) P2X7 and cell growth
Very recently it has been shown that P2X7 has an unsuspected role in cell growth. Human T lymphocytes express an ATP receptor/channel with properties akin to P2X7. It is activated by BzATP and inhibited by oxidized-ATP (oATP). Its activation caused Ca2+ influx and plasma membrane depolarization, but not large pore opening (Baricordi et al.; 1996). Human B lymphocytes espress a receptor with these same properties. Paradoxically, in T lymphocytes, ATP as such has little if any growth-promoting effect and high concentrations (0.5–1 mM) are needed
to trigger Ca2+ influx or plasma membrane depolarization. This
observation was explained later by the finding that T lymphocytes continuously leak ATP, causing the desensitization of the P2X7-like receptor. Apyrase, an ATP-hydrolyzing enzyme, was sufficient to restore a near-normal sensitivity to ATP (Baricordi et al.; 1996). Thus, lymphocytes, like all other cell types, are continuously exposed to autocrine/paracrine stimulation by secreted ATP which likely reaches a much higher concentration in the pericellular space than in the bulk solution.
It is well known that T lymphocytes do not proliferate unless mitogenically stimulated. Depending on the dose and incubation time, extracellular ATP has been reported to have diverse modulatory effects on mouse T lymphocytes, such as stimulation of DNA synthesis and blastogenesis (el-Moatassim et al., 1989; Chused et al., 1996).
On the contrary, in human T lymphocyte ATP has little or no proliferative activity, but rather behaves as a strong co-stimulus when added together with known mitogens such as phytohemoagglutinin (PHA) or anti-CD3 Abs (Baricordi et al.; 1996). Interestingly, mitogenic stimulation by any non-nucleotide stimuli is strongly blocked by pre-incubation in the presence of oxidized ATP (oATP). Curiously, oxidized UTP is almost as potent an inhibitor as oATP, clearly indicating that different compounds able to form Schiff bases with plasma membrane receptors might be valuable as immunomodulators (Rhodes et al., 1996).
However, despite scattered evidence that human-resting non-neoplastic T lymphocytes express the P2X7 receptor but little P2Ys (Baricordi et al.; 1996), the identity of the receptor mediating the growth-promoting effects of extracellular nucleotides in these cells remained largely unknown, till 1999.
To explore the possible contribution of the P2X7 receptor to growth stimulation Baricordi and colleagues investigated the effect of P2X7 transfection in K562 (human erythroleukemia) and LG14 (B-lymphoblastoid cell line) cells. Both cell lines lack endogenous P2X7 and P2Ys receptors. Interestingly, under normal culture conditions, proliferation rate of P2X7-transfected cells did not differ from that of mock-transfected cells; removal of serum did not affect P2X7-transfected cells proliferation rate while proliferation of mock-transfected cells was arrested (Baricordi et al.; 1999). Apyrase, on the other hand, inhibited P2X7 but not mock-transfectants growth, further supporting the role of an ATP-based autocrine/paracrine loop.
Indirect evidence for the role of P2X7 in proliferation came from the finding that peripheral B lymphocytes from patients affected by the aggressive variant of chronic lymphocytic leukemia (CLL) express P2X7 to a level higher than patients with the indolent variant or healthy controls (Adinolfi et al.; 2002).
In B-leukemic lymphocytes, P2X7 stimulation causes a large increase in intracellular Ca2+, while its blockade stops proliferation.
These findings were later extended to HEK293 cells (Human Embryonic Kidney), a cell line lacking endogenous P2X7. Also, in this cell type, transfection of P2X7 conferred a growth advantage as in other model systems shown previously (Adinolfi et al.; 2005).
In 2006, Bianco and co-workers provided an important and independent support to the growth-promoting activity of P2X7 by showing that proliferation of microglia cell clones and primary microglia was modulated by this receptor (Bianco et al.; 2006).
Microglia are resident cells of the brain that participate in reaction to traumas and in defense against foreign microorganisms. When exposed to bacterial products, microglia stop proliferating and differentiate into effector cells. During this process, microglia undergo a profound change of purinergic signalling involving a striking down-modulation of P2X7. This was rather a causal relationship because all treatments that selectively decrease P2X7 expression or function invariably decrease microglia proliferation. Furthermore, microglia cell clones lacking P2X7 are completely insensitive to the proliferation block caused by bacterial products (e.g. lipopolysaccharide).
Thus, these experiments convincingly show that growth promoting activity is a feature of the native as well as recombinant P2X7 receptor.
1.2.5) P2X7 and Cancer
It is clear how important is to understand the molecular basis of P2X7 “Janus behavior”, i.e. P2X7 ability to mediate cell death, on one hand, and cell survival and growth on the other. This is of particular relevance in view of recent evidence implicating P2X7 in cancer. During an investigation of the mechanism underlying P2X7-dependent growth promotion, it was observed that P2X7 transfection into lymphoblastoid or leukemic cell clones, in the absence of any additional stimulation, caused a small but significant increase in resting cytosolic Ca2+ ([Ca2+]
i) levels (Baricordi et al.; 1999).
This finding, together with the observation that P2X7-transfected cells had a thicker mitochondrial network (Adinolfi and Di Virgilio, unpublished observations), focused attention on the mitochondria , a crucial organelle for intracellular ion homeostasis and energy metabolism.
Mitochondria have a key role in cell death, whether by necrosis or apoptosis (Giorgi et al.; 2008), thus it is not surprising that cytotoxicity due to P2X7 stimulation is preceded by mitochondrial swelling or even
disruption of the mitochondrial network (Mackenzie et al.; 2005, Adinolfi et al.; 2005).
However, it is likely that this disruptive effect on mitochondrial physiology and morphology occurs only under extreme pathological conditions, while under more physiological conditions (i.e. no pharmacological stimulation by exogenous ATP), the P2X7–mitochondria liaison might be less catastrophic. Experiments performed with the mitochondrial potential probe TMRM showed that basal P2X7 activation may be not only harmless but even beneficial to mitochondria, as mitochondria of P2X7-transfected cells displayed a membrane potential 20–30 mV more negative than mock-transfected or wt control cells. The hyperpolarized mitochondrial potential was entirely dependent of P2X7 function as it returned to control values following addition of oATP or apyrase, or chelation of extracellular Ca2+ (Adinolfi et al.; 2005).
Starting from these last observations, Ca2+ was hypothesized to be the messenger between P2X7 and mitochondria.
There is a delicate relationship between Ca2+ and mitochondria: on one hand a higher mitochondrial potential enhances the electrochemical gradient for Ca2+ import into the mitochondrial matrix, and on the other,
small increases in the mitochondrial Ca2+ concentration cause
hyperpolarization (Jouaville et al.; 1999).
Mitochondrial Ca2+ in P2X7-transfected cells turns out to be at least twice as high as in mock-transfected or wt cells, and also intra-mitochondrial Ca2+ transients triggered by activation of plasma membrane receptors are several-fold higher than in control cells.
Higher intramitochondrial Ca2+ is fully dependent on influx across the plasma membrane as it reverts to normal level upon chelation of extracellular Ca2+ or addition of apyrase.
Intramitochondrial Ca2+ level is tightly linked to energy metabolism. It was originally showen by Denton and McCormack that three key rate-limiting enzymes in NADH synthesis and oxidative metabolism, pyruvate dehydrogenase, NAD+-isocitrate dehydrogenase and 2-oxoglutarate
dehydrogenase are modulated by Ca2+ (McCormack and Denton.; 1980), and that NADH production is accordingly increased by raising mitochondrial Ca2+.
Altogether, hyperpolarized mitochondrial potential and higher NADH mitochondrial content, lead Di Virgilio and colleagues to put forward the obvious prediction that P2X7-transfected cells should have a more efficient oxidative phosphorylation and higher intracellular ATP content. Thus, they found that P2X7-transfected cells have a total cellular ATP content
four- to six fold higher than wt or mock-transfected cells, as well as faster growth rate (Adinolfi et al.; 2005).
This growth advantage depends on a strong increase in the efficiency of mitochondrial oxidative phosphorylation, an increased cellular ATP content, an improved ER Ca2+ handling, an increased activation of the transcription factor NFATc1 (Adinolfi et al.; 2005, Adinolfi et al.; 2009). P2X7-transfected cells have also an increased motility and a better ability to infiltrate soft agar and undergo metastatic dissemination in vivo (Adinolfi et al.; 2009, Jelassi et al.; 2011).
These features are very much reminiscent of those of cancer cells.
The link between oxidative phosphorylation and cancer has always been ambiguous since the early observations of Otto Warburg (Warburg; 1956). Neoplastic phenotype has often been associated to alterations in mitochondria physiology and morphology, to the point that a defect in oxidative phosphorylation was considered a hallmark of cancer (Kim et al.; 2006, Schulz et al.; 2006).
Although there is no real indication that defective phosphorylation is an absolute feature of cancer cells, there is no doubt that many cancers display aerobic glycolysis.
Glycolytic pathway is much less efficient than aerobic respiration (trough Krebs’ Cycle) as a source of ATP, nevertheless cancer cells may utilize glucose in such an efficient fashion to maintain more than adequate intracellular ATP levels (Kim et al.; 2006).
In any case, whether generated via aerobic respiration or glycolysis, ATP remains the key metabolic factor supporting cell growth. If, as shown by our findings, the P2X7 receptor increases cellular ATP stores and confers growth advantage, it might be expected that malignant tumours overexpress this receptor.
So far, no extensive screening of P2X7 expression in malignant tumours has been performed; however, different laboratories have reported increased expression of this receptor in prostate (Slater et al.; 2004), breast and skin cancers (Slater et al.; 2004, Greig et al.; 2003), neuroblastoma (Raffaghello et al.; 2006), leukemia (Adinolfi et al.; 2002) and thyroid papillary carcinoma (Solini et al.; 2008). In most cases, these studies simply report histological evidence of receptor overexpression in tissue slices. No analysis of receptor function was performed.
In a few studies, P2X7 function has been investigated in cell lines established from the primary tumours (Raffaghello et al; 2006, Solini et al; 2008).
The interesting finding stemming from these more-detailed studies is that the P2X7 receptor in cancer may also support growth by indirect means, for example, by supporting secretion of growth factors.
In human thyroid papillary carcinoma, P2X7 stimulation triggers release of IL-6, a growth factor for thyreocytes (Solini et al.; 2008), while in human neuroblastoma, this receptor supports release of substance P, a growth factor for these cancer cells (Raffaghello et al.; 2006).
Neuroblastoma cells display an additional feature: although P2X7 is fully functional and induces formation of the “large conductance pore”, ATP has little of any cytotoxic effect, as neuroblastoma cells had learned to uncouple pore formation from the death-inducing pathway. This spectacular fashion could be criticized from two points of view, not dismissing one another: it could be as a “death escape” as a “boots to survive” mechanism, not yet well investigated. Looking at the first interpretation (“death escape”), it could be related to a defective activation of caspases, as neuroblastoma cells, in contrast to many other
non-tumour cell types, show no caspase-3 activation in response to P2X7 stimulation. Moreover, looking at the second interpretation (“boots to survive”), P2X7-mediated growth-promoting activity might provide a biological rationale for overexpression of this receptor in cancer as it would be odd, to say the least, if tumours overexpressed a potentially lethal receptor without any advantage for growth or survival.
Then, several potential advantages for cancer cells, expressing P2X7, were hypothesized:
• more efficient mitochondrial metabolism and ATP synthesis; • more active MAP kinase pathway;
• increased ability to release growth- or survival-promoting factors • increased ability to release ATP, which may act as a growth factor
itself, or stimulate release of additional factors.
However, whether cancers really benefit of these potential advantages is, so far, purely speculative as the role of P2X7 in tumor growth and progression has never been investigated till now.
Furthermore, while there is vast literature correlating the drop in mitochondrial potential with apoptosis or with an overall “reduced cellular fitness” under various experimental conditions, very few investigators have explored the link between hyperpolarized mitochondria and tumor growth.
In 2002 and 2003 Damdimopoulos and Heerdt, respectively, reported their observation that mitochondria of cancer cells have an unusually high membrane potential (Damdimopoulos et al.; 2002, Heeredt et al.; 2003). More recently Heerdt and colleagues confirmed and extended their own primary observation also in colonic cancer cells, one of the fastest-growing tumor in the body.
Thanks to these works, a strong correlation was shown to exist between increased mitochondrial potential and
• resistance to hypoxia
• anchorage-independent growth
The biochemical mechanism by which an increased mitochondrial potential allows better survival and growth is unknown, but Di Virgilio group’s finding that cells with hyperpolarized mitochondria accumulate higher cellular ATP stores may provide a reasonable physiological explanation as energy stores are a pre-requisite for any cell function.
Finally, a crucial question is whether enough ATP accumulates in tumor interstitium to activate the low affinity P2X7 receptor.
In fact, it is well known that in vitro P2X7 stimulation requires an ATP concentration of hundreds of micromolar, if not millimolar, levels that are supposed to be almost impossible to achieve in vivo.
A recent study of ours showed, on the contrary, and rather surprisingly, that such high ATP levels, although unattainable within healthy tissues, may be reached in the tumour interstitium (Pellegatti et al.; 2008).
A new role for extracellular ATP is recently planted in tumorigenic events and treatments.
In fact, increase of extracellular ATP concentrations is supposed to improve the efficiency of antineoplastic chemotherapies (Michaud et al.; 2011). It seems some successful chemotherapeutics can induce tumor cell stress and death by immunogenic stimulation. Dyeing tumor cells expose calreticulum (CTR) on the membrane surface as a consequence of endoplasmic reticulum stress, they can release chromatin-binding protein high mobility group B1 (HMGB1) in post-apoptotic phase and secrete ATP. CTR, HMGB1 and ATP are known to interact respectively with CD91, toll-like receptor 4 (TLR4) and P2X7 receptor of dendritic cells (DCs). These interactions make presentation of tumor antigens and production of interleukin-1β. These two effects may determine immune system cells recruitment, on one hand, and the MHC formation on the other, implicating a Immune System itself involvement in tumor progression and depletion.
1.3) Cell metabolism in cancer – Warburg Effect
In previous paragraphs we discussed the correlation between P2X7 expression and tumorigenic characteristics, such as cellular growth (even in growth factors depletion), increased intracellular ATP contents in cancer cells, as well as an increased mitochondrial membrane hyper polarization, associated to a higher mitochondrial functionality. All this led us to hypothesized a direct effect of P2X7 expression and functionality on cell metabolism.
Every kind of cell ménages its own energy trough mitochondrial respiration (oxidative phosphorylation). During this process cells convert one molecule of glucose in 36 molecule of ATP, plus CO2 and H2O.
On the contrary, glycolysis is the anaerobic catabolism of glucose, that is converted in lactate by LDH (Lactate De-Hydrogenise), when oxygen is depleted. It is rather so for example during an intense prolonged exercise in muscle as much as in tissues voted to fats metabolism (such as epatocytes and pancreatic cells). During this metabolic switch, one molecule of glucose generates 2 molecules of ATP.
Glycolysis is also known as the Embden‐Meyerhof pathway, from the pioneering work of Gustav Embden & Otto Meyerhof, who through ‘20s and ‘40s elucidated the complete glycolitic pathway.
In 1924 Otto Warburg was the first to report that liver cancer cells compared to normal liver tissue, exhibited an increase in glycolytic activity in oxygen presence (Warburg and Negelein; 1924). In 1956 he showed that this characteristic metabolism did not exist only in solid tumors, but also in leukemia cells cultured in presence of oxygen (Warburg; 1956). These consistent observation led Warburg to hypothesize that such metabolic alteration in cancer cells was due to respiratory injury and was meant to be “the origin of cancer cells” (Warburg; 1956).
Then, the assertion that cancer cells, originated from non-neoplastic cells, acquired a permanent respiratory defect that bypassed the Pasteur effect
(i.e. the inhibition of fermentation by oxygen) was called “Warburg Effect” (fig. 5).
From that moment, looking at neoplastic alterations, a gradual and cumulative decrease in mitochondrial activity was commonly associated with malignant transformation.
It is known that under aerobic condition, some tumor cells produce as much as 60% of their ATP trough glycolisis (Nakashima et al.; 1984). In conclusion, recent investigations into the mechanisms that underlie the Warburg effect may suggest that:
• mitochondrial uncoupling can promote aerobic glycolysis in the absence of permanent and transmissible alterations to the oxidative capacity of cells
• aerobic glycolysis may represent a shift to the oxidative metabolism of non-glucose carbon sources
• mitochondrial uncoupling may be associated with increased
resistance to chemotherapeutic insults (Samaudio et al.; 2009). The notes reported above highlighted the importance of understanding the mechanisms of mitochondrial uncoupling and their relation to metabolic alterations observed in cancer cells.
More in details, glycolysis can be separated into two different phases: the first is the one requiring energy in the form of ATP, while the second is considered the energy‐yielding phase. In the first phase, 2 equivalents of ATP are used to convert glucose to fructose 1,6 - bisphosphate (F1 6BP). In the second phase F1,6BP is degraded to pyruvate, with the production of 4 equivalents of ATP and 2 equivalents of NADH (fig. 6).
Pyruvate doesn’t proceed in Citric Acid Cycle (Krebs’ Cycle), but is then converted in lactate.
A paradox was generated: why should a fast growing cell switch metabolism to follow the disadvantaged one (36 molecules of ATP vs 2 molecules of ATP)? The most recent theory is based on the fact (actually under further investigations) that fast growing cells (i.e. cells characterized by a large number of mitosis) may need carbon subunits for
nucleotides, aminoacids and lipids synthesis. In fact, for example it is known that for Palminate synthesis (during fatty acids cycle) 7 molecules of ATP, 16 atoms of carbon, 8 molecules of acetil-CoA and 14 molecules of NADPH are request.
Lactate surplus produced during aerobic glycolysis is released by the cells and contributes to create the characteristic acidification of tumor microenvironment, as well as ATP.
Nowadays, even though Warburg effect molecular bases are not completely understood, detection of altered glucose uptake (and metabolism) in tissues is commonly used for diagnosis of cancer with Positron Emission Tomography (PET) (fig. 7). This technique uses a glucose analog (Fluor-Desox-Glucose, FDG), with a small radioactive molecule (18F, Fluor 18). FDG is injected trough vessels and it’s captured by tissues proportionally as they need. Tomography machine reveals 18F signal.
Fig. 5. Warburg effect, schematic representation.
Fig. 7. PET scan of body (right side), coupled with CT/TAC test (left side)
1.4) Glucose deprivation and Warburg Effect
Previously we pointed out how glycolysis works and how important glucose availability is for the cell. Glucose is the most important substrate used for generation of ATP or building blocks for nucleic acid, amino acid or lipid synthesis. Never the less, adaptation to limited nutrient supply is a key survival factor for normal and transformed cells (Hanahan et al.; 2011). This phenomenon involves complex biochemical and metabolic changes that affect ATP synthesis and production of intermediates needed for the synthesis of basic cell constituents (lipids and nucleic acid).
Glucose deprivation triggers a complex adaptation response referred to as unfolded protein response (UPR) that involves mainly, but not exclusively, the endoplasmic reticulum (ER). UPR allows a profound re-shaping of cancer cell metabolism that increases survival, progression and resistance to chemiotherapics (Zhang et al; 2006).
The molecular basis of the better adaptation of tumours to low glucose is not clear, albeit several mechanisms have been invoked, such as a re-programming of mitochondria, repression of the CC3/TIP30 gene, or down regulation of specific miRNA (e.g. miR-451) (Chen et al.; 2010, Haga et al.; 2010, Godlewiski et al.; 2010).
In our opinion, tumour adaptation to low glucose intersects with the other burning aspect of cancer cell biology, the re-discovered (and yet described) Warburg effect.
1.5) Activation of proteins, involved in metabolism progression, can act as check points.
1.5.1) Glycolisis enzymes.
Aerobic glycolysis involves, and might be modulated by, changes in the expression of several enzymes of the glycolytic pathway, e,g, hexokinase (HK), phosphofructokinase (PFK), glyceraldehyde 3-phosphate (Ga3P), pyruvate kinase-M2 (PK-M2), as well as enzymes specifically controlling pyruvate entry into the Krebs cycle such as pyruvate dehydrogenase kinase (PDHK) (Annibaldi et al.; 2010).
If and how these enzymes are also modulated in conditions of limited glucose availability is actually under investigation.
As we reported before, glucose deprivation is known to activate oncogenes. These can upregulate proteins involved in aerobic glycolysis. In turn, proteins implicated in increased glycolysis can make tumor cells more resistant to apoptosis. Aerobic glycolysis is known to induce acidification of the tumor environment, favoring the development of a more aggressive and invasive phenotype (Hanahan et al.; 2000). This phenomenon could be due to the lactate release.
Altering the pH around tumors might represent a way to hamper tumor development as suggested by a recent work demonstrating that
bicarbonate, which increases the pH of tumors, prevented spontaneous metastatization (Robey et al.; 2009).
1.5.2) Glucose transporters.
Glucose is imported into the cells trough glucose transporters (Kasahara and Hinkle; 1977, Koivisto et al.; 1991). Glucose transporters are four (GLUT-1, GLUT-2, GLUT-3 and GLUT-4), with different affinity, but only two of them have the highest once: GLUT-1 (1.3 mM) and GLUT-4 (5.6 mM). GLUT-4 is the one involved in accumulating intracellular stores (Koivisto et al.; 1991), in fact it is shown to be activated by insulin receptor during metabolic diseases (i.e. diabetes), mediating a slow exocytosis and fast endocytosis (Satoh et al, 1993; Li et al, 2001).
On the contrary, GLUT-1 is the one mediating direct and ready to use glucose transport (Bucci et al.; 2011). It is ubiquitous because it provides the basal glucose uptake, not insulin dependent.
Moreover GLUT-1 is highly expressed in erythrocytes and brain (Mueckler et al, 1994).
Recent evidences show GLUT-1 over-expressed also in fast growing and neoplastic tissues (Airley et al.; 2001, Brown et al.; 2006).
Studies with cultured mammalian cells support the item that glucose regulates its own transport and metabolism as evidenced by increasing glucose uptake, in response to glucose starvation in fibroblasts (Germinario et al.; 1984, Ullrey et al.; 1975, Yamada et al.; 1982), cardiocytes (Paris et al.; 1980), adipocytes (van Putten et al.; 1985), glial (Walker et al.; 1988) and muscle (Walker et al.; 1989) cells.
More recently other glucose transporters have been characterized: EST (Expressed Sequence Tag) database catalogued them in classes II and III Transporters, concerning to homologies into the sequence (Maier et al.; 2002).
Class II transporters are mainly expressed by the luminal membrane of small intestine epithelial cells and also present at lower levels in other tissues, such as kidney, brain, fat, testis, and muscle (Burant et al, 1992; Shepherd et al, 1992; Concha et al, 1997), small intestine and colon (Li et al, 2004), leukocytes, testis, and sperm (Phay et al, 2000; Carayannopoulos et al, 2004; Kim and Moley, 2007), pancreas, kidney, and placenta and, to a lower extent, in heart and slow-twitch skeletal muscle, particularly in intracellular structures (Doege et al, 2001b; Scheepers et al, 2004). Some of them are specific for fructose, instead of glucose.
Class III transporters are structurally different from the others (Scheepers et al, 2004) and are mainly glucose transporters.
1.5.3) Activation of PI3K/Akt pathway supports cell proliferation in cancer.
One more protein over-expressed and more functional in tumors is Serin-Treonin kinase Akt/PKB. Originally it was identified in mammalian as viral oncogen v-Akt omologue and was demonstrated to induce leukaemia in mouse (Bellacosa et al.; 2005). Akt is known to be directly activated by PI3K (Phosphoinositide 3-kinase), in response to stress (Borgatti et al.; 2003), but other pathways are nowadays thought to induce Akt activation independently by PI3K. At the moment all these alternative paths are under further investigation.
In classical pathway, the one involving PI3K, after stimulation of membrane receptors (such as grow factor receptor, insulin receptor) induces conversion of membrane PIP2 (phosphoinositide 2 phosphate) in PIP3 ( phosphoinositide 3 phosphate) by PI3K. Akt captures PIP3 in its PH domain and moves to the membrane where subsequent phosphorilations activate kinase activity of Akt , i.e. Akt is able to activate other effectors (fig. 8).
Maximal activation of kinase Akt runs through self-phosphorilation in Serin473 and Treonin308 (Delcommenne et al.; 1998, Shaw et al.; 1998, Toker and Newton; 2000, Laine et al.; 2000).
Once activated, Akt can also move into the nucleus and prime other nuclear proteins as well as transcription factors (Borgatti et al.; 2003). It was demonstrated that a membrane stimulation can cause several falls-reactions that can modify nuclear lipids metabolism (Michell et al.; 1992, Divecha et al;1993, Martelli et al.; 1999).
Activation of PI3K/Akt pathway has been correlated with a lot of cellular critical events, like proliferation, apoptosis regulation, energetic metabolism, esocytosis and endocytosis, adhesion, vesicle traffic and cytoskeleton regulation ( Martini et al.; 1998, Fruman et al; 1998, Neri et al.; 2002).
Apoptosis resistance, in hypoxia, was directly correlated to PI3K/Akt activation because of direct activation of GSK-3β (Glycogen Synthase Kinase 3-β ) (Risbud et al.; 2005), REDD1 factor over-expression (Schwarzer et al.; 2005) and transcription factors HIF1α and p300 modulation (Ardyanto et al.; 2006).
Nevertheless, PI3K/Akt activation is commonly associated to tumorigenic transformation, metastatic events and drugs resistance in chemotherapy (Neri et al.; 2002).
More recently, Akt was suggested as regulator of metabolism and progression of tumors (Krzeslak; 2010), while the whole PI3K/Akt/mTOR pathway was supposed to became a therapeutic target for neuroblastoma disease (Fulda et al.; 2009) and leukaemia (Martelli t al.; 2010).
In 2004 Jacques-Silva and colleagues started to investigate if there was a direct connection between P2X7 and Akt activation in astrocytes (Jacques-Silva et al.; 2004).
2) Aim of the study
It has been demonstrated that Purinergic receptor P2X7 play an important role in modulating important physiological cellular activity.
We reported evidence according to which P2X7 regulates survival and cell growth as well as cell death and apoptosis.
We underlined how important its main ligand (ATP) is in modulating P2X7 functionality. Moreover we reported modification occurring to mitochondria when P2X7 is expressed.
P2X7 over-expression was related to tumor progression and aggressive phenotype.
We analysed glycolysis and its modification in cancer cells, but also how important is glucose deprivation in forcing tumorigenesis and, perhaps, metabolism switch.
Aim of the present study is:
• Verify the effect of P2X7 on cellular metabolism under conditions of limited nutrient supply;
• Investigate the possible role of P2X7 in the Warburg Effect;
• Unveil the pathway responsible for Warburg Effect in
P2X7-expression cells;
• Hypothesise a possible role for P2X7 receptor as pharmacological target for tumors treatments.
3) Materials and Methods 3.1) Cells maintenance
HEK293 cells were cultured in DME/F-12 1:1 medium (Sigma, St. Louis, MO) containing 15% heat-inactivated FCS (Life Technologies, Paisley, Scotland), 100 U/ml penicillin, and 100 μg/ml streptomycin. Stable clones were cultured in the same medium containing G418 sulfate (Geneticin; Calbiochem, La Jolla, CA) at a concentration of 0.2 mg/ml. Visualization of transfected cells was performed in a saline solution (standard saline
solution) containing 125 mM NaCl, 5 mM KCl, 1 mM MgSO4,1 mM
Na2HPO4, 5.5 mM glucose, 5 mM NaHCO3, 1 mM CaCl2, and 20 mM
HEPES (pH 7.4).
ACN neuroblastoma cells were maintained in RPMI (Celbio EuroClone) supplemented with 10% fetal calf serum, 100 U/ml penicillin and 100μg/ml streptomycin (all from Celbio EuroClone) and 1% non-essential amino acids (GIBCO, Life Technologies, Paisley, Scotland). Cells were detached with the Cell dissociation solution (Sigma-Aldrich). Cells were plated in 75cm2 Falcon flasks (Microtec, Naples, Italy) and incubated at 37C in humidified incubator in the presence of 5% CO2.
3.2) Transfection of HEK293 Cells and Selection of Stable Clones HEK293 wt cells were transfected with calcium phosphate. Briefly, the first day, 2.5 × 10⁶ HEK293 cells were plated in Petri dishes. The second day, for each dish, 30 μg of plasmid DNA was resuspended in a total volume of 450 μl TE (10 mM Tris, 1 mM EDTA, pH 8) and then 50 μl of a 2.5 M CaCl2 solution was added. This solution was added dropwise under vortexing to a tube containing 500 μl of 2× HBS (280 mM NaCl, 50 mM HEPES, 1 mM
Na2HPO4, pH 7.12, at 25°C). After a 30-min incubation at room
temperature, the DNA precipitate was added to the dish dropwise. The third day medium was changed. The fourth day, G418, 0.8 mg/ml, was
added to fresh medium to select transfected clones. After clone selection, the selective medium contained G418, 0.2 mg/ml.
Transient transfection was performed using the same procedure directly on coverslips for 0.5 × 10⁶ cells, 4–8 μg of plasmid DNA in a total volume of 90 μl TE, 10 μl of CaCl2 solution, and 100 μl of 2× HBS. The plasmid containing rat P2X7-GFP in pcDNA3 used for stable transfection was kindly provided by Dr. Annemarie Surprenant (University of Sheffield, UK).
3.3) Cell lines and proliferation assay.
For cell proliferation assay, 5 x 10⁴ cells/well were plated in Falcon multi-well plates over night with completed media.
The morning after media was changed and serum starvation and glucose depletion started. That was the zero point (T0).
Cells were counted at T0 and every 24h (to 48 hours) from media changing.
3.4) Treatments and drugs.
All experiments were performed in the absence of serum (e.g. serum-free DMEM or serum-free RPMI media). Low glucose experiments were performed in the presence of 4 mM glucose (glucose-DMEM or low-glucose RPMI, from Sigma-Aldrich or CellbioEuroclone, respectively). Cells were plated overnight in complete medium, then this medium was replaced with serum- or serum/glucose-free medium for the next 4 hours. ATP (Roche, Milan, Italy) was used at a concentration of 1 mM, FCCP (Sigma-Aldrich) was used at a concentration of 250 nM, the P2X7R inhibitor A 740003 (Tocris Bioscience, Ellisville, MS, USA) was used at a concentration of 200 μM. Mitochondria were stained with the potential-insensitive green stain Mito Traker Green (Invitrogen Italia, Milan, Italy), and the potential-sensitive red stain Tetramethyl rhodamine methyl ester (TMRM, Invitrogen). TMRM was stored as a 10 mM stock solution in
ethanol, while Mito Traker Green was stored as a 100nM stock solution in DMSO (Sigma-Aldrich).
3.5) Measurement of intracellular ATP
Intracellular ATP levels were measured by luminometric assay using the Enliten ATP assay system (Promega). 15 x 103 cells/sample were lysed with 10 μl lysis buffer (FireZyme, San Diego, USA), and supplemented with 90 μl of diluent buffer (FireZyme) to stabilize ATP. Samples were then placed in a Victor 3 multilabel counter (Perkin Elmer) equipped with a Wallac liquid injector (Perkin Elmer) that allowed rapid injection of the luciferin-luciferase solution (100 μl).
3.6) Lactate measurement
25 x 103 cells/well were plated in the different media as described above. Supernatants were withdrawn at the various time-points and lactate release was measured with a Lactate Colorimetric Assay Kit (Abcam, Cambridge, UK), according to manufacturer’ s indication.
3.7) Real-Time PCR
Real-time PCR was performed in a Step One Real-Time PCR system (Applied Biosystems). 106 cells/well were plated under the different experim ental conditions. Total RNA was extracted with TRIZOL reagent (Invitrogen, Paisley, Scotland). Reverse transcription was performed starting from 1 μg of total RNA/well, with the High Capacity cDNA Reverse Transcription kit (Applied Biosystems) as described by the manufacturer. Two microliters of cDNA were used as template. Amplification was performed with custom-made primers and Taqman probes (Applied Biosystems) as detailed below, and with an internal P2Y1 reference (Pre developed Taq Man assay reagents, Applied Biosystems). A comparative CT analysis (ΔΔCT) was done to allow determination of the change of
expression (fold increase) of the target cDNA in the experimental samples relative to the reference sample.
3.8) Western Blot Analysis.
Cells were plated at the concentration of 5 x 10⁵ per well. Proteins were
extracted in ice-cold, Ca2- free, lysis buffer containing
phenylmethylsulfonyl fluoride (PMSF, 1 mM), benzamidine (1 mM) and 0,1% Triton (all by Sigma-Aldrich), processed and blotted as described previously (Adinolfi et al.; 2002). Membranes were incubated with the primary mAbs overnight at 4° C. The following mAbs were used: PKM2, PDHK1, Glut1, Ph-Akt/PKB (Ser473) and anti-Akt/PKB (all from Cell Signaling, Milan, Italy), at a dilution of 1:1000 in TBS-t buffer (TBS with 0.1% Tween 20) supplemented with 1% BSA. An anti-actin mAb, diluted 1:500 (Sigma-Aldrich), was used as loading control. Then membranes were incubated with a secondary goat anti-rabbit, HRP conjugated antibody (Bio-Rad, Kobenhavn, Denmark) diluted 1:3000 in TBS-t buffer. Bands were visualized by enhanced chemiluminescence detection kit (Amersham, GE Healthcare, Milan, Italy). Densitometric analysis of the protein bands was carried out with the Alpha VIEW program (Alpha Innotech Corporation, San Leandro, CA). Band densitometry was normalized on the actin ratio.
3.9) Visualization of mitochondria and semi-quantitative evaluation of mitochondrial potential
Cells, plated onto 24-mm glass coverslips, were loaded with 1μM Mitotracker-green and 20 nM TMRM in the different culture media for 30 min at 37°C. At the concentration used, TMRM is mainly localized in the mitochondria emitting a level of fluorescence proportional to the absolute value of mitochondrial potential (Adinolfi et al.; 2005). Confocal images were acquired with a Zeiss LSM 510 confocal microscope equipped with a
plan-apochromat 63x oil immersion objective (Carl Zeiss, Oberkochen, Germany) as previously described (Adinolfi et al.; 2005).
3.10) Glycogen store detection
Cells, 25 x 103, were plated overnight in Polylisin 1X-coated, UV sterilized- 24-well plates were pre-treated. Glycogen was revealed with PAS (Periodic Acid-Schiff) Kit (Sigma-Aldrich). Cells were fixed with methanol 96% (Sigma-Aldrich) and processed as suggested by the manufacturer.
3.11) Data analysis.
All data are shown as mean ± sd. Tests of significance were performed by Student’s t test using GraphPad InStat software (GraphPad, San Diego, CA, USA).
4) Results
4.1) Growth promotion effect of P2X7 in serum and glucose deprivation
We have previously shown that under conditions of limited nutrient supply (i.e. serum starvation), expression of the P2X7R confers a strong growth advantage to various human cell lines (Baricordi et al.; 1999, Adinolfi et al.; 2005).
The trophic effect of P2X7 is at least partially mediated by an increased
efficiency of Ca2+ handling by the ER, an improved oxidative
phosphorylation and a strong activation of the transcription factor NFATc1 (Adinolfi et al.;2005, Adinolfi et al.;2009). This suggests that P2X7 increases cell adaptation to unfavourable environmental conditions. Glucose starvation, an additional condition of reduced nutrient supply often occurring in several physiological or pathological states, triggers a complex array of adaptive responses involving a thorough reprogramming of metabolic pathways, and often culminating in the UPR (Mori et al.; 2000).
Figure 9A shows that growth of HEK293-P2X7 cells proceeded unimpeded in serum-free, low glucose medium, while on the contrary proliferation of HEK293-mock cells was fully abrogated. The mechanistic basis of the growth-promoting effect of the P2X7R are not fully understood, however we have shown that an improved energy metabolism is likely to play an important role as P2X7R expression increases mitochondrial potential and improves mitochondrial ATP synthesis (Adinolfi et al.;2005).
4.2) ATP production in HEK293, transfected with P2X7R, decreases during glucose depletion
Figure 9B shows that an improved energy metabolism is a feature of HEK293-P2X7 cells in low glucose, as total cellular ATP content under this condition of extreme nutrient deprivation is almost two fold higher than in HEK293-mock cells. However, low glucose affected ATP synthesis of P2X7R-lacking to a larger extent than that of P2X7R-expressing cells, as physiological/low glucose ATP ratio dropped from 2.4 to 1.6 in HEK293-P2X7 and HEK293-mock respectively. This finding was surprising since, due to a more efficient mitochondrial metabolism of HEK293-P2X7 compared to HEK293-mock (Adinolfi et al.; 2005), we anticipated that ATP synthesis in HEK293-P2X7 cells should be less sensitive to glucose deprivation.
4.3) Lactate release in HEK293, transfected with P2X7R, increases during glucose depletion
In order to assess the relative contributions of glycolysis and oxidative phosphorylation to ATP synthesis in the presence or absence of P2X7R, we measured lactate generation in physiological and low glucose.
As shown in Figure 9C, in physiological glucose HEK293-P2X7 cells released about twice as much lactate as HEK293-mock cells.
Lowering glucose medium strongly increased lactate output in both P2X7 (from 0.285 to 0.756 nmoles/L/ug protein) and HEK293-mock (from 0.183 to 0.388 nmoles/L/ug protein).
Increase in lactate output caused by incubation in low glucose was larger in HEK293-P2X7 than in HEK293-mock as the low glucose/physiological glucose lactate output ratio was 2.65 and 1.91 for HEK293-P2X7 and HEK293-mock, respectively. This experiment gives two relevant pieces of information: a) basal P2X7R expression per se increases lactate output,
and b) HEK293-P2X7 cells produce more lactate in response to nutrient starvation.
4.4) Stimulation of P2X7R mediates lactate release increase in HEK293
Mitochondrial uncoupling is one of the most potent stimuli for lactate production (Samudio et al.; 2009). Pharmacological stimulation of P2X7R by exogenous ATP causes Ca2+ overload of mitochondria, mitochondrial potential collapse and uncoupling (Adinolfi et al.;2005).
Thus, we tested the effect of stimulation with extracellular ATP on lactate output. Figure 10 shows that ATP is a powerful stimulus for lactate production, whether in physiological or low glucose, but only in HEK293-P2X7 cells, as expected. To validate the effect of exogenous ATP we tested the mitochondrial uncoupler FCCP which triggered a large lactate production, in physiological as well as low glucose. Very interestingly, lactate stimulation by carbonylcyanide p-trifluoromethoxyphenylhydrazone (FCCP) was dependent on the presence of P2X7R.
Experiments described so far were performed by expressing P2X7R in cells that do not normally express this receptor.
Fig. 9. P2X7R expression stimulates cell metabolism. HEK293-P2X7 (open bars) and HEK293-mock cells (closed bars) were incubated in 17mM- or 4mM glucose-supplemented medium, and cell proliferation (panel A), intracellular ATP content (panel B) and lactate output (panel C) were measured as described in Materials and methods. Intracellular ATP and lactate output were assessed after a 24 h incubation under the different experimental conditions. Data are averages + SD of multiple determinations (n = 9 for ATP measurements; n = 12 for lactate measurements). Statistical significance, * p < 0.05; ** p < 0.03.
4.5) Blockade of P2X7R mediates lactate release decrease in ACN neuroblastoma cells
To check if the native P2X7 receptor has a similar effect on lactate output we turned to the human neuroblastoma ACN, a cell line previously characterized for P2X7 expression in our laboratory (Raffaghello et al.; 2006). As shown in Figure 11, lactate production by ACN cells was stimulated by exogenous ATP, and was abrogated by the selective P2X7 blocker A740003.
These results suggest that P2X7R is able to modulate glycolytic metabolism under different conditions: a) basal conditions, b) upon stimulation with extracellular ATP, and c) in the presence of uncoupled mitochondria. We then set to identify the mechanisms involved.
Fig. 10. P2X7 expression is needed for ATP or FCCP-stimulated lactate output. HEK293-P2X7 (open bars) and HEK293-mock cells (closed bars) were incubated in 17mM- or 4mM glucose-supplemented medium for 24 h in the absence or presence of either ATP or FCCP. Data are averages + SD of multiple determinations (n = 3). Statistical significance, * p < 0.05; ** p<0.03.
Fig. 11. Lactate release is dependent upon P2X7 stimulation in the human neuroblastoma ACN cell line. 25 x 103 ACN cells/well were plated in high (11 mM) (open bar) or low (4
mM) (closed bar) glucose medium and lactate release measured after a 24 h incubation in the absence or presence of either ATP or the selective P2X7 blocker A740003. Data are averages + SD of multiple determinations (n = 3). Statistical significance, * p < 0.05; ** p<0.03.
4.6) G3PDH is up-regulated in HEK293 during glucose depletion
A key enzyme controlling glycolysis is glutheraldehyde 3-phosphate dehydogenase (G3PDH) which catalyzes specifically catalyzes phosphorylation and oxidation of glyceraldehydes-3-phosphate to 1,3-bisphosphoglycerate in the glycolytic cascade.
The G3PDH gene is up-regulated following stimulation of glycolytic metabolism, especially in cancer cells (Altenberg et al.;2004).
Figure 12A shows that G3PDH levels are over 3-fold higher in HEK293-P2X7 versus HEK293-mock cells in physiological glucose. In low glucose G3PDH expression increases further in both cell types, but much to a much larger extent in HEK293-P2X7 than in HEK293-mock cells, thus raising the fold increase to 4.60. Two other key check-point enzymes in glycolysis often upregulated in cancer cells are pyruvate kinase M2 (PK-M2) and pyruvate dehydrogenase kinase1 (PDHK1) (Vander Heiden et al.; 2009).
4.7) PK-M2 expression is enhanced in HEK293 during glucose depletion
Figure 12B shows that in low glucose level of expression and phosphorylation of PK-M2 is enhanced in HEK293-P2X7 compared to HEK293-mock cells.
PK-M2 generates pyruvate from phosphoenol-pyruvate and preferentially poises pyruvate for degradation to lactate, minimizing its transfer to the mitochondria.
4.8) PDHK1 is more activated in HEK293 during glucose depletion
PDHK1 phosphorylates and thus inactivates pyruvate dehydrogenase, the key enzyme controlling pyruvate entry into Krebs cycle. The net effect of PK-M2 and PDHK up-regulation will thus be an inhibition of mitochondrial functions and a preferential diversion of pyruvate to lactate.In low glucose condition PDHK1 was also overexpressed in HEK293-P2X7 cells (fig. 12C).
Fig. 12. P2X7 expression causes overexpression of the key glycolytic enzymes G3PDH, PK-M2, and PDHK1. HEK293-P2X7 (open bars) and HEK293-mock cells (closed bars) were incubated in 17mM- or 4mM glucose-supplemented medium, and G3PDH, PK-M2 and PDHK1 expression were measured by quantitative PCR (G3PDH, panel A) or Western blot (PK-M2 and PDHK1, panels B and C). G3PDH mRNA content is expressed as a RQ ratio normalized onto P2Y1 mRNA. Protein bands in panels B and C were quantified by densitometry and normalized onto endogenous actin band. Statistical significance , * p < 0.05; ** p<0.03.
4.9) Glucose depletion causes mitochondria depolarization and swelling in HEK293
To verify this hypothesis we performed a semi-quantitative assay of mitochondrial function in vitro using two selective fluorescent mitochondrial probes: Mito Tracker green and TMRM.
Mito Tracker green accumulates into the mitochondria in potential-insensitive fashion, thus allowing a precise morphological identification of these organelles independently of their energy charge. On the contrary, TMRM is a potential-sensitive dye that localizes to the mitochondria in a mitochondrial potential sensitive fashion, and thus allows to measure the energy state of mitochondria.
Figure 13, A and B, shows that, in agreement with our previous findings (Adinolfi et al.; 2005), HEK293-P2X7 cells show a larger TMRM uptake, to witness higher mitochondrial potential, compared to HEK293-mock. In low glucose mitochondrial potential of HEK293-P2X7 dropped to about the same level as that of HEK293-mock, indicating that glucose deprivation inhibited mitochondrial function.
Mito Tracker green staining shows that in physiological glucose mitochondria of HEK293-P2X7 cells were thicker and swollen, while those of HEK293-mock were organized in the typical ramified network.
In low glucose, alongside with the collapse of mitochondrial potential, we also observed fragmentation of the filamentous mitochondrial network in both cell types, an indication of mitochondrial injury.
Fig. 13. Glucose depletion causes a decrease in mitochondrial potential. HEK293-P2X7 (A) and HEK293-mock (B) cells were incubated under the different conditions for 24 h, and at the end of this incubation were labeled with TMRM (panels a and d) and Mito-Traker Green (panels b and e). Image acquisition and analysis were performed as described in Materials and methods. Panels c and f show merge of the red and green channels.
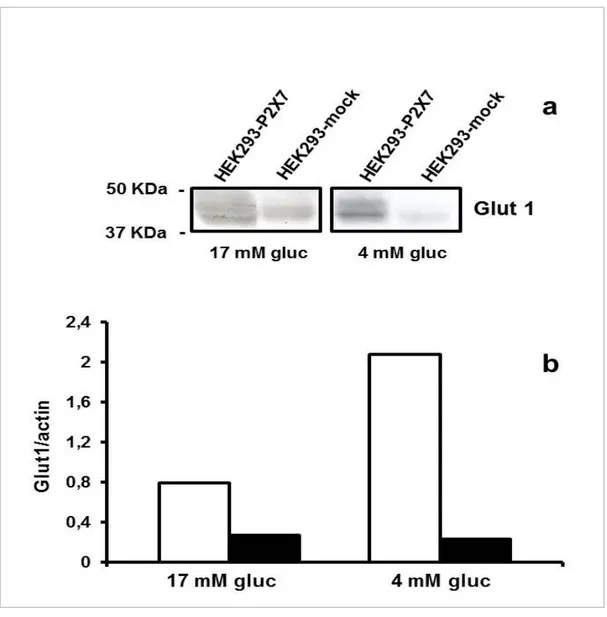
4.10) Glucose depletion increases glucose uptake by enhancing GLUT-1 transporter expression in HEK293
These data indicating a shut-off of mitochondrial energy metabolism in low glucose suggest that under nutrient deprivation HEK293 cells should increase their ability to use glucose, and thus improve glucose uptake. The main membrane carrier responsible for non-insulin-dependent glucose uptake is Glut-1.
Figure 14 shows that HEK293-P2X7 cells had a higher level of expression of Glut-1 both in physiological and low glucose. This suggests that HEK293-P2X7 cells may adapt to low nutrient conditions by up-regulating expression of glucose carrier thus maximizing nutrient uptake.
However, it has been recently reported that glucose deprivation also increases use of intracellular glycogen stores in tumour cells (Kang et al.; 2009).
4.11) HEK293 cells use intracellular glycogen stores to support glycolysis during glucose depletion
Therefore we checked whether HEK293 cells might also compensate reduced glucose supply by degrading intracellular glycogen.
As shown in Figure 15, glycogen stores were higher in HEK293-P2X7 than in HEK293-mock cells. Incubation in low glucose medium caused a fast depletion of glycogen stores, thus presumably providing glucose for glycolysis and lactate generation. Therefore, P2X7R expression allows cells to exploit multiple sources of glucose, exogenous and endogenous, to support glycolytic metabolism.
Fig. 14. Glucose depletion causes up-regulation of Glut-1 in HEK293-P2X7 but not in HEK293-mock cells. Samples were processed as described in Materials and methods and protein bands were quantified by densitometry and normalized onto endogenous actin band. HEK293-P2X7, open bars; HEK293-mock, closed bars. One experiment representative of four similar is shown.