UNIVERSITY OF TUSCIA
VITERBO, ITALY
DEPARTMENT FOR INNOVATION IN BIOLOGICAL,
AGRO-FOOD AND FOREST SYSTEMS (DIBAF)
Ph.D. Course in
Forest Ecology - XXIV Cycle
INTERWEAVING FORESTS INTO SOCIETY:
TOWARDS LON-TERM IMPACTS AND SUSTAINABILITY
OF FORESTRY PROJECTS IN GUINEA
(AGR/05)
Ph.D. thesis by
Mr. Paolo Ceci
Coordinator
Prof. Paolo De Angelis
Tutor
Prof. Giuseppe Scarascia-Mugnozza
Co-tutor
Dr. Thomas Hofer
i
ACKNOWLEDGMENTS
The list of people I wish to thank is long. In particular (in alphabetical order):
Mr. Atigou Baldé and the ULAP members of Mamou and Labé
Dr. Frank Beernaert and his family
Ms. Nora Berrahmouni
Prof. Giacomo Branca
Mr. Jim Carle
Dr. Clara Cicatiello
Dr. Alberto Del Lungo
Prof. Paolo De Angelis
Ms. Fatoumata Binta Sombily Diallo and her family
Mr. Mamadou Aliou Diallo
Mr. Mamadou Oury I Diallo
Mr. Mohamadou Diallo
Mr. Thierno Abdoulaye Diallo
Mr. Thierno Sadou Kérenta Diallo and the NGO VAATEC
Prof. Silvio Franco
Dr. Thomas Hofer
Ms. Marketta Juppi
Ms. Lavinia Monforte
Prof. Mariano Pavanello
Prof. Giuseppe Scarascia-Mugnozza
Ms. Antonella Sorrentino
Ms. Assiatou Sow
Mr. Venanzio Vallerani
Ms. Petra Wolter
ii
ABSTRACT
The official development assistance funding for forestry can be estimated at least at US$ 1.1 billion per
year. Forestry is crucial for the development cooperation sector as it combines ecological and
socio-economic concerns. Accordingly, forestry projects can have multiple objectives and tend to apply
integrated approaches to reverse detrimental agro-pastoral and extraction practices.
Yet, understanding the long-term impacts of these interventions can be tricky. Following the standard
Project Cycle Management (PCM), Multilateral and Bilateral Organizations do not conduct as normal
procedure Impact Evaluations (IE) of development projects after their operational closure. Nonetheless, IE
methodologies do exist and are consolidated, always implying experimental or quasi-experimental designs.
Most commonly, two distinct methodologies are adopted in IE studies: randomized control trials and
baseline monitoring.
This research had the twofold objective to a) contribute to developing PCM procedure by setting up an
appropriate project baseline and b) contribute to IE methodological advancement by testing a “no control
trial” and “no baseline” methodology. It aimed to understand attributable impacts on beneficiaries – and
relevant drivers – in relation to the core objective of forestry interventions: an increased awareness of the
importance of forest resources and of their sustainable use and conservation through sound practices.
Field research was conducted in the Fouta Djallon Highlands (FDH), a series of high plateaus concentrated
in the central part of Guinea where the Gambia, Niger, Senegal and Konkouré Rivers take birth. In the ‘80s,
thanks to the support from Specialized Agencies of the United Nations, the Government of Guinea, under
the aegis of the Organization of African Unity (now African Union), engaged in the first stage of
implementation of the Regional Programme for the Integrated Development of the FDH. Twelve pilot
watersheds were identified and different donors from the International Community started field work in
each of the identified sites. In 2009, the Food and Agriculture Organization of the United Nations started
executing a ten-year capitalization project – EP/INT/503/GEF – inheriting the twelve original pilot sites plus
two new ones.
Data collection was carried out in three of the old sites: the source of the Senegal River, the source of the
Guétoya (Konkouré Watershed), and the source of the Gambia River. Although applying slightly different
approaches, the three past initiatives active in the sites focused on reforestation and had the same overall
objective: the conservation and sustainable use of the natural resources affecting the regimes of water
courses originating in the area. Field investigation tools included questionnaires administered to household
chiefs and adapted Participatory Rural Appraisal techniques and were designed to integrate with qualitative
information the statistical analysis of the household survey data. Questionnaires were structured after the
five livelihood assets of the Sustainable Livelihoods Framework (human capital, social capital, natural
capital, physical capital and financial capital) and the activity clusters of past projects, which respondents
might have participated in. Total households surveyed were 296.
Subsequent analysis focused on data collected in Tolo (Senegal River) and Bantignel (Guétoya). Impact
drivers were searched in the livelihood assets and in the kind and level of participation in project activities.
In order to organize and impose a structure on data obtained, Principal Components Analysis was
implemented on six domains of independent variables – five livelihood assets plus participation in project
activities – and on the dependant variable domain – observed and expected primary and secondary project
impacts. Multiple linear regression was implemented between each of the most representative
components of the independent variables on one side and the principal components of the dependent
iii
variable on the other, with the aim to extrapolate the drivers able to determine, increment and decrement
project impacts.
The methodology allowed to identify the impacts occurred in the investigation sites and pointed out the
kind and level of participation as well as the socio-economic and environmental factors able to determine
and enhance the identified impacts. The analysis provided guidance on four topics key to the conceiving of
future forestry projects with similar aims and in comparable contexts: participation, target beneficiaries,
project focus and interest-generating assets. It also helped understand the behavior of the different
livelihood assets within project dynamics.
The social and natural capital were found to be the most influential. The richer the social capital is, the
better people that hold it respond to project input. The natural capital is less linear. Either healthy natural
resources or vulnerable ones – water in particular – whose weakness is understood and properly
addressed, can be positive drivers of project impacts: the direction of the influence depends on how the
natural capital interacts with project focus and activities. Human and financial capital are positively
influential in the middle part of the range and become negative drivers in the lower part. An average
physical capital is a driver of increase of project impacts, provided that sufficient water supply
infrastructure is in place. A rich physical capital was found to decrease interest in project activities.
iv
LIST OF ACRONYMS
AU
African Union
BRP
Bassin Représentatif Pilote
CAD
Cellule d’Appui à la Décentralisation
CECIDE
Centre du Commerce International pour le Développement
CERE
Centre d’Etudes et Recherche en Environnement
DAC
Development Assistance Committee
DFID
Department For International Development
ENAE
Ecole Nationale d'Agriculture et d'Elevage
EC
European Commission
EU
European Union
FAC
Fonds d'aide et de coopération
FAO
Food and Agriculture Organization of the United Nations
FANTA
Food and Nutrition Technical Assistance
FDH
Fouta Djallon Highlands
ECU
European Currency Unit
FC
Financial Capital
GEF
Global Environment Facility
GERF
Gestion de l’Espace Rural et Forestier
HC
Human Capital
ICO-AU
International Coordination Office of the African Union
IE
Impact Evaluation
IFAD
International Fund for Agricultural Development
LSMS
Living Standards Measurement Study
NA
Natural Capital
NGO
Non-Governmental Organization
OECD
Organisation for Economic Co-operation and Development
OUA-BCI
Organisation de l'Unité Africaine
-Bureau de Coordination International
OAU
Organization of African Unity
PA
Project Activities
PC
Physical Capital
PCA
Principal Components Analysis
PCM
Project Cycle Management
PI
Project Impact
PRA
Participatory Rural Appraisal
v
REDD+
Reducing Emissions from Deforestation and Forest Degradation in Developing Countries Plus
RPID-FDH
Regional Programme for the Integrated Development of the Fouta Djallon Highlands
SC
Social Capital
SLF
Sustainable Livelihoods Framework
ULAP
Unité Locale d’Appui au Projet
UN
United Nations
UNEP
United Nations Environment Programme
UNDP
United Nations Development Programme
UNDESA
United Nations Department of Economic and Social Affairs
UNEG
United Nations Evaluation Group
UNESCO
United Nations Educational, Scientific and Cultural Organization
UNFF
United Nations Forum on Forests
UNSO
United Nations Sudano-Sahelian Office
USAID
United States Government Cooperation Agency
VAATEC
Volontaires Africains pour l’Assistance Technique
vi
TABLE OF CONTENTS
1. INTRODUCTION
………Page 2
2. MATERIALS AND METHODS
………Page 4
2.1. Field context
……….……….………Page 4
2.2. Data collection
……….………..Page 10
3. DATA ANALYSIS
……….Page 13
3.1. Site 1: Tolo – Senegal River
……….………Page 15
3.1.1. Principal components analysis
……….Page 15
3.1.2. Multiple linear regression
………Page 24
3.2. Site 2: Bantignel – Konkouré Watershed
……….………..Page 33
3.2.1. Principal components analysis
……….Page 33
3.2.2. Multiple linear regression
………Page 42
4. DISCUSION AND CONCLUSIONS
……….……….Page 56
5. ANNEXES
………..………..Page 61
5.1.
Household survey questionnaire of Tolo
………..Page 61
5.2.
Household survey questionnaire of Bantignel: Section 9
………Page 118
vii
LIST OF TABLES
Table 1. Past projects’ activities
……….Page 6
Table 2. Values of the most significant components of the human capital, Tolo
……….Page 16
Table 3. Variables of the human capital principal components, Tolo
……….……….Page 16
Table 4. Descriptions of the human capital principal components, Tolo
………..………..……….Page 16
Table 5. Values of the most significant components of the social capital, Tolo
……….….………..Page 17
Table 6. Variables of the social capital principal components, Tolo
……….………..……….……….Page 17
Table 7. Descriptions of the social capital principal components, Tolo
………..……….Page 17
Table 8. Values of the most significant components of the natural capital, Tolo
……….…………..Page 18
Table 9. Variables of the natural capital principal components, Tolo
……….………..……….Page 18
Table 10. Descriptions of the natural capital principal components, Tolo
………....……….Page 18
Table 11. Values of the most significant components of the physical capital, Tolo
………..…………..Page 19
Table 12. Variables of the physical capital principal components, Tolo
………..…….……….……….Page 19
Table 13. Descriptions of the physical capital principal components, Tolo
……….……...……….Page 19
Table 14. Values of the most significant components of the financial capital, Tolo
………..…………..…………..Page 20
Table 15. Variables of the financial capital principal components, Tolo
………..…….……….………..………..………….Page 20
Table 16. Descriptions of the financial capital principal components, Tolo
………..…….……...……….Page 20
Table 17. Values of the most significant components of project activities, Tolo
………..……….…..…………..Page 21
Table 18. Variables of project activities principal components, Tolo (1)
.…….……….……….……….……….Page 21
Table 19. Variables of project activities principal components, Tolo (2)
.…….……….……….……….……….Page 21
Table 20. Descriptions of project activities principal components, Tolo
……….………...………Page 21
Table 21. Values of the most significant components of project impacts, Tolo
………..……….…..…………..Page 22
Table 22. Variables of project impacts principal components, Tolo (1)
.…….……….……….………..……….……….Page 22
Table 23. Variables of project impacts principal components, Tolo (2)
.…….……….……….…………..……….……….Page 22
Table 24. Descriptions of project impacts principal components, Tolo
………..….………...………Page 23
Table 25. Model’s parameters of Project Impact 1, Tolo
……….………...……….Page 25
Table 26. Descriptions of significant components for Project Impact 1, Tolo
……….………...…Page 25
Table 27. Model’s parameters of Project Impact 2, Tolo
……….………...……….Page 28
Table 28. Descriptions of significant components for Project Impact 2, Tolo
……….………...…Page 28
Table 29. Model’s parameters of Project Impact 3, Tolo
……….………...……….Page 31
Table 30. Descriptions of significant components for Project Impact 3, Tolo
……….………...…Page 31
Table 31. Values of the most significant components of the human capital, Bantignel
………..……….Page 34
Table 32. Variables of the human capital principal components, Bantignel
……….………..………..……….Page 34
Table 33. Descriptions of the human capital principal components, Bantignel
……….……….Page 34
Table 34. Values of the most significant components of the social capital, Bantignel
………..……….Page 35
viii
Table 36. Descriptions of the social capital principal components, Bantignel
……….……….Page 35
Table 37. Values of the most significant components of the natural capital, Bantignel
………..………..……….Page 36
Table 38. Variables of the natural capital principal components, Bantignel
……….………..…………..……….Page 36
Table 39. Descriptions of the natural capital principal components, Bantignel
……….………..…….Page 36
Table 40. Values of the most significant components of the physical capital, Bantignel
………..…...……….Page 37
Table 41. Variables of the physical capital principal components, Bantignel
……….………..…………..………….……….Page 37
Table 42. Descriptions of the physical capital principal components, Bantignel
………..…………..…….Page 37
Table 43. Values of the most significant components of the financial capital, Bantignel
………..………..……….Page 38
Table 44. Variables of the financial capital principal components, Bantignel
……….………..…..……….Page 38
Table 45. Descriptions of the financial capital principal components, Bantignel
……….………..…….Page 38
Table 46. Values of the most significant components of project activities, Bantignel
………..……..…………..Page 39
Table 47. Variables of project activities principal components, Bantignel (1)
.…….……..….…..…….….………..….……….Page 39
Table 48. Variables of project activities principal components, Bantignel (2)
.……….……….……….……….Page 39
Table 49. Descriptions of project activities principal components, Bantignel
……….…………..………Page 39
Table 50. Values of the most significant components of project impacts, Bantignel
………..……….………Page 40
Table 51. Variables of project impacts principal components, Bantignel (1)
.……….……Page 40
Table 52. Variables of project impacts principal components, Bantignel (2)
.……..……….……….…Page 40
Table 53. Descriptions of project impacts principal components, Bantignel
………Page 41
Table 54. Model’s parameters of Project Impact 1, Bantignel
……….………...………..……….Page 43
Table 55. Descriptions of significant components for Project Impact 1, Bantignel
………..………...…Page 43
Table 56. Model’s parameters of Project Impact 2, Bantignel
……….………...………..……….Page 47
Table 57. Descriptions of significant components for Project Impact 2, Bantignel
………..………...…Page 47
Table 58. Model’s parameters of Project Impact 3, Bantignel
……….………...………..……….Page 50
Table 59. Descriptions of significant components for Project Impact 3, Bantignel
………..………...…Page 50
Table 60. Model’s parameters of Project Impact 4, Bantignel
………..……….………...………..……….Page 53
ix
LIST OF FIGURES
Figure 1. Project Cycle Management
……….Page 2
Figure 2. Research sites
………..……….Page 5
Figure 3. Sustainable Livelihoods Framework
……….Page 11
Figure 4. Livelihood assets
……….……….Page 11
Figure 5. Satellite map of Tolo
……….……….Page 15
Figure 6. Most influential components for Project Impact 1, Tolo
……….……….Page 24
Figure 7. Most influential components for Project Impact 2, Tolo
……….……….Page 27
Figure 8. Most influential components for Project Impact 3, Tolo
……….……….Page 30
Figure 9. Satellite map of Bantignel
……….………Page 33
Figure 10. Most influential components for Project Impact 1, Bantignel
………..……….……….Page 42
Figure 11. Most influential components for Project Impact 2, Bantignel
………..……….……….Page 46
Figure 12. Most influential components for Project Impact 3, Bantignel
………..……….……….Page 49
Figure 13. Most influential components for Project Impact 4, Bantignel
………..……….……….Page 52
1
To the people
2
1. INTRODUCTION
In 2006, UNFF estimated the official development assistance funding for forestry at US$ 1.1 billion per year
(Tomaselli, 2006). Funding under REDD+ and other mechanisms linked to the Kyoto Protocol must be added
to this figure, meaning that the overall investment is significant.
Forestry is crucial for the development cooperation sector as it combines ecological and socio-economic
concerns (FAO, 1997): regulation of water regimes, soil erosion control, climate change mitigation and
adaptation, biodiversity conservation, timber, fuel wood, fodder and other non-wood forest products,
cultural and recreational values.
Accordingly, forestry projects can have multiple objectives (FAO, 1985 and 1993): support to forest-based
enterprises, development of commercial and protection plantations, conservation and expansion of natural
forests, diminished pressure on natural resources, carbon sequestration, etc.
They tend to apply integrated approaches to reverse detrimental agro-pastoral and extraction practices
and to support the environmental core of the action with sustainable income generating activities.
In the light of allocated funds and the variety of dimensions covered by forestry field projects, it is licit to
wonder what the impacts
1of these interventions are.
Figure 1. Project Cycle Management (FAO, 2001)
Yet, it is not easy to find answers. Following the standard Project Cycle Management (Figure 1), Multilateral
and Bilateral Organizations do not conduct as normal procedure Impact Evaluations
21 OECD-DAC Glossary defines impact as “positive and negative, primary and secondary long-term effects produced by a
development intervention, directly or indirectly, intended or unintended.” [OECD-DAC, 2001]
of development
2 This study follows the definition of Impact Evaluation provided by Howard White: “The difference in the indicator of interest (Y)
with the intervention (Y1) and without the intervention (Y0). That is, impact = Y1 – Y0. An impact evaluation is a study which tackles the issue of attribution by identifying the counterfactual value of Y (Y0) in a rigorous manner.” [White, 2010]
3
projects after their operational closure (EC, 2004), with resulting limited opportunities to take stock of
lessons learned and to monitor long-term dynamics and processes.
Nonetheless, IE methodologies do exist and are consolidated, always implying experimental or
quasi-experimental designs (Baker, 2000; UNEG, 2013).
Most commonly, two distinct methodologies are adopted in IE studies: randomized control trials and
baseline monitoring.
The first one is based on the assumption that control sites can act as neutral counterfactuals to measure
impacts on treated sites. Yet, endogenous or exogenous processes, independent from the monitored
project, happen anyway, making the supposed neutrality of control sites at least questionable. It also poses
the ethical issue of implementing project activities within certain beneficiary communities selecting others
as pure observation target. The second one is based on ex-ante establishment of baseline information to be
monitored against subsequent data collections on the same sample and indicators to detect changes
induced by a project. While the second methodology is more scientific sound and meets the preference of
the author, it leaves open the question of how an appropriate baseline should be set up.
This study has the twofold objective to a) contribute to developing PCM procedure by setting up an
appropriate project baseline and b) contribute to IE methodological advancement by testing a “no control
trial” and “no baseline” methodology.
To develop point b) it resorts to Theory-Based Evaluation approaches, which encompass broader design
types, use a variety of methods (both quantitative and qualitative) and are suitable to address complex
questions.
Within Theory-Based Evaluations, a Theory of Change helps identify factors and drivers that determine,
increment or decrement observed and expected impacts, assuming that aimed actions are followed by
desired impacts, thus also determining attribution
3Given the substantial funds allocated and the variety of dimensions dealt with by forestry projects, this
study aims at understanding attributable impacts on beneficiary communities with respect to the core
objective of such interventions: an increased awareness of the importance of forest resources and of their
sustainable use and conservation through sound practices. With the aim to enhance the long-term
sustainability of forestry field projects, it seeks answers to the following research questions:
to specific interventions (UNEG, 2013). For instance,
community members trained in nursery and reforestation activities are likely to continue planting trees.
1. Under what socio-economic and environmental conditions and level of participation, do the applied
approaches of forestry projects result in long-lasting impacts in terms of increased awareness of
the importance of forests, diminished pressure on natural resources, adoption of sustainable
practices and ownership over the proposed innovations?
2. How do future forestry projects need to be conceived and interwoven into the local
socio-economic texture in order to produce the impacts above?
3OECD-DAC Glossary defines attribution as the “ascription of a causal link between observed (or expected to be observed) changes
4
2. MATERIALS AND METHODS
Field research was conducted in the Fouta Djallon Highlands, a series of high plateaus ranging from 900 to
1500 m a.s.l., concentrated in the central part of Guinea and extending into Guinea-Bissau, Mali, Senegal
and Sierra Leone. The Highlands are the point of origin of a number of regionally important rivers including
the Gambia, Niger, Senegal and Konkouré Rivers. Due to their geographic and climatic diversity the
Highlands and surrounding foothills harbor a rich diversity of ecosystems that include savannah, dry forest,
high forest, lentic, lotic, as well as agro-ecosystems (FAO, 2008). The mean annual precipitation varies from
626 mm to 2428 mm depending on latitude and longitude (FAO, 2012).
2.1. Field context
The FDH are predominantly inhabited by the Fula ethnic group and extensive subsistence agriculture is still
the principal source of livelihood for most households. Farming is often complemented by small-scale
livestock rearing (cows, goats, sheep and chicken). Due to the mountainous topography of the area, several
types of land are exploited for agricultural production. They include kitchen gardens, delimited by fenced
perimeters surrounding the houses and cultivated exclusively by women, as well as external fields in the
valley bottoms, the plains and on the slopes (Ceci et Al., 2013).
Typical crops of kitchen gardens are maize, cassava, taro, sweet potatoes, groundnuts, beans and
vegetables for daily consumption, including tomatoes, eggplants, chili peppers and okra. On the slopes,
mountain rice and fonio, but also cassava, maize and groundnuts, are cultivated with the slash-and-burn
system. In the plains, fonio is mostly cultivated. In the fertile valley bottoms, where dry-season agriculture
is more easily practicable due to adjacent streams, the main crops are tomatoes, cabbages, eggplants,
onion, chili peppers, potatoes, sweet potatoes, beans, okra, lettuce, paddy rice and maize. With the
exception of lowland vegetable production, all agricultural stock produced is destined for household
self-consumption. Land is allocated to villagers by the most influential families, i.e. the descendants of those
who came first to the area during the Fula colonization of the highlands. A recent phenomenon of massive
outmigration of work-age men (CECIDE, 2012) is significantly increasing the number of female-headed
households (Ceci et Al., 2013).
International recognition of the need for a more collaborative approach to the integrated management of
the FDH originates from the International Soils Conference held in Dalaba, Guinea, in 1959. The focus was
on soil and water conservation and regulation of the regimes of rivers flowing from the FDH (Gupta, 1986).
However, it was not until the beginning of the 1970s, following the Sahelian drought, that a concerted
action was agreed upon under the aegis of OAU, during the 33
rdSession of Council of Ministers in Monrovia
(Liberia) (FAO, 2008).
In 1979, OAU requests UNEP to integrate the management and conservation of the FDH into the
transnational project Green Belt to the South of the Sahara. In the same year, UN solicit UNEP to include
the restoration of the FDH in the strategy to fight against drought and desertification. In this context, OAU
requests and obtains from the UN System financial and technical aid to undertake a vast project for the
management and conservation of the natural resources of the FDH, considered as the water tower of West
Africa (Gupta, 1986).
5
In 1981, thanks to the support from UN Specialized Agencies, the Government of Guinea, under the aegis of
OAU (now AU), officially engages in the first stage of implementation of the
Regional Programme for the
Integrated Development of the Fouta Djallon Highlands
. This stage is implemented from 1984 to 1986 in
collaboration with UNEP, FAO, UNESCO and UNSO, through project RAF/81/060 (OUA-BCI, 1998).
Project RAF/81/060 identifies and works on 12 pilot sites (Bassins Représentatifs Pilotes), mainly conducting
socio-economic and environmental studies. Subsequently, several donors (UNDP/FAO, FAC, EU, Italian
Cooperation, USAID and Peace Corps) start field work in each of the identified sites, that are important
watersheds and sources of the major regional rivers (OUA-BCI, 1998).
In 2009, FAO starts executing a ten-year capitalization project funded by GEF and implemented by UNEP.
Project EP/INT/503/GEF “
FDH Integrated Natural Resources Management Project”
covers the twelve original
pilot sites in Guinea plus two new ones. It also extends field or normative work to the other seven countries
that depend on waters from the Highlands (Guinea-Bissau, Mali, Mauritania, Niger, Sierra Leone, Senegal
and The Gambia). The project aims to mitigate the causes and negative impacts of land degradation on the
structural and functional integrity of the ecosystems of the FDH and to improve rural livelihoods of the
population directly or indirectly dependent on them (FAO, 2008).
Data collection for this study was carried out in three sites inherited by project EP/INT/503/GEF from past
initiatives: the source of the Senegal River, Bafing in local language, Sub-prefecture of Tolo; the source of
the Guétoya, Konkouré Watershed, Sub-prefecture of Bantignel; and the sources of the Gambia River,
Dimma in local language, Sub-prefecture of Tountouroun (see Figure 2).
6
The site of Tolo (Prefecture of Mamou) was covered by two subsequent projects funded by FAC (26.6
million French Francs) and the Government of Guinea (155 million Guinean Francs) between 1988 and
1996: Projet d’Aménagement des BRP de Bafing et Balé and GERF CAD-Bafing (OUA-BCI, 1998).
Project GUI/86/012 (Projet d’Aménagement du BRP Guétoya) was executed by FAO in Bantignel (Prefecture
of Pita) from 1988 to 1993, with funding from UNDP (3.19 million US Dollars) and the Government of
Guinea (246 million Guinean Francs) (OUA-BCI, 1998).
Tountouroun (Prefecture of Labé) was one of the implementation sites of Projet Régional d’Aménagement
des Bassins Versants Types du Haut Niger (1991-1998) et de la Haute Gambie (1993-1998), with funding
from the EU (31.5 million ECUs) and the Italian Cooperation (6 million ECUs) (OUA-BCI, 1998).
All the three initiatives had the same general objective, i.e. the conservation and sustainable use of the
natural resources affecting the regimes of the rivers originating in the FDH. They focused on reforestation,
mainly with exotic forest species, in particular: Acacia auricoliformis, Acacia mangium, Pinus kesya, Pinus
caribaea, Pinus oocarpa, Eucalyptus camaldulensis, Eucalyptus torreliana, Gmelina arborea, Tectona
grandis, Erythrophleum and Afzelia africana.
The three projects applied slightly different approaches. In Tolo, the emphasis was on institutional support
for the conservation of classified forests (forêts classées), in Bantignel on plantations of exotic species and
in Tountouroun on education, training and community forestry. Forest conservation and reforestation
activities were accompanied by the promotion of sustainable agro-pastoral practices aimed to decrease the
pressure on natural resources. Socio-economic infrastructures were also implemented as accompanying
measures (for a complete list of project activities see Table 1).
Tolo: BRP Bafing-source and GERF CAD-Bafing (1988 – 1996)
A) Forest cover enhancement and protection
• Practice of early fires• Village committees to fight against forest fires • Enrichment of kitchen gardens
• Use of improved stoves • Use of pressed bricks • Community forest nurseries • Groups of nursery practitioners • Supply of forest tree seedlings • Reforestation of water sources • Reforestation of classified forests • Reforestation of community forests • Reforestation of quarries
• Anti-erosive biological measures • Anti-erosive retaining walls • Arboretum
7
B) Agro-sylvo-pastoral development
• Valley bottom management• Horticulture groups • Supply of fruit tree seedlings • Groups of livestock breeders • Cattle corridors
• Use of salt licks
• Cattle fattening with cottonseed • Livestock vaccination
• Propagation of cassava and sweet potatoes by stem cuttings
C) Training and education
• Training in fruit tree nursery and grafting techniques• Sensitization on environmental protection • Study tours in Guinea (Guétoya) • Training in the use of plow
D) Socio-economic infrastructures
• Project facilities• Leveling of rural roads (Mamou-Tolo) • Maintenance of rural roads (Tolo-Guilinti) • Refurbishment of the forest house • Improved wells
• Managed water sources
E) Environmental monitoring
• Installation of meteorological stations • Installation of hydrological stations
Bantignel: BRP Guétoya – Gui/86/012 (1988 – 1993)
A) Forest cover enhancement and protection
• Community forest nurseries• Reforestation of riparian forests • Reforestation of water sources • Community forest plantations • Forest tree seed production
• Planting of exotic forest trees in kitchen gardens • Forestry group
• Village committees to fight against forest fires • Planted forest strips
8
• Erosion control with planted forest strips
• Erosion control with fascines, wattles and retaining walls
B) Agro-sylvo-pastoral development
• Intercropping with fodder species• Enrichment of pastures • Livestock vaccination • Beekeeping groups
• Valley bottom management • Horticulture groups
• Fruit tree planting in kitchen gardens
C) Training and education
• Training for farmers• Training for resource farmers • Training for farmer technicians • Training for livestock breeders • Training for technical service staff • Study tours in Guinea
• Study tours abroad
D) Socio-economic infrastructures
• Project facilities• Leveling of rural roads • Construction of schools • Refurbishment of schools • Improved wells
• Managed water sources
• Small irrigation dams for market gardens
E) Environmental monitoring
• Installation of hydrological stations• Installation of meteorological stations
Tountouroun: BRP Haute Gambie (1993 – 1998)
A) Forest cover enhancement and protection
• Supply of bamboo cuttings• Living fences
• Reforestation of water sources • Reforestation of community forests • Reforestation of classified forests
9
• Reforestation of natural forests • Reforestation of riparian forests
• Planting of exotic forest trees (including in kitchen gardens)
• Forestry groups
• Groups for diffusion of improved stoves
B) Agro-sylvo-pastoral development
• Pest management (termites)• Conservation of oranges • Supply of coffee seedlings • Compost pits
• Improved fodder (Stylosanthes) • Groups of livestock breeders • Beekeeping groups
• Horticulture groups • Soap-making groups • Dyeing groups
• Fruit tree planting (including in kitchen gardens)
C) Training and education
• Training for farmers• Training for resource farmers • Training for farmer technicians • Training for technical service staff • Alphabetization
• Study tours in Guinea • Study tours abroad
D) Socio-economic infrastructures
• Project facilities• Leveling of rural roads • Construction of schools • Refurbishment of schools • Improved wells
• Managed water sources
• Small irrigation dams for market gardens
E) Environmental monitoring
• Installation of hydrological stations• Installation of meteorological stations
10
2.2. Data collection
In order to collect data, a seven-month mission was fielded in Guinea from January 22
ndto August 15
th,
2012. Field data collection was facilitated by staff, logistics and facilities of project EP/INT/503/GEF and by
ULAP members of Mamou and Labé. From the project office in Conakry, two long missions to project sites
were implemented. The purpose of the first mission, from February 7
thto April 4
th, was to make the
acquaintance of activities, realizations and modus operandi of the three past projects implemented in the
context of RPID-FDH, whose impacts are the subject of this study. The information needed was retrieved
through open interviews with past projects’ officers, technicians and beneficiaries, search and copy of
reports and studies, direct observation of project realizations and focus groups with stakeholders.
During the second mission, from May 21
stto August 4
th, additional techniques of Participatory Rural
Appraisal and an extensive household survey were undertaken. Field research was conducted in French
(national language) and Pular (local language). To accomplish field work, a local research team was set up
consisting of one environmental scientist (CERE – University of Conakry), one livestock and two agriculture
experts (ENAE) and one agroforestry expert (NGO VAATEC).
Investigation tools were designed to integrate with qualitative information the statistical analysis of survey
data. They included questionnaires administered to household chiefs (UNDESA, 2005a and 2005b) and
adapted PRA techniques: open interviews, transect walks and direct observation, focus groups,
semi-structured interviews and village histories (FAO, 1995 and 1999).
The research sample was carefully assessed and chosen. Four villages were selected in each of the three
sites (Tolo, Bantignel and Tountouroun). In order to be suitable for research objectives, selected villages
needed to be considered in the current work plan of project EP/INT/503/GEF and covered in the past by the
analyzed forestry projects.
Given the homogeneity of the reference population, the survey sample was selected through the random
sampling method. In each village, from a minimum of 18 to a maximum of 30 questionnaires were
administered. In view of the fact that one sector (the main village plus the hamlets) does not count more
than 50 households on average, the surveyed sample has to be considered representative.
In order to be locally adapted, the household survey questionnaire was designed between the first and the
second mission to project sites and was based on field observation and information retrieved during the
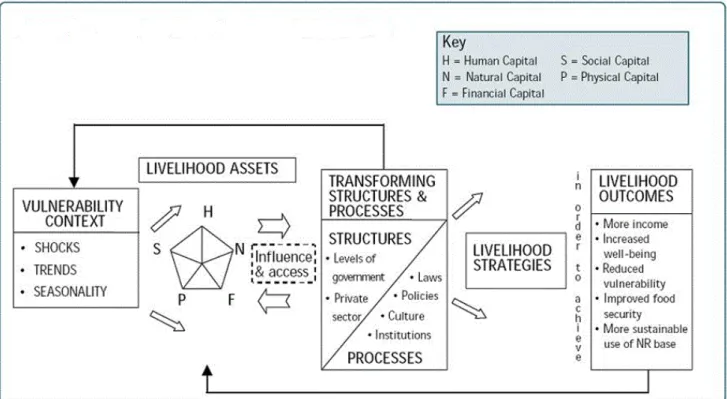
first mission. The questionnaire was conceptually structured after the DFID’s Sustainable Livelihoods
Framework (DFID, 1999), in particular the livelihood assets (Figure 3 and 4), and sought to gather people’s
perceptions of the state of their resources besides quantitative data. It was shaped upon tested tools and
indicators specifically developed for the region: The World Bank’s
Living Standards Measurement Study
(Grosh
& Glewwe, 2000) and
LSMS
-
Integrated Surveys on Agriculture (Bandyopadhyay et Al., 2011; McCarthy, 2011)
,
USAID’s FANTA
Household Food Insecurity Assessment Scale (Coates et Al., 2006; Ballard et Al., 2011)
, IFAD’s
PRAADEL Impact Evaluation Questionnaire (Keita, 2007) and AU’s Monitoring and Management Indicators
for the Fouta Djallon Highlands Natural Resources and Environment (ICO-AU, 2011).
The resulting household survey instrument is divided into nine sections with logical flow and counts 362
questions. The first eight sections are identical for each site and aimed at gathering a project baseline
based on the livelihood assets (Bond & Mukherjee, 2002). The last section differs for each site and targeted
participants to past projects with questions about their involvement in specific project activities and the
continuation of such activities in the present (see Annex 1 and 2). The total households surveyed
throughout the three sites amount to 296. The list below provides specifications on the data obtained:
• Tolo: 86 filled questionnaires (16 participants to the past project, 19%), 4 semi-structured
interviews with focus groups (socio-economic interest groups), 2 village histories;
11
Figure 3. Sustainable Livelihoods Framework (DFID, 1999)
12
• Bantignel: 93 filled questionnaires (12 participants to the past project, 13%), 7 semi-structured
interviews with focus groups (socio-economic interest groups), 3 village histories;
• Tountouroun: 117 filled questionnaires (18 participants to the past project, 15%), 7 semi-structured
interviews with focus groups (socio-economic interest groups), 4 village histories.
13
3. DATA ANALYSIS
A 296-household survey database was set up and statistical analysis was undertaken in order to understand
impacts and impact drivers of past forestry projects as well as to provide recommendations to the ongoing
project EP/INT/503/GEF and to future initiatives with similar objectives and in comparable socio-economic
and environmental contexts.
Data collected were organized in matrices, one for each site. Subsequent analysis was developed through
the statistical software XLSTAT. In order to organize and reduce the amount of the data obtained, principal
components analysis (PCA) was used as first step of data treatment. Afterwards, in order to identify the
drivers able to determine, increment and decrement project impacts, multiple linear regression was
implemented.
The PCA is a statistical technique that linearly transforms an original set of variables into a
substantially smaller set of uncorrelated variables that represents most of the information in the
original data set.
[Duntenam, 1989]
The PCA proved to be very useful in social sciences.
Many times a social researcher has numerous correlated measures within a particular domain. In
order to both simplify and impose some structure on the domain, the researcher would be
interested in reducing the number of variables from p to a much smaller set of k derived variables
that retain most of the information in the original p variables. [Duntenam, 1989]
Any principal component can be defined as a synthetic variable of the phenomenon.
The weights for each principal component are given by the eigenvectors of the correlation matrix
while the variance for each principal component is given by the eigenvalue of the corresponding
eigenvector. The components are ordered so that the first component (PC1) explains the largest
possible amount of variation in the original data. The second component (PC2) is completely
uncorrelated with the first component, and explains additional but less variation than the first
component, subject to the same constraint. Subsequent components are uncorrelated with
previous components; therefore, each component captures an additional dimension in the data,
while explaining smaller and smaller proportions of the variation of the original variables. [Vyas &
Kumaranayake, 2006]
In order to answer the first research question
4•
P
otential project impact drivers were
searched in
the SLF’s livelihood assets (data from the first
eight sections of the questionnaire) and in the kind and level of participation in past project
activities
, the following procedural steps were implemented:
5
• The most significant variables
(ninth section).
6
4 Under what socio-economic and environmental conditions and level of participation, do the applied approaches of forestry
projects result in long-lasting impacts in terms of increased awareness of the importance of forests, diminished pressure on natural resources, adoption of sustainable practices and ownership over the proposed innovations?
were organized in seven matrices, six matrices for the independent
variables (X) and one for the dependant variable (Y). Five X matrices correspond to the livelihood
assets: human capital, social capital, natural capital, physical capital and financial capital. The sixth
5 See Table 1, project activities in Tolo and Bantignel.
6 The split of questions with multiple answers into several dichotomy questions (0-1) resulted in 819 total variables for each of the
86 observations of Tolo, and in 825 total variables for each of the 93 observations of Bantignel. For the PCA, only quantitative and qualitative variables that could be ordered were used. After rigorous selection of the most significant ones, 232 variables were retained for the PCA of Tolo and 218 for the PCA of Bantignel.
14
X matrix includes data on the participation in past project activities. The Y matrix corresponds to
past project impacts on both the participants (ninth section of the questionnaire) and the referring
community (derived from the first eight sections of the questionnaires, based on expected impacts
of implemented activities
7• For every matrix, a PCA was implemented and the most representative principal components were
selected
).
8• Finally, in order to extrapolate the drivers of primary
, interpreted and titled, obtaining 20 independent synthetic variables and 4 dependent
synthetic variables for Tolo, and 22 independent synthetic variables and 4 dependent synthetic
variables for Bantignel.
9
and secondary
10impacts, multiple linear
regression was implemented for each type of project impact identified by the PCA.
7 See Introduction: Theory of Change.
8 Principal components were selected on the basis of the level of cumulative explained variability and the capacity of the
component itself to describe the phenomenon as per field observation.
9 “Primary impact” refers to the impact on direct project participants. 10 “Secondary impact” refers to the impact on the whole community.
15
3.1. Site 1: TOLO – Senegal River
Figure 5. Satellite map of Tolo
3.1.1. Principal components analysis
For each of the 7 PCA of Tolo (human capital, social capital, natural capital, physical capital, financial
capital, participation in project activities and project impacts), the most significant components – from 40%
to 58% of cumulative explained variability – were selected, obtaining 20 independent synthetic variables
and 4 dependent synthetic variables. See Tables below for the interpretation and titling process.
16
Human Capital
F1
F2
F3
F4
F5
F6
F7
[...]
F21
Self-value
3,576
2,997
2,282
1,924
1,577
1,392
1,248
…
0,127
Variability (%)
16,254 13,623 10,371
8,744
7,170
6,326
5,674
…
0,579
Cumulative sum
(%)
16,254 29,877 40,248 48,993 56,163 62,489 68,163
…
100,000
Table 2. Values of the most significant components of the human capital, Tolo
The PCA of the human capital matrix, which counts 22 variables, allowed to select 4 principal components
over the total 21, for an explained variability of 49%. Table 2 shows for each component how much and in
what direction the variables contribute to determine the component itself. The most significant variables
for each of the main components (highlighted in light blue in Table 3) were identified and allowed to
interpret, describe and title the selected components. Table 3 displays the descriptions of the human
capital principal components. It was generally possible to rank the components according to, for instance,
higher or lower vulnerability of the described capital.
17
This procedure was repeated for each X matrix as well as for the Y matrix. See Tables below.
Social Capital
F1
F2
F3
F4
F5
F6
F7
[...]
F23
Self-value
6,513
2,521
2,240
1,789
1,398
1,143
1,131
…
0,020
Variability (%)
28,318 10,963
9,740
7,776
6,079
4,971
4,918
…
0,086
Cumulative
sum (%)
28,318 39,281 49,021
56,797
62,876
67,847
72,765
…
100,000
Table 5. Values of the most significant components of the social capital, Tolo
The PCA of the social capital matrix, which counts 23 variables, pointed out 3 principal components over 23,
for an explained variability of 49%.
18
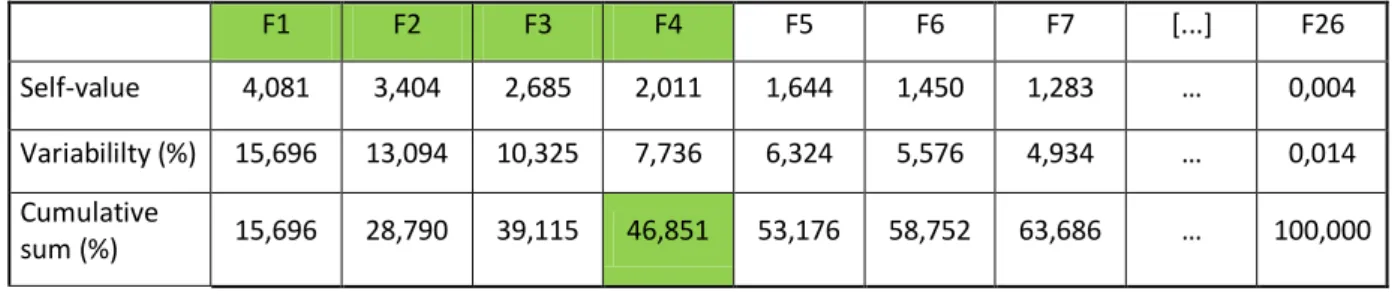
Natural Capital
F1
F2
F3
F4
F5
F6
F7
[...]
F26
Self-value
4,081
3,404
2,685
2,011
1,644
1,450
1,283
…
0,004
Variabililty (%) 15,696
13,094
10,325
7,736
6,324
5,576
4,934
…
0,014
Cumulative
sum (%)
15,696
28,790
39,115
46,851
53,176
58,752
63,686
…
100,000
Table 8. Values of the most significant components of the natural capital, Tolo
The PCA of the natural capital matrix, which counts 26 variables, pointed out 4 principal components over
26, for an explained variability of 47%.
19
Physical Capital
F1
F2
F3
F4
F5
F6
F7
[...]
F23
Self-value
4,080
2,656
2,351
1,746
1,453
1,427
1,174
…
0,103
Variability
(%)
17,741
11,550
10,224
7,590
6,316
6,203
5,105
…
0,449
Cumulative
sum (%)
17,741
29,290
39,514
47,103
53,420
59,623
64,728
…
100,000
Table 11. Values of the most significant components of the physical capital, Tolo
The PCA of the physical capital matrix, which counts 23 variables, pointed out 3 principal components over
23, for an explained variability of 40%.
20
Financial Capital
F1
F2
F3
F4
F5
F6
F7
[...]
F18
Self-value
3.814
2.289
1.770
1.695
1.458
1.254
0.979
…
0.146
Variability %
20.073 12.045
9.316
8.923
7.671
6.598
5.155
…
0.767
Cumulative
sum %
20.073 32.118 41.435 50.357 58.029 64.627
69.782
…
100.000
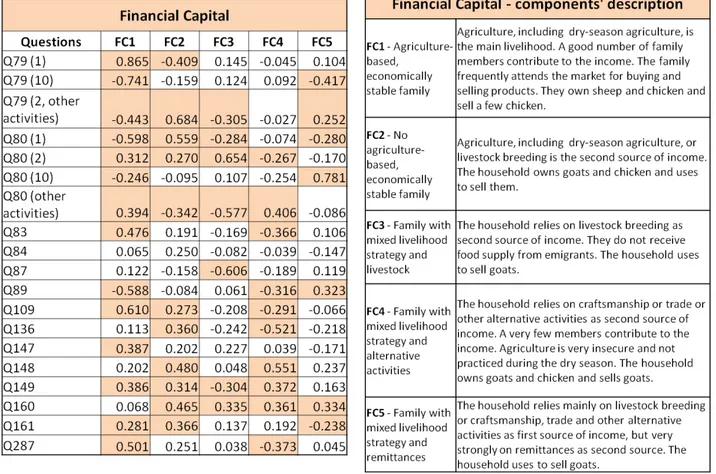
Table 14. Values of the most significant components of the financial capital, Tolo
The PCA of the financial capital matrix, which counts 19 variables, pointed out 5 principal components over
18, for an explained variability of 58%.
21
Project activities
F1
F2
F3
F4
F5
F6
F7
[...]
F17
Self-value
25.648
4.791
4.328
3.264
2.534
2.066
1.980
…
0.175
Variability % 47.496
8.873
8.015
6.045
4.693
3.825
3.666
…
0.325
Cumulative
sum %
47.496 56.368 64.383 70.428 75.121 78.946 82.613
…
100.000
Table 17. Values of the most significant components of project activities, Tolo
The PCA of the project activities matrix, which counts 57 variables, pointed out 1 principal component over
17, for an explained variability of 47%.
22
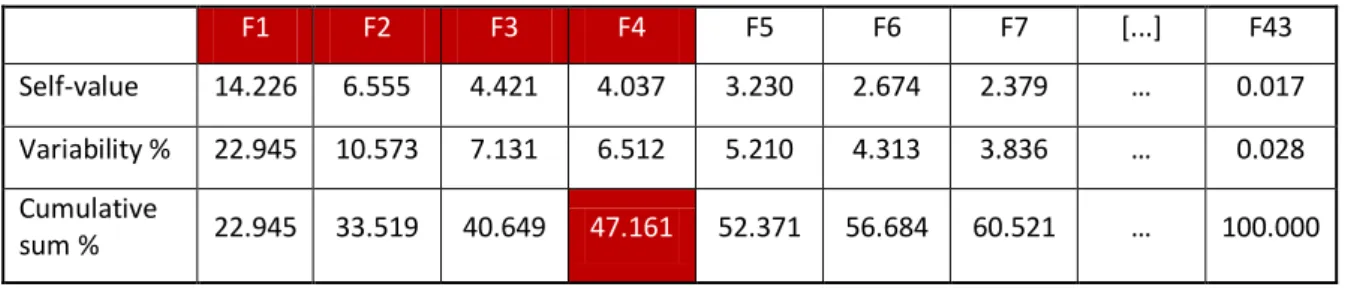
Project Impacts
F1
F2
F3
F4
F5
F6
F7
[...]
F43
Self-value
14.226
6.555
4.421
4.037
3.230
2.674
2.379
…
0.017
Variability % 22.945 10.573
7.131
6.512
5.210
4.313
3.836
…
0.028
Cumulative
sum %
22.945 33.519 40.649
47.161
52.371 56.684 60.521
…
100.000
Table 21. Values of the most significant components of project impacts, Tolo
The PCA of the project impacts matrix, which counts 62 variables, pointed out 4 principal components over
43, for an explained variability of 47%.
23
Table 24 displays the descriptions of the different project impacts that mainly occurred in the investigation
site.
24
3.1.2. Multiple linear regression
The PCA allowed to move from 232 variables to 24 principal components, 20 independent synthetic
variables (drivers) and 4 dependent synthetic variables (project impacts). For each of the most
representative project impacts identified by the PCA, multiple linear regression was implemented with the
principal components resulting from the 6 X matrices in order to extrapolate the drivers of primary and
secondary impacts.
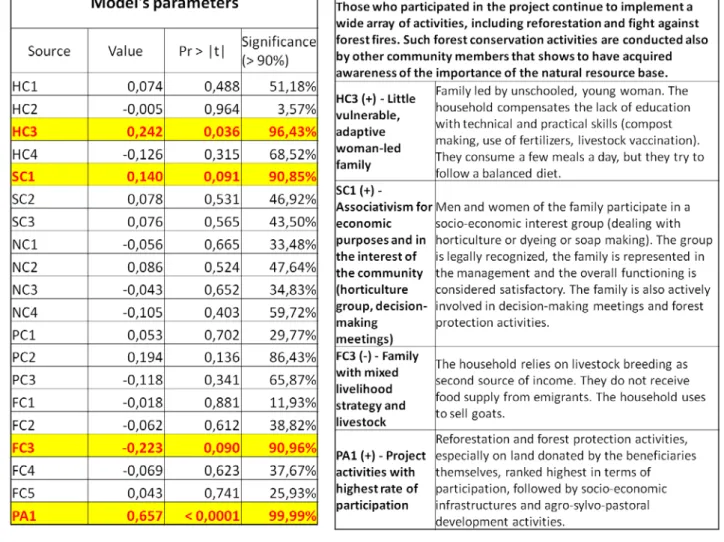
PI1 – Good, wide primary impact, fairly good secondary impact: those who participated in the project
continue to implement a wide array of activities, including reforestation and fight against forest fires. Such
forest conservation activities are conducted also by other community members that shows to have
acquired awareness of the importance of the natural resource base.
Figure 6. Most influential components for Project Impact 1, Tolo
The high value of R
2(0,911)
11indicates that the fitted model explains very well the variability in Y (PI1),
while Pr(F) <0,0001 specifies that the model fits to a great extent the observation data
1211 The coefficient of determination R2 “provides a measure of how well observed outcomes are replicated by the model, as the proportion of total variation of outcomes explained by the model.” [Steel & Torrie, 1960]
. In other words,
there is a high correlation between the identified components (Figure 6) and the dependent synthetic
variable PI1, and the former appropriately predict the value of the latter. Therefore, it is highly reasonable
to expect similar results under similar conditions. Table 25 shows the principal components with a level of
12 Pr>(F) specifies whether the observed differences are due to the case (it tends to 1) or to specific characteristics (it tends to 0), in
25
significance higher than 90%
13, which are the synthetic variables able to explain the occurrence of and the
variability in Y.
Table 25 and 26. Model’s parameters and descriptions of significant components for Project Impact 1, Tolo
Multiple linear regression identifies “Project activities with highest rate of participation”, “Little vulnerable,
adaptive woman-led family” and “Associativism for economic purposes and in the interest of the
community (horticulture group, decision-making meetings)” as drivers able to determine and increment
“Good, wide primary impact, fairly good secondary impact”.
“Family with mixed livelihood strategy and livestock” negatively affects such an impact.
The analysis provides indications about the main factors (level of participation in project activities and
target beneficiaries) that should be considered in order to achieve positive primary and secondary impacts
of forestry projects, both in the investigation site and in any other sites with similar socio-economic and
environmental characteristics
14.
13 A high level of significance is necessary to ensure that a certain component affects the model, excluding the mere case.
14Pr>(F) <0,0001 ensures the very high predictive value of the model, therefore it is possible to extend the results to all the sites
26
Participation
PA1(+) – Project activities with highest rate of participation: reforestation and forest protection activities,
especially on land donated by the beneficiaries themselves, ranked highest in terms of participation,
followed by socio-economic infrastructures and agro-sylvo-pastoral development activities (level of
significance 99,99%).
In project activities aimed to raise the awareness of the importance of natural resources and to decrease
the anthropogenic pressure on them, it is necessary to ensure a high participation and an active
involvement of the local population by generating the necessary conditions. The analysis suggests that, in
order to turn beneficiaries into active participants, they should contribute to the project some own
resources, in this case the land on which reforestation activities took place. This cost-sharing approach
ensures a continued interest in keeping project activities ongoing.
In the model, the driver of participation is the synthetic variable with the highest level of significance (see
Figure 6). This means that, no matter what other drivers can positively influence project impacts, a high and
active involvement in a variety of project activities, represents the conditio sine qua non for long-lasting
impacts on both the participants and the referring community.
Target beneficiaries
HC3(+) – Little vulnerable, adaptive woman-led family: family led by unschooled, young woman. The
household compensates the lack of education with technical and practical skills (compost making, use of
fertilizers, livestock vaccination). They consume a few meals a day, but they try to follow a balanced diet
(level of significance 96,43%).
FC3(-) – Family with mixed livelihood strategy and livestock: the household relies on livestock breeding as
second source of income. They do not receive food supply from emigrants. The household uses to sell goats
(level of significance 90,96%).
SC1(+) – Associativism for economic purposes and in the interest of the community (horticulture group,
decision-making meetings): men and women of the family participate in a socio-economic interest group
(dealing with horticulture or dyeing or soap making). The group is legally recognized, the family is
represented in the management and the overall functioning is considered satisfactory. The family is also
actively involved in decision-making meetings and forest protection activities (level of significance 90,85%).
A less obvious discussion concerns the target beneficiaries of the project. Contrary to what is often
advocated in the development arena, the analysis suggests that the best-responding target is given neither
by the poorest and neediest households, nor by the wealthiest and most conservative ones.
The target able to ensure good primary and secondary impacts and, therefore, the replication of project
activities, is not necessarily given by households led by men or literate chiefs, but also by women who have
technical skills and innovative attitude, used to actively cope with constraints (HC3). This profile excludes
stagnant, poorly innovative livelihood strategies based on traditional sources of income (FC3).
The target households should be characterized by high propensity to participate in entrepreneurial
associations (institutionalized horticulture groups in particular), decision-making processes and forest
protection activities. Families with this social capital act at the forefront of the community and are
interested in being primary actors of their own empowerment and development, therefore not caught up
in a vicious circle of assistance (SC1).
27
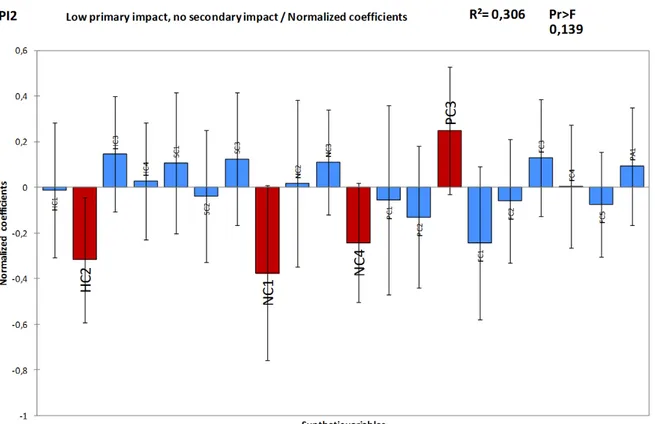
PI2 – Low primary impact, no secondary impact: limited project impact in connection with increased
awareness of the importance of forests and of their protection: all reforestations have ceased. Erosion
control measures, use of improved stoves and enrichment of kitchen gardens continue, along with use of
water supply infrastructure and livestock breading activities.
Figure 7. Most influential components for Project Impact 2, Tolo
The value of R
2(0,306) indicates that the fitted model is able to explain the variability in Y (PI2), while
Pr>(F)=0,139 points out that the model fits enough well the observation data. There is a quite good
correlation between the identified components (Figure 7) and the dependent synthetic variable PI2, and
the former can sufficiently predict the value of the latter, thus similar results can be expected under similar
conditions. Table 27 shows the principal components with a level of significance higher than 90%, which are
the synthetic variables able to explain the occurrence of and the variability in Y.
28
Table 27 and 28. Model’s parameters and descriptions of significant components for Project Impact 2, Tolo